Consolidated interim report
on operations
as at 30 September 2013
Contents
contents
Banca popolare dell'Emilia Romagna Banking Group
Directors and officers of the Parent Company at the date of approval of the
consolidated interim report on operations as at 30 September 2013
page 5 Group interim report on operations as at 30 September 2013
page 7 CONSOLIDATED FINANCIAL STATEMENTS
Consolidated financial statements as at 30 September 2013
Consolidated balance sheet
Consolidated income statement
Statement of consolidated comprehensive income
Statement of changes in consolidated shareholders' equity
page 81 page 82 page 83 page 84 CONSOLIDATED EXPLANATORY NOTES
Form and content of the consolidated interim report
as at 30 September 2013
Information on the consolidated balance sheet
Information on the consolidated income statement
Information on risks and related hedging policy
Information on consolidated shareholders’ equity
Information on business combinations
page 89 page 99 page 127 page 141 page 145 page 157 3
ATTACHMENTS
contents
Financial statements of the Parent Company as at 30 September
2013
Balance sheet
Income statement
Income statement by quarter
Statement of changes in shareholders' equity
page 167 page 168 page 169 page 170 Pro-forma financial statements of the Parent Company
4
Balance sheet as at 31 December 2012
Income statement as at 30 September 2012
page 171 page 173 Certification on the consolidated quarterly financial statements as at
30 September 2013
page 175 Directors and officers of the Parent Company at the
date of approving of the consolidated interim report
on operations as at 30 September 2013
directors and
officers
Board of Directors
Chairman:
*
Ettore Caselli
Deputy chairmen:
*
Alberto Marri
*
Piero Ferrari
*
Giosuè Boldrini
*
Luigi Odorici
Chief Executive Officer:
Directors:
Antonio Angelo Arru
Giulio Cicognani
*
Pietro Ferrari
Elisabetta Gualandri
Manfredi Luongo
Giuseppe Lusignani
Valeriana Maria Masperi
Giuseppina Mengano
Fioravante Montanari
Daniela Petitto
*
Deanna Rossi
*
Erminio Spallanzani
*
Angelo Tantazzi
* Members of the Executive Committee
Board of Statutory Auditors
Chairman:
Romano Conti
Acting Auditors:
Carlo Baldi
Guglielmo Cacchioli
Fabrizio Corradini
Pier Paolo Ferrari
Substitute Auditors:
Luigi Fontana
Luigi Attilio Mazzocchi
5
Board of Arbiters
Members:
directors and
officers
Miranda Corradi
Federico Ferrari Amorotti
Vittorio Rossi
Roberto Bernardi
Massimo Turchi
Substitute members:
Pier Luigi Cerutti
Philip Bergamini
General Management
General Manager:
Fabrizio Togni
Deputy General Managers:
Alessandro Vandelli
Eugenio Garavini
Manager responsible for preparing the company’s financial reports
Manager responsible for preparing the company’s
financial reports
6
Emilio Annovi
GROUP INTERIM REPORT
ON OPERATIONS
as at 30 September 2013
Banca popolare dell’Emilia Romagna
Banking Group
7
www.gruppobper.it
Gruppo BPER. La nostra forza è la tua forza.
Banca Popolare dell’Emilia Romagna
Banca della Campania
Banca di Sassari
Banca Popolare del Mezzogiorno
Banca Popolare di Ravenna
Banco di Sardegna
Cassa di Risparmio di Bra
Questo è il marchio del Gruppo BPER. Un gruppo bancario composto da 7 banche con oltre 1300 sportelli e 11000 uomini.
Contents
INTRODUCTION
group interim
report
1. SIGNIFICANT EVENTS AND STRATEGIC TRANSACTIONS
1.1 Strategic transactions
1.2 The Group's 2012-2014 Business Plan
1.3 Structured finance transactions
1.4 Recovery of doubtful loans
1.5 Other significant events
2. L'AREA DI CONSOLIDAMENTO DEL GRUPPO BPER
2.1 Group structure as at 30 September 2013
2.2 Composition of the Group at 30 September 2013
2.3 Changes in the scope of consolidation
3. RESULTS OF OPERATIONS
3.1 Introduction
3.2 Performance ratios
3.3 Balance sheet aggregates
3.4 Capital for supervisory purposes and capital ratios
3.5 Reconciliation of consolidated net profit/shareholders' equity
3.6 Income statement aggregates
3.7 Group employees
3.8 Geographical organisation of the Group
4. OTHER INFORMATION
4.1 Treasury shares
4.2 Ratings
4.3 Inspections by the Supervisory Authorities on Group Banks and Companies
4.4 Disclosure of exposures to sovereign debt held by listed companies
4.5 Main litigation and legal proceedings pending
5. SIGNIFICANT SUBSEQUENT EVENTS AND OUTLOOK FOR OPERATIONS
5.1 Subsequent events
5.2 Outlook for operations
11
INTRODUCTION
group interim
report
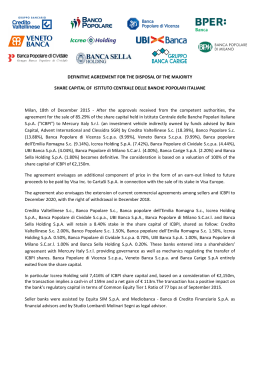
After a second quarter that saw an acceleration in global economic growth, the third quarter of
2013 will probably show only a slight decrease in this upward trend. The trend in place since the
end of the previous period will be further consolidated, with industrialised countries that ought to
see the growth differential versus emerging nations getting narrower, after being negative for
years. Fears about a decline in the amount of U.S. quantitative easing (the unconventional
monetary policy adopted by Federal Reserve to support the economy and financial markets)
have, in fact, caused a rush of investors to withdraw investments from developing countries and
this has had a negative impact on the strength of their economic growth. Increasing imbalances in
the balance of payments and geopolitical tensions have contributed to this trend.
As regards individual countries, the economy in the USA continues to be supported by the "wealth
effect". Rising financial markets (the S&P500 stock market posted new all-time highs during the
quarter), the recovery in the real estate market and the labour market in slow but progressive
improvement all help consumption and business confidence. However, the Federal Reserve has
been worried about the marked increases in yields on U.S. government bonds and mortgages,
which rose in May following fears, that subsequently failed to materialise, of "tapering", i.e. a
gradual reduction in unconventional monetary stimulus from September 2013.
In the third quarter, the Eurozone is expected to confirm the signs of recovery shown in the
second quarter, when GDP turned in growth of 0.3% q/q thanks to better than expected figures
from the German, Portuguese and French economies: this should be Europe coming out of
recession after six consecutive quarters of falling GDP. Inflation (CPI +1.1% y/y in September
2013) continued its downward trend and does not worry the ECB which, in addition to keeping
official interest rates at an all-time low of 0.5%, introduced for the first time in early July forward
guidance for the expectations of markets and investors about future levels of interest rates. For
the ECB, key rates, and therefore all those of the ECB, will remain at current levels, or even
lower, for an extended period of time and this should help keep interest rates low on the money
market.
In the third quarter, after the eighth consecutive negative figure for GDP (the second quarter of
2013 posted a fall of 0.3% q/q) Italy was shaken by new worries about political stability, which
fuelled tensions on local financial markets (which subsequently declined). At a macro level,
inflation has continued to decline (+0.9% y/y in September 2013) and there has been an
improvement in business and consumer confidence, but unemployment and public debt are
continuing to rise.
Among the major events of the quarter, in addition to what we have already said about central
banks, worth noting is the "shutdown" in America. On 30 September 2013, the American fiscal
year came to an end without Congress having passed the necessary laws to authorise the
financing of certain federal agencies, which led to their temporary closure, putting thousands of
public employees on compulsory leave. This, together with the October deadline for the public
debt ceiling, left the world in a climate of uncertainty on the economic and financial front during
the last quarter of 2013.
Source: Bloomberg
12
1. SIGNIFICANT EVENTS AND STRATEGIC TRANSACTIONS
1.1 Strategic transactions
Merger of Cassa di Risparmio della Provincia dell’Aquila S.p.A., Banca Popolare di
Lanciano e Sulmona S.p.A. and Banca Popolare di Aprilia S.p.A. to be absorbed by Banca
popolare dell’Emilia Romagna s.c.
On 11 January 2013, the Board of Directors of Banca popolare dell’Emilia Romagna s.c. ("BPER"
or the "Merging Company") and the Boards of Directors of Cassa di Risparmio della Provincia
dell’Aquila s.p.a. (CARISPAQ), Banca Popolare di Lanciano e Sulmona s.p.a. (BPLS) and Banca
Popolare di Aprilia s.p.a. (BPA) approved a merger plan for CARISPAQ, BPLS and BPA
("Companies Being Merged" or Banks of Central Italy) to be absorbed by BPER.
The merger, which forms part of the activities envisaged in the Group's 2012-2014 Business Plan,
designed to simplify and streamline the organisational structure and governance of the Group, as
well as to optimise and enhance resources and reduce operating costs, was approved by the
Bank of Italy on 5 March 2013.
The merger took place in a simplified form in accordance with art. 2505-bis of the Italian Civil
Code, as the merging company held more than 90% of the companies being merged.
The Boards of Directors of the companies taking part in the merger, assisted by independent
advisors, decided on the following share exchange ratios, without any balances to be paid in
cash:
1.01 BPER ordinary shares for every CARISPAQ ordinary share;
1.76 BPER ordinary shares for every BPLS ordinary share;
8.76 BPER ordinary shares for every BPA ordinary share.
Under art. 2505-bis of the Italian Civil Code, the shareholders of the companies to be merged,
other than BPER, had the right to have their shares bought by the merging company at a price set
in the same way as for withdrawal.
As the merger implicitly involved a heterogeneous transformation of the companies being merged
and a modification of the voting and participation rights, the shareholders of the companies other
than BPER, who did not vote in favour of the merger resolution, had the right to withdraw for all or
part of the shares that they held, pursuant to art. 2437 et seq of the Italian Civil Code. The
liquidation value of the shares was determined by the Boards of Directors of the companies being
merged, having obtained a favourable opinion from their Statutory Auditors and Independent
Auditors, as follows:
Euro 8.90 per CARISPAQ ordinary share;
Euro 13.20 per BPLS ordinary share;
Euro 58.60 per BPA ordinary share.
These amounts were also defined as the consideration to be paid to shareholders of the
companies being merged, who exercised their put option pursuant to art. 2505-bis of the Italian
Civil Code.
group interim
report
On 8 March 2013, having obtained the necessary approval from the Supervisory Authority, the
Parent Company filed the Merger Plan with the Modena Companies Register and on 11 March
2013 filed the deeds for the simplified procedure pursuant to art. 2505-bis of the Italian Civil Code.
This documentation remained available on file for thirty days prior to the merger resolution and,
until it was adopted, it was also published on the Bank’s website (www.bper.it).
On 23 April 2013, after the approval of the Extraordinary Shareholders' Meetings of the three
banks being merged on 14 April for BPLS and on 18 April for CARISPAQ and BPA, the Board of
Directors of the Parent Company BPER approved the merger by absorption of the three
13
group interim
report
subsidiaries, as well as the related changes to art. 6 of BPER's articles of association (filed with
the Modena Companies Register on 24 April 2013).
The merger took place on the weekend of 25 and 26 May, with legal effect from 27 May 2013 and
from 1 January 2013 for accounting and tax purposes.
Nadia s.p.a. acquires controlling stakes in two property companies
With a view to streamlining and reorganising its real estate assets, on 30 January 2013 Nadia
s.p.a. signed an agreement to take over the holdings of the other two shareholders and to
become the sole shareholder of Immobiliare Reiter s.p.a., already 34% owned at 31 December
2012. Within the same project, Nadia took over full control of another property company Galilei
Immobiliare s.r.l..
The acquisition of these companies by Nadia s.p.a. will make it possible to monitor and manage
more effectively the development of building land owned by the two companies, as well as the
disposal of assets that are held for sale.
Optima changes its name
With effect from 1 February 2013, Optima s.p.a. SGR changed its name to Optima s.p.a. SIM,
having obtained all the necessary approvals from the competent authorities, moving its head
office from Milan to Modena.
Sale of a controlling interest in IMMO.BI s.r.l. (property company)
On 25 February 2013, the Parent Company reached an agreement with Sequenza s.p.a. to sell its
entire controlling interest (80.90%) in Immo.Bi s.r.l. for Euro 245,924.68.
The company, which at 31 December 2012 was shown under "Non-current assets and disposal
groups held for sale", was excluded from the scope of consolidation in the first quarter of 2013.
BPER acquires control of Cassa di Risparmio di Bra
On 7 February 2013, having obtained the necessary approvals from the authorities, Banca
popolare dell’Emilia Romagna s.c. ("BPER") and Fondazione Cassa di Risparmio di Bra
("Fondazione") went ahead with the "Share purchase and sale contract" signed on 20 September
2012, involving the sale of 35.98% of Cassa di Risparmio di Bra ("CR Bra") by the Fondazione to
BPER for a total of Euro 23.9 million, paying 50% in cash and the rest in fixed-rate BPER Lower
Tier II Subordinated Bonds, maturity 7 years. This transaction gives BPER ownership of a 67%
controlling interest in the share capital of CR Bra, which means including it in the scope of
consolidation.
With a letter dated 17 May 2013, the Bank of Italy authorised the changes to CR Bra's articles of
association needed to reflect the fact that it now belongs to the BPER Group, as well as to carry
out the increase in capital needed to strengthen its capital, as required by the Supervisory
Authority at the beginning of the year.
On 11 June 2013, CR Bra convened an extraordinary shareholders' meeting to approve an
increase in capital of Euro 20,000,000, carried out by issuing 12,500,000 new shares; of these,
8,375,000 were subscribed by BPER and 4,125,000 by Fondazione.
14
Arca Impresa Gestioni SGR s.p.a.
On 21 March 2013, after a period of exclusive negotiations with Iniziativa Gestione Investimenti
SGR s.p.a., the shareholding in Arca Impresa Gestioni SGR s.p.a., which was held 100% by
BPER, was transferred, as the required authorisations had all been granted to the buyer. Arca
Impresa Gestioni SGR s.p.a. is an asset management company that specialises in the promotion
and management of closed-end private equity funds; at the end of 2012 it managed four funds,
two of which are in the investment phase, while the other two have nearly completed their
disinvestment.
On 23 July 2013, the parties decided on the final selling price and a price adjustment of Euro
255.4 thousand was paid.
Following completion of its sale, the company is no longer included in the scope of consolidation,
having been shown under "Non-current assets and disposal groups held for sale" at 31 December
2012.
group interim
report
Serfina Banca s.p.a.
On 4 June 2013 BPER's Board of Directors decided to acquire the banking business of Serfina
Banca s.p.a. in accordance with the objectives laid down in the Parent Company's 2012-2014
Business Plan, having completed the due diligence and reached an agreement with the Trade
Unions.
On 15 July 2013, the Parent Company and Serfina Banca s.p.a. signed an agreement for BPER
to purchase the affiliate's banking business, subject to the outcome of its shareholders' meeting.
Serfina's shareholders' meeting held on 19 July voted in favour of selling the banking business on
the following terms:
the price is estimated at Euro 6,215 thousand, based on the company's book balances at
31 December 2012, net of the assets/liabilities not transferred and a further provision for
loan losses;
the company's winding-up pursuant to art. 2484 of the Italian Civil Code and consequent
measures, as stipulated in the sale agreement (art. 4.1).
The transaction was completed on 30 September 2013, when the assets and liabilities that form
part of the banking business were acquired and the winding-up of company took effect for legal
purposes as it was impossible to achieve its corporate purpose, resulting in its liquidation.
The assets acquired, on the basis of the book figures at 30 September 2013, amount to Euro
65,345 thousand, of which Euro 59,166 thousand are loans, against liabilities acquired of Euro
59,269 thousand, of which Euro 48,807 thousand are customers’ deposits, including Euro 11,333
thousand of bonds.
At the same time, the two former Serfina Banca branches were structured as small branches
linked to BPER as part of the Territorial Division of Lanciano (Chieti and Pescara Branch no. 3).
1.2 The Group's 2012-2014 Business Plan
At the meeting on 13 March 2012, the Board of Directors of Banca popolare dell'Emilia Romagna
approved the 2012-2014 Business Plan: "The new BPER Group: growth, value and territory in a
country that is changing". The Business Plan was then presented to the financial community on
14 March 2012.
By developing the projects contained in the Business Plan, the Group has set as its main
objective for 2012-2014 to achieve an adequate level of profitability that is sustainable over time,
through:
15
group interim
report
greater efficiency and higher revenue;
containment of the cost base;
strengthening of the Group's operational machine;
in accordance with the strong local presence that has always been a characteristic of the BPER
Group.
The principal measures of the Business Plan can be divided into two broad categories: ordinary
and extraordinary measures, originally made up of 82 projects, of which 68 ordinary and 14
extraordinary. To date, the 82 original projects envisaged in the Master Plan have been reduced
to 74 by grouping four of them together and rescheduling another four beyond 2014.
As regards implementation and the progress being made on these original projects, to date, 49
are in progress and 6 have already been completed (including all of the mergers with BPER
envisaged in the Plan). The most important worth mentioning, including those in 2012, include:
the integration of Meliorbanca (in 2012);
the absorption of CARISPAQ, BPLS and BPA by the Parent Company, as explained
in the section entitled "Strategic transactions";
a new model of governance for the Parent Company (already concluded in 2012):
establishment of the roles of Chief Risk Officer (CRO), Chief Lending Officer (CLO), Chief
Operating Officer (COO) and Chief Financial Officer (CFO) to enhance risk management
and strengthen credit management;
a new model of governance for Group banks (started in 2012): a new organisational
model for the Group banks not involved in mergers is currently being adopted. It is geared
to higher business orientation and faster implementation of the Parent Company's
guidelines, with a particular focus on the Commercial and Lending functions;
the "Efficient management of the Group's non-performing loans" project (started in
2012).
Under ordinary operations:
enhancement of multi-channel strategy;
"Basel 2" programme: the BPER Group started work back in 2007 on the Basel 2
Programme, which is now in its final stages, dedicated to the optimisation and
maintenance of the IRB (Internal Rating Based) system in terms of organisation,
methodology and IT;
collective agreement for the staff: on 9 April 2013, the Bank completed the process of
verifying, together with the Trade Unions, the Personnel Manoeuvre included in the Group
Framework Agreement signed on 15 September 2012 to simplify the Group's organisation
and reduce overall operating costs in a structural manner. The main objective of the
agreement was to reduce the workforce by 450 people, through voluntary application to
join the redundancy incentive plan and access to the banking sector's Solidarity Fund for
income support. At the end of this verification process, the acceptance period was
extended by four months, with a consequent increase in the number of members and a
higher cost for around Euro 9 million, which was already provided for in the Income
Statement at 30 June 2013.
16
1.3 Structured finance transactions
One of the guidelines of the 2012-2014 Business Plan is to maintain an adequate liquidity profile.
Accordingly, various initiatives were planned with a view to diversifying the forms of medium/long
term financing, initially through Eurosystem's open market operations, while waiting for a
revitalisation of operators' interest in transactions with Italian counterparties, which today is
limited.
In this context, the following actions were completed during the period under review:
under the long-term programme of Guaranteed Bank Bonds ("Covered Bonds") of Euro
5 billion, intended for institutional investors, with the approval of the basic prospectus by
the Luxembourg "Commission de Surveillance du Secteur Financier" on 30 November
2011, updated on 8 August 2013, a third portfolio was sold on 1 July 2013 for a total of
some Euro 700 million, made up not only of BPER's 2012 production, but also of the
loans of the three banks recently merged with BPER (CARISPAQ, BPLS and BPA). This
sale was preparatory for a new bond issue, the third of the programme, for a total of Euro
750 million, which was carried out on 15 October 2013, as specified in the last part of this
report under "Significant subsequent events and outlook for operations";
securitisation of loans to SMEs: similar to the Estense Finance operation carried out in
2009, in 2012 it was decided to sell and securitise loans issued by BPER, acquiring on
subscription all of the securities originated by the operation, in order to have available
additional instruments eligible for refinancing with the ECB. The loans involved in the sale
were performing loans made to SMEs for a total of Euro 2.2 billion. The buyer was
Estense S.M.E. s.r.l., a special purpose vehicle which issued Senior Securities (Class A)
for Euro 1.5 billion, rated A-/A (low) by Standard & Poor’s and DBRS respectively, and
Junior Securities (Class B), which are unrated, for Euro 0.7 billion. In February 2013, the
Senior issue became available for refinancing operations with the ECB, once it had
obtained eligibility from the Central Bank of Luxembourg. The Senior Security is currently
amortising according to expectations and the residual nominal capital after the payment
date in September 2013 amounts to Euro 1,169 million;
a "Multi-originator” securitisation of lease receivables was carried out jointly by
Sardaleasing and ABF Leasing through the sale without recourse of a portfolio of
performing lease receivables, selected according to specific objective criteria, in a lump
sum to a special purpose vehicle ("SPV") called MULTI LEASE AS s.r.l.. The sale of the
receivables was formalised on 1 February 2013 and published in the Official Gazette no.
16 of 7 February 2013. The total value of the receivables sold amounted to approximately
Euro 1,018 million, of which around Euro 580 million (57%) attributable to Sardaleasing
and Euro 438 million (43%) to ABF Leasing. A "multi-originator" structure was chosen as
it permitted a significant reduction in costs, in terms of both initial structuring costs and
subsequent management costs. The SPV financed the purchase price of the receivables
by issuing:
group interim
report
Senior Class A securities of Euro 625,900,000, ISIN IT0004895733, rating: S&P’s
“A” and Fitch "A-", listed on the Dublin Stock Exchange and recognised as eligible
by the Irish Central Bank;
Junior Class B1 securities, of Euro 168,431,000, ISIN IT0004895741, unrated and
unlisted, subscribed by the seller ABF Leasing;
Junior Class B2 securities of Euro 223,417,000, ISIN IT0004895774, unrated and
unlisted, subscribed by the seller Sardaleasing.
17
group interim
report
The aim is again to raise funds for the benefit of the entire Banking Group, at competitive costs,
through refinancing with the ECB.
The Senior Security is currently amortising according to expectations and the residual nominal
capital after the payment date in July 2013 amounts to Euro 540.7 million.
1.4 Recovery of doubtful loans: securitisations and other financial transactions
Avia Pervia transaction
Following the example of the Parent Company and Meliorbanca at the end of the previous year,
on 21 March 2013, the other Group banks, excluding Cassa di Risparmio di Bra, contributed to
the multi-originator securitisation of Avia Pervia s.r.l. (9.9% owned by BPER), with the sale of a
portfolio of mortgage loans and unsecured loans classified by the Originators as non-performing,
for a total transfer price of Euro 466.4 million.
70% of the portfolios acquired (the "up-front purchase price") was financed by the SPV issuing on
17 May 2013 a series of asset-backed securities, unrated and unlisted, which will be fully
subscribed by the Originators, while the other 30% (the "deferred purchase price") was financed
by means of a credit line granted by the selling banks.
As mentioned previously, the transaction is considered as a type of multi-originator securitisation,
which involves the banks as both originators and investors.
Consequently, as the risks and benefits of the portfolios have not been transferred, these loans
have not been reversed out of the assets of the Group Banks.
The management of items in dispute has been assigned to the Originator banks themselves (as
sub-servicers) coordinated by a Group Company, Nettuno Gestione Crediti s.p.a. (as the master
servicer).
Efficient management of non-performing loans should enable the Group to take extraordinary
measures to reduce the stocks of such positions, while also optimising the direct costs involved in
managing them.
The following table summarises the assigned portfolios and related issues (the BPER portfolio
also includes the one relating to the sale made by the former Meliorbanca, which was merged in
November 2012).
18
Originator bank
Number of
positions
Nominal
value
(GBV)
Sale
proceeds
Up-front
purchase
price
Deferred
purchase
price
Banca popolare dell'Emilia Romagna
724
1,064.9
411.7
288.2
123.5
Banco di Sardegna
492
715.8
224.8
157.3
67.4
77
89.7
38.3
26.8
11.5
128
239.3
73.0
51.1
21.9
9
5.4
2.5
1.8
0.8
121
165.2
47.9
33.5
14.4
Banca Popolare di Ravenna
59
62.8
31.1
21.8
9.3
Banca di Sassari
Cassa di Risparmio della Provincia
dell’Aquila
47
59.2
27.2
19.0
8.2
57
89.3
21.6
15.1
6.5
1,714
2,491.6
878.1
614.6
263.5
Banca Popolare del Mezzogiorno
Banca della Campania
Banca Popolare di Aprilia
Banca Popolare di Lanciano e
Sulmona
TOTAL
group interim
report
Mutina transaction
Of the various securitisations carried out within the Group, still outstanding is the multi-originator
one carried out in 2002 with Mutina s.r.l. (wholly owned by BPER), which was scheduled to expire
during 2013.
As regards management of this operation, based on checks carried out by Nettuno Gestione
Crediti, acting as Master Servicer, there was evidence that the procedures for recovery of the
non-performing loans transferred takes longer than estimated at the time the securities were
issued, though the results are still positively assessed.
So, as reflected in the updated dynamic Business Plan, taking into account that the SPV will
continue to collect proceeds from the securitised portfolios well beyond the legal deadline of the
Junior Securities (the second maturity date) and at least until December 2018, at the end of last
year, an amendment to the maturity date was made, postponing the second maturity date,
originally scheduled for 9 August 2013, to 9 February 2019.
Polis fund
During the first half of 2013, the BPER Group took part, together with 12 other banks, in the
launch of "Asset Bancari III", a closed-end real estate mutual investment fund managed by Polis
SGR. Operations began on 26 June 2013 with the early closure of subscriptions and an initial
capital of Euro 98,750 thousand, divided into 395 units with a nominal value of Euro 250 thousand
each.
The BPER Group subscribed 82 units for a total nominal value of Euro 20,500 thousand, of which
61, valued at Euro 15,250 thousand resulting from the contribution of property portfolios by ABF
Leasing and Melior Valorizzazioni Immobili and 21, valued at Euro 5,250 thousand, from the
subscription of commitments to be released by paying in cash.
Against these contributions, the Fund can acquire mortgage-backed non-performing loans from
the participating companies.
Following the conclusion of the first property contributions, 45 units were assigned to the portfolio
valued at Euro 11,250 thousand, and included under "Financial assets available for sale".
19
group interim
report
Securis Real Estate Fund
On 25 June 2013, Sardaleasing and Beni Stabili Gestioni SGR s.p.a. stipulated the first
contribution of properties to the Securis Real Estate Fund, a closed-end real estate mutual
investment fund reserved for qualified investors.
This is a block of 20 properties worth a total of around Euro 8,238 thousand. The assets relate to
positions in default for a net book value of Euro 8,841 thousand, which generated a loss of
approximately Euro 600 thousand on the books of the subsidiary of the Banco di Sardegna.
The contribution led to the subscription of 120 new units of the Fund with a provisional value of
Euro 70,582 per unit, for a total of Euro 8,470 thousand.
1.5 Other significant events
Earthquake in Emilia-Romagna: BPER supports its customers
The earthquake that in May 2012 tragically hit the territory where the Parent Company has its
historical roots was commented on in considerable detail in the annual report.
Work on repairing the damage and restoring infrastructure and production facilities continued in
2013, with BPER in the front line. The Parent Company was recognised as support bank for the
provision of subsidies to households and businesses affected by the earthquake, as established
by the regional ordinances n. 29/2012 (for residential properties) and n. 57/2012 and subsequent
(for business activities).
Note that from December 2012, when this facility came to an end, the BPER Group autonomously
extended the suspension of loan repayments up to June 2013. In June 2013 the BPER Group
signed up for the ABI Agreement, which aimed to provide a further extension of this benefit to 31
December 2013 for customers still in difficulty.
In addition to any immediate damage to the Group's assets, the earthquake also resulted in a
need to pursue new activities to support and protect BPER's core activities, which immediately
involved:
mapping the effects of the earthquake on customers;
one-to-one analysis of customers in critical situations;
monitoring the evolution of critical situations over time.
Immediately after the event, the branches involved, coordinated by the Markets Department,
which collected and processed the data, carried out a census of 20,400 customers, in order to
record the impact of the earthquake on their production (companies) or professional activities
(individuals).
Based on the data obtained from the census and ever since 30 June 2012, BPER arranged for a
system of penalties to rating scores and to the value of guarantees to take into account the effects
of the earthquake, resulting in additional prudential provisions on loans in the area concerned.
Then, from July 2012, analyses and analytical monitoring of the most critical customers were
carried out, above all business customers based in the so-called "red zone" and with loans in
excess of Euro 100,000 at the time of the earthquake.
The results of this process demonstrated that the earthquake had a significant impact with serious
consequences on the business situation for a limited number of customers, even if they
represented exposures of almost Euro 7 million.
On the other hand, the majority of companies located within the scope of the investigation and
granted loans of more than Euro 100,000, which had declared damages to their property and/or
production facilities immediately after the earthquake, managed to overcome their difficulties
20
during the 12-month period under observation, either by their own means or the intervention of
the shareholders, or thanks to insurance reimbursements.
So in light of the results of these analyses, the analytical evaluations of impaired positions and
considering that further investigations tend to indicate that the negative effect of the earthquake is
already reflected in our internal ratings for both Corporate and Retail customers, the system of
penalties originally applied was eliminated from 30 June 2013.
group interim
report
Affiliated companies
On 31 January 2013, the Board of Directors of the affiliate Cassa di Risparmio di Savigliano
s.p.a. approved a bonus issue increase in capital pursuant to art. 2442 of the Italian Civil Code,
mainly using property revaluation reserves to strengthen its capital ratios, above all its Tier 1
capital ratio.
The Extraordinary Shareholders' Meeting of Cassa di Risparmio di Savigliano held on 12
September 2013 approved the bonus issue increase in capital and the consequent change in the
Articles of Association.
At the board meeting of 17 December 2012, the Directors of Alba Leasing s.p.a. approved the
Guidelines of the 2013-2015 Business Plan which includes, in particular, its obtaining bank status.
This transformation from its current status as a finance company under art. 107 requires it first to
achieve adequate levels of capitalisation; to achieve this objective, the Board of the company has
decided to ask the shareholders for fresh capital. On 28 January 2013, the Board of Directors of
BPER approved the plan to subscribe the Euro 70 million increase in the subsidiary's share
capital. As a result, Alba Leasing's share capital has gone from Euro 255 million to Euro 325
million. The Parent Company took part by subscribing 25,501,000 shares for a total of Euro 25.5
million, leaving its percentage ownership the same as at 31 December 2012.
Alba Leasing's Business Plan, which was approved by the subsidiary's Board of Directors on 25
May 2013, provides, among other things, for the start of the reorganisation and rationalisation of
the operating structure in order to achieve improvements in efficiency, as well as the revision of
the service model in favour of the distribution network.
Appointments and resignations from the Board of Directors of the Parent Company BPER
On 11 January 2013, the Board of Directors of BPER voted unanimously to co-opt Pietro Ferrari
onto the Board to replace Alessandro Fagioli, who resigned on 18 December 2012. Pietro Ferrari
comes from Modena and graduated with a degree in Civil Engineering from the University of
Bologna. In 1982, he joined the family business, Ing. Ferrari s.p.a., as sole director and in 1990 he
became CEO. He holds various corporate positions and has been the President of the Modena
branch of Confindustria since June 2008. The Shareholders' Meeting of 20 April confirmed Mr.
Ferrari for the next three-year period 2013-2015.
On 23 April 2013, as a result of the appointments made by the Shareholders' Meeting of 20 April,
the Board of Directors of Banca Popolare dell'Emilia Romagna, decided to reconfirm Luigi Odorici
as CEO. The same meeting also approved the appointment of Giosuè Boldrini as Deputy
Chairman, who joins the other two Deputy Chairmen, Alberto Marri and Piero Ferrari.
21
On 4 July 2013, Mario Zucchelli, Independent Director has resigned from the post of Director of
BPER due to conditions of incompatibility of office, in compliance with the provisions of art. 36 of
Decree Law 201 of 6 December 2011, converted into Law 214 of 22 December 2011.
group interim
report
The Board is currently made up of eighteen members, nine of whom are part of the Executive
Committee.
J.E.S.S.I.C.A. Sardinia Urban Development Fund
In 2006, a joint initiative of the European Commission of the EIB, in collaboration with the Council
of Europe Development Bank (CEB) gave rise to J.E.S.S.I.C.A. (Joint European Support for
Sustainable Development in City Areas), a tool designed to encourage investment in urban areas
by promoting the revolving use of European Structural Funds for projects of urban development,
made available to the regions of EU Member States, also to foster the creation of public-private
partnerships.
The operating agreement was signed in July 2012 at the Regional Planning Centre of the Sardinia
Region in Cagliari, between the European Investment Bank (EIB) and Banco di Sardegna, which
in partnership with Sinloc (Sistemi iniziative locali) s.p.a. will manage the J.E.S.S.I.C.A. Sardinia
Urban Development Fund. The resources acquired will amount to Euro 33 million and will be
invested on a revolving basis in urban transformation projects, tourism infrastructure and local
public transport, to which may be associated approximately Euro 99 million of co-financing from
Banco di Sardegna directly for selected projects. Additional resources will be made available by
the EIB through Banco di Sardegna.
At 30 September 2013, the J.E.S.S.I.C.A. Fund, the activity of which is still starting, has received
Euro 5 million and disbursed to Banco di Sardegna and Sinloc s.p.a. commissions for a total of
Euro 430 thousand.
22
2. SCOPE OF CONSOLIDATION OF THE BPER GROUP
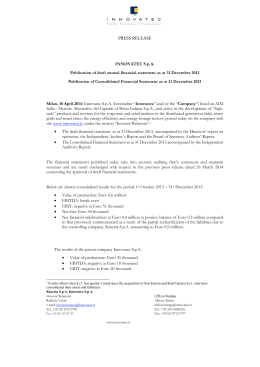
2.1 Group structure as at 30 September 2013
Bearing in mind the various matters discussed in the introduction, the Group structure at 30
September 2013 is as follows.
group interim
report
23
Emilia Romagna Factor
S.p.A.
60.710%
ABF Leasing S.p.A.
100.000%
EMRO Finance Ireland
Limited
100.000%
Banca Popolare dell'Emilia
Romagna (Europe)
International S.A.
100.000%
Estense Covered Bond
S.r.l.
60.000%
BPER Trust Company
S.p.A.
100.000%
Cassa di Risparmio di Bra
S.p.A.
67.000%
Mutina S.r.l.
100.000%
Nettuno Gestione Crediti
S.p.A.
100.000%
Optima S.p.A. - SIM
100.000%
Banca della Campania
S.p.A.
99.273%
b) The following banks also are shareholders of BPER Services S.C.p.A.: Banco di Sardegna S.p.A. (4.762%),
Banca di Sassari S.p.A. (0.400%), Banca popolare di Ravenna S.p.A. (0.400%), Banca della Campania S.p.A.
(0.400%), Banca popolare del Mezzogiorno S.p.A. (0.400%), Optima S.p.A. SIM (0.400%) and Sardaleasing
S.p.A. (0.400%).
being non voting shares.
a) Equivalent to 50.391% of the entire Capital Stock consisting of ordinary, preferred and savings shares, the latter
99.000%
1.000%
Banca Popolare di Ravenna
S.p.A.
86.965%
92.838%
5.000%
Modena Terminal S.r.l.
100.000%
Sardaleasing S.p.A.
96.162%
Banco di Sardegna S.p.A.
51.000%
(a)
91.162%
79.222%
Tholos S.p.A.
100.000%
Numera S.p.A.
100.000%
Banca di Sassari S.p.A.
97.694%
17.972%
In addition to the above members of the banking group, the scope of consolidation also includes the following
subsidiaries of:
- the Parent Bank: Melior Valorizzazioni Immobili S.r.l. (100.000%), Sarda Vibrocementi S.r.l. (100.000%) and
Italiana Valorizzazioni Immobiliari S.r.l. (100.000%)
- Banca della Campania S.p.A: Polo Campania S.r.l. (100.000%),
- Nadia S.p.A.: Galilei Immobiliare S.r.l. (100.000%) and Immobiliare Reiter S.p.A. (100.000%),
which are not members of the banking group, since they do not contribute directly to its activities.
Nadia S.p.A.
100.000%
BPER Services S.C.p.A.
100.000%
(b)
Banca Popolare del
Mezzogiorno S.p.A.
96.772%
SITUATION AS AT 30/09/2013
2.2 Composition of the Group at 30 September 2013
The BPER Group has been registered since 7 August 1992 with code no. 5387.6 in the Register
of Banking Groups referred to in art. 64 of Legislative Decree 385 of 1 September 1993.
group interim
report
The following is a list of the Banks and Companies included in the scope of consolidation at 30
September 2013, split between subsidiary banks and companies (consolidated line-by-line) and
associate banks and companies (consolidated under the equity method).
Details are also provided of the percentage held by the Group, with further specific information
provided, where necessary, by means of footnotes.
A) Companies consolidated on a line-by-line basis:
1) Banca popolare dell'Emilia Romagna s.c., based in Modena (Parent Company)
2) Banca Popolare di Ravenna s.p.a., based in Ravenna (86.965%);
3) Banca Popolare del Mezzogiorno s.p.a., based in Crotone (96.772%);
4) Banca Popolare dell’Emilia Romagna (Europe) International s.a., based in the Grand
Duchy of Luxembourg (100%)1;
5) Banca della Campania s.p.a., based in Naples (99.273%);
6) Banco di Sardegna s.p.a., based in Cagliari, which is held as follows: 51% of ordinary
shares, 60.724% of preference shares and 44.501% of savings shares (without voting
rights, listed on the Italian Stock Exchange), representing 50.391% of total capital;
7) Banca di Sassari s.p.a., based in Sassari (97.694%)2;
8) Cassa di Risparmio di Bra s.p.a., based in Bra (Cuneo) (67%);
9) EMRO Finance Ireland limited, based in Dublin (Ireland), Irish investment company
(100%);
10) Nadia s.p.a., based in Modena, property company (100%);
11) Modena Terminal s.r.l., based in Campogalliano (Modena), the activities of which are the
storage of goods, the storage and ageing of cheeses and the cold storage of meat and
perishable products (100%);
12) BPER Services s.cons.p.a., based in Modena, IT services consortium (100%)3;
13) Mutina s.r.l., based in Modena, used as a vehicle for the securitisation of receivables
(100%);
14) Nettuno Gestione Crediti s.p.a., based in Bologna, provider of debt recovery services
(100%);
1
held by: the Parent Company (99%) and Banca Popolare di Ravenna s.p.a. (1%).
held by: Banco di Sardegna s.p.a. (79.722%) and the Parent Company (17.972%).
held by: the Parent Company (92.838% of which: 1.200% following the merger of Banca popolare di Aprilia s.p.a.,
Banca popolare di Lanciano e Sulmona s.p.a. and CARISPAQ s.p.a. which held 0.400% each), Banco di Sardegna
s.p.a. (4.762%), Banca di Sassari s.p.a. (0.400%), Banca popolare di Ravenna s.p.a. (0.400%), Banca della
Campania s.p.a. (0.400%), Banca popolare del Mezzogiorno s.p.a. (0.400%), Optima s.p.a. SIM (0.400%) and
Sardaleasing s.p.a. (0.400%).
2
3
25
15) ABF Leasing s.p.a., based in Milan, a leasing company (100%);
16) Emilia Romagna Factor s.p.a, based in Bologna, a factoring company (60.710%);
17) Optima s.p.a. SIM, based in Modena, investment broker (100%);
group interim
report
18) Sardaleasing s.p.a., based in Sassari, leasing company (96.162%)4;
19) Numera s.p.a., based in Sassari, IT company and subsidiary of Banco di Sardegna which
holds 100% of share capital;
20) Tholos s.p.a., based in Sassari, property company and subsidiary of Banco di Sardegna
which holds 100% of share capital;
21) Estense Covered Bond s.r.l. based in Conegliano (Treviso), a vehicle for the issue of
Guaranteed Bank Bonds under art. 7 bis of Law 130/99 (60%);
22) Bper Trust Company s.p.a., based in Modena, with the role of trustee for trusts
established by customers, as well as provider of advice on trust matters (100%);
In addition to the above members of the banking group, the scope of consolidation also includes
the following direct and indirect subsidiaries that are not members of the banking group, since
they do not contribute directly to its activities, but are fully consolidated:
Melior Valorizzazioni Immobili s.r.l. (100%);
Immobiliare Reiter s.p.a. wholly owned by Nadia s.p.a.;
Galilei Immobiliare s.r.l. wholly owned by Nadia s.p.a..
The following companies are not part of the Banking Group as they do not contribute to its
activities:
Sarda Vibrocementi s.r.l. (100%): not consolidated as it was only acquired a few months
ago and it had not yet been possible to exercise control; the investment is therefore
consolidated at equity;
Italiana Valorizzazioni Immobiliari s.r.l. (100%), a company set up on 5 September 2013
for the management and enhancement of real estate assets acquired as a result of
enforcing guarantees on problem loans. The company is still dormant at 30 September
2013 and the investment has been allocated to "Financial assets available for sale";
Polo Campania s.r.l. wholly owned by Banca della Campania s.p.a.. The company is still
dormant at 30 September 2013 and the investment has been allocated to "Financial
assets available for sale".
4
26
held by: Banco di Sardegna s.p.a. (91.162%) and the Parent Company (5%).
B) Companies consolidated under the equity method
1) Cassa di Risparmio di Fossano s.p.a., based in Fossano (Cuneo) (23.077%);
2) Cassa di Risparmio di Saluzzo s.p.a., based in Saluzzo (Cuneo) (31.019%);
3) Cassa di Risparmio di Savigliano s.p.a., based in Savigliano (Cuneo) (31.006%);
group interim
report
4) Banca della Nuova Terra s.p.a., based in Milan (30.369%);
5) Alba Leasing s.p.a., based in Milan (36.430%);
6) CO.BA.PO. - Consorzio Banche Popolari s.con., based in Bologna (26.044%)5;
7) Sofipo Fiduciaire SA, based in Lugano, held by Banca Popolare dell’Emilia Romagna
(Europe) International s.a which holds 30% of share capital;
8) CONFORM - Consulenza Formazione e Management s.c.a.r.l., based in Avellino
(49.405%)6;
9) Sintesi 2000 s.r.l., based in Milan (33.333%);
10) CAT progetto Impresa Modena s.c.r.l., based in Modena (20%);
11) Resiban s.p.a., based in Modena (20%);
12) Unione Fiduciaria s.p.a., based in Milan (24%);
13) Atriké s.p.a., based in Modena (45%);
14) Sarda Factoring s.p.a., based in Cagliari (21.484%);7
15) Emil-Ro Service s.r.l., based in Bologna (25%).8
2.3 Changes in the scope of consolidation
Companies consolidated on a line-by-line basis
On 30 January 2013 Nadia s.p.a. signed a purchase agreement to take over the interest
of the two other shareholders and thus to become the sole shareholder of Immobiliare
Reiter s.p.a., already 34% owned at 31 December 2012. Within the same project, Nadia
took over full control of another property company Galilei Immobiliare s.r.l.. The other
66% of Immobiliare Reiter s.p.a. was bought at the symbolic price of Euro 2,000 as the
balance sheet used for valuation purposes, prepared at 30 November 2012 by the Board
of Directors of the company, shows zero net equity due to losses. In any case, the former
shareholders have been exempted from any obligation to finance and recapitalise the
company, as it is the acquiring company that will ensure its recapitalisation. On 25 March
2013, the Shareholders' Meeting of Immobiliare Reiter approved coverage of the
accumulated losses and recapitalisation of the company. At 30 September 2013, the
company has a reconstituted share capital of Euro 900 thousand;
on 7 February 2013, the Parent Company acquired 35.98% of Cassa di Risparmio di Bra
s.p.a., already 31.02% owned at 31 December 2012, giving it a 67% controlling interest,
5
held by: the Parent Company (23.587%) and Banca Popolare di Ravenna s.p.a. (2.457%).
held by: the Parent company (40.476%), Banca della Campania s.p.a. (5.952%) and Banco di Sardegna
s.p.a.(2.976%).
7
held by: Banco di Sardegna s.p.a. (13.401%) and the Parent Company (8.083%).
8
held by: the Parent company (16.667%) and Emilia Romagna Factor s.p.a. (8.333%).
6
27
group interim
report
as explained in the previous chapter on "Significant events and strategic transactions".
The Euro 20 million cash increase in the subsidiary's capital was completed on 11 June
2013. As a result, its share capital went from Euro 20.8 million to Euro 27.3 million. The
Parent Company subscribed 8,375,000 shares for a total amount of Euro 13.4 million;
the sale of the majority holding (80.90%) in Immo.Bi. s.r.l. was completed on 25 February
2013;
the liquidation of Arca Merchant International s.a. was completed on 28 February 2013. It
has been eliminated from the Banking Group;
the sale of the 100% investment in Arca Impresa Gestioni SGR s.p.a. was completed on
21 March 2013;
The merger of CARISPAQ, BPLS and BPA with the Parent Company was completed on
27 May 2013. The merger took effect for tax and accounting purposes from 1 January
2013;
Italiana Valorizzazioni Immobiliari s.r.l., which is wholly owned by the Parent Company,
was set up on 5 September 2013 for the management and development of real estate
assets acquired as a result of enforcing guarantees on problem loans.
The following changes also took place in the Parent Company's interest in certain subsidiary
banks and companies during the period:
Banco di Sardegna s.p.a.: the Parent Company's previous holding of 49.841% was raised
to 50.391% after buying savings shares on the market;
Banca Popolare di Ravenna s.p.a.: formerly held 86.788% by the Parent Company, it
rose to 86.965% following various purchases from shareholders;
Banca Popolare del Mezzogiorno s.p.a.: formerly held 96.659% by the Parent Company,
it rose to 96.772% following various purchases from shareholders;
Banca della Campania s.p.a.: formerly held 99.240% by the Parent Company, it rose to
99.273% following various purchases from shareholders;
Banca di Sassari s.p.a.: formerly held 16.225% by the Parent Company, it rose to
17.972% following various purchases from shareholders.
Companies consolidated under the equity method
Cassa di Risparmio di Bra s.p.a. and Immobiliare Reiter s.p.a. are no longer classified as
"significant investments" as BPER has taken over control of them, directly or indirectly, as
mentioned in the previous point;
Emilia Romagna Factor s.p.a. sold its entire 50% investment in Ekaton s.r.l. on 28
February 2013.;
On 14 June 2013, the Parent Company acquired control of Sarda Vibrocementi s.r.l., as
part of a complex debt collection operation, by subscribing a capital increase of Euro
3,000,000, offset by a receivables of the same amount against an equity that had been
written off to cover past losses. As already mentioned, it was not fully consolidated;
the Parent Company sold its entire 20% investment in Felsinea Factor s.p.a. on 19
September 2013;
the Agreement for the sale by Serfina Banca s.p.a. to the Parent Company of assets and
activities making up the banking business, as already mentioned in the section entitled
"Significant events and strategic transactions", was executed on 27 September 2013. This
transaction was followed by the simultaneous liquidation of the company with immediate
annulment of the Board of Directors, of the pre-existing shareholder agreements and,
consequently, of BPER's significant influence: Serfina (held 17.872%) is therefore no
28
longer consolidated using the equity method, but classified under "Financial assets
available for sale".
group interim
report
29
3. RESULTS OF OPERATIONS
group interim
report
3.1 Introduction
Despite the worst economic crisis since World War II, the Group has managed to retain a good
overall level of profitability, while at the same time reducing operating costs; and despite the
impact of including CR Bra in the Group, it is also showing an improvement in capital ratios. Also
worth noting is the level of liquidity, which is already in line with the Basel 3 minimum
requirements, as well as the Group's leverage, which is one of the lowest in the system.
The Group's consolidated results at 30 September 2013 show a profit before tax of Euro 99.3
million, which includes the impact of hefty prudential adjustments on loans due to the application
of more conservative classification and provisioning criteria since 31 December 2012, in line with
the indications of the Supervisory Authority.
The overall consolidated net profit for the period, which includes the net profit of assets held for
sale, amounts to Euro 23.2 million (Euro 138 million at 30 September 2012). This result is affected
by a high effective tax rate of 77.88% because of the non-deductibility of loan loss provisions and
most of the payroll costs for IRAP purposes.
The net result pertaining to the Parent Company, net of minority interests, is a profit of Euro 14.2
million (Euro 141.7 million at 30 September 2012).
Operating profitability, represented by the difference between revenues (net interest and other
banking income) and operating costs, has increased by 3.74%, from Euro 700.3 million (at 30
September 2012) to Euro 726.5 million.
Total revenues (net interest and other banking income) are slightly lower than at 30
September 2012 (-0.45%):
Net interest income is down by 1.69% on September 2012 (-3.36% net of CR Bra), but
slightly up on the second quarter (+0.28%), mainly due to lower funding costs.
Net commission income is down by 2.06% compared with the first nine months of 2012,
essentially due to changes in the regulations governing the commission structure
introduced by the "Save Italy" Decree in force since the fourth quarter of 2012, which led
to a different accounting allocation; on the other hand, there has been a sharp increase
(+7.78%) if the calculation is made on a consistent basis.
The net profit from financial activities shows strong growth (Euro 121.9 million on Euro
101.6 million at 30 September 2012), thanks to dividends of an extraordinary nature and
substantial disposals from the securities portfolio.
Operating costs have fallen by 3.66%, largely due to the increase in other operating income,
mainly because of changes to the fee structure imposed by the "Save Italy" decree introduced
in the fourth quarter of 2012, as well as a different accounting allocation. Operating and payroll
costs are significantly lower.
Net adjustments to loans (+40.81% compared with the first nine months of 2012) are down
sharply on the previous quarter (-45.48%), returning to the levels of the first quarter, whereas the
coverage of doubtful loans remains broadly stable.
The cost of credit comes to 125 bps (167 bps on an annual basis) compared with 87 bps in the
same period last year (199 bps for the whole of 2012); without the extraordinary provisions
30
accrued in the second quarter (Euro 158 million), the cost of credit for the period would have
come to 92 bps.
In the balance sheet, volumes are down compared with 31 December 2012, both for loans to
customers (-1.75%) and for direct deposits (-3.68%), whereas the loans/deposits ratio is up
from 101.79% to 103.83%.
group interim
report
The liquidity position, which is already in line with the Basel 3 minimum requirements, remains
good, while leverage is still among the lowest in the system (14.44x compared with 14.24x at the
end of 2012).
The Group's financial solidity is confirmed by a Core Tier 1 ratio of 8.43%, still calculated
according to the Basel 2 standardised approach and taking into account the share of profits
attributable to equity earned during the third quarter of the year and the net effects accrued during
the same period from application of the fair value option, which compares with a Core Tier 1 ratio
at 31 December 2012 of 8.27% and at 30 June 2013 of 8.22%. This improvement has been
achieved despite the negative impact of including Cassa di Risparmio di Bra in the Group (13
bps).
31
3.2 Performance ratios
30.09.2013
group interim
report
2012 (*)
Financial ratios
Structural ratios (%)
net loans to customers/total assets
net loans and advances to customers/direct deposits from customers
fixed assets/total assets
total risk-weighted assets (RWA)/total assets
goodwill/total assets
direct deposits/total assets
deposits under management/indirect deposits
leverage (**)
net interbank lending/borrowing (in thousands of Euro)
number of employees
number of national bank branches
76.84%
77.95%
103.83%
2.02%
101.79%
2.03%
72.13%
0.62%
72.62%
0.61%
87.08%
43.23%
88.37%
41.01%
14.44
(6,333,356)
14.24
(5,018,680)
11,723
1,326
11,834
1,297
0.47%
-0.29%
0.04%
54.75%
1.25%
0.046
0.22%
56.58%
0.87%
0.421
0.425
5.06%
6.86%
54.60%
0.59%
3.92%
5.23%
54.87%
0.66%
3,734,046
3,756,411
5,337,739
3,701,624
3,714,841
5,427,499
44,313,688
8.43%
44,758,313
8.27%
8.48%
12.05%
8.30%
12.13%
3,878.38
4,026.91
956.84
1,256.70
136.96
3,988.67
4,060.23
871.47
1,253.63
135.93
Profitability ratios (%)
ROE (Return On Equity)
ROA (net profit/total assets)
Cost/income ratio
Net adjustments to loans and advances/net loans to customers
Basic EPS
Diluted EPS
0.041
Risk ratios (%)
net non-performing loans/net loans to customers
net watchlist loans/net loans to customers
adjustments to non-performing loans/gross non-performing loans
adjustments to performing loans/gross performing loans
Capital for supervisory purposes and capital ratios (***)
Core Tier 1 capital
Tier 1 capital
Capital for supervisory purposes (including Tier 3)
Risk-weighted assets (RWA)
Core Tier 1 ratio
Tier 1 capital ratio
Total capital ratio
Non-financial ratios
Productivity ratios (in thousands)
direct deposits per employee
loans and advances to customers per employee
assets managed per employee
assets administered per employee
net interest and other banking income per employee
(*) The comparative figures for the income statement are as at 30 September 2012, except for the ROE which is
calculated on a yearly basis.
(**) Leverage = total tangible assets (total assets net of intangible assets)/tangible equity (total shareholders' equity
net of intangible assets).
(***) The ratios have been calculated based on equity that includes its share of net profit for the first nine months of
the year and taking account of the net effects at 30 September 2013 of applying the fair value option, with an
impact of 11 bps for the overall portion attributable to the results for the third quarter of 2013.
32
3.3 Balance sheet aggregates
The more important consolidated balance sheet aggregates and captions at 30 September 2013,
are shown below with comparative figures, at 31 December 2012, in thousands of Euro, indicating
the changes between periods in absolute and percentage terms.
group interim
report
ASSETS
(in thousands of Euro)
Assets
10. Cash and balances with central banks
20. Financial assets held for trading
30. Financial assets designated at fair value through
profit and loss
40. Financial assets available for sale
50. Financial assets held to maturity
60. Due from banks
70. Loans to customers
80. Hedging derivatives
90. Remeasurement of financial assets backed by
general hedges (+/-)
100. Equity investments
120. Property, plant and equipment
130. Intangible assets
of which: goodwill
140. Tax assets
a) current
b) deferred
b1) of which L. 214/2011
150. Non-current assets and disposal groups held for
sale
160. Other assets
Total assets
30.09.2013
31.12.2012
Change
%change
421,763
488,873
(67,110)
-13.73
1,159,484
1,596,048
(436,564)
-27.35
151,919
151,450
469
0.31
5,915,811
4,679,402
1,236,409
26.42
1,203,539
818,050
385,489
47.12
1,702,179
2,250,781
(548,602)
-24.37
47,207,476
48,048,735
(841,259)
-1.75
2,381
-
2,381
n.s.
-
1,060
(1,060)
-100.00
257,371
269,094
(11,723)
-4.36
982,487
984,217
(1,730)
-0.18
475,991
467,488
8,503
1.82
383,045
375,935
7,110
1.89
987,426
957,066
30,360
3.17
64,270
113,483
(49,213)
-43.37
923,156
843,583
79,573
9.43
785,990
715,316
70,674
9.88
-84.63
2,817
18,329
(15,512)
967,758
907,165
60,593
6.68
61,438,402
61,637,758
(199,356)
-0.32
The following tables provide detailed information on the Parent Company at 31 December 2012,
taking into account the mergers of the three Banks of Central Italy, which was completed on 27
May 2013, with effect for accounting and tax purposes from 1 January 2013.
Reconciliation schedules showing how these pro-forma figures of the Parent Company were
calculated are attached to this consolidated quarterly report. These figures have not been audited
by PricewaterhouseCoopers s.p.a..
33
LOANS TO CUSTOMERS
group interim
report
(in thousands of Euro)
Captions
30.09.2013
31.12.2012
Change %change
Current accounts
Mortgage loans
7,961,961
25,825,678
8,092,862
25,266,237
(130,901)
559,441
-1.62
2.21
Repurchase agreements
Debt securities
Other transactions
Net loans to customers
10,181
261,410
13,148,246
47,207,476
104,564
293,806
14,291,266
48,048,735
(94,383)
(32,396)
(1,143,020)
(841,259)
-90.26
-11.03
-8.00
-1.75
Loans to customers, net of adjustments, amount to Euro 47,207.5 million (Euro 48,048.7 million as at 31 December
2012) and are down since the start of the year (-1.75%) despite the inclusion in the scope of consolidation of Cassa
di Risparmio di Bra, which contributed Euro 1,186.6 million at 30 September 2013, around 2.51% of the total.
Net of this contribution, the decrease would have been 4.22%: the captions most affected by this reduction are
current accounts, down by Euro 472.3 million (-5.84%) and other financing transactions, mainly "bullet" loans
(which decrease by Euro 678.9 million, or 18.20%) and advances on invoices or notes subject to collection (which
decrease by Euro 484.4 million, or 17.76%), as well as repurchase agreements which have fallen by more than
90%.
The average interest rate for the period, based on bank lending rates to customers, was 3.61%, a
decrease of around 34 bps compared with the average rate for the same period last year.
The spread between lending and deposit rates of banking relationships with customers came to
2.14%, down compared with the first nine months of 2012 (2.25%).
The overall gap between the average annual rate of return on interest-bearing assets and the
average annual cost of interest-bearing liabilities amounts to 2.06%, down on the same period last
year (when it was 2.13%).
34
(in thousands of Euro)
Captions
30.09.2013
31.12.2012
Gross doubtful loans
Non-performing loans
10,177,188
5,263,797
8,226,027
4,175,886
1,951,161
1,087,911
23.72
26.05
3,894,416
364,090
3,138,499
464,949
755,917
(100,859)
24.09
-21.69
Past due loans
Gross performing loans
654,885
40,901,050
446,693
43,132,706
208,192
(2,231,656)
46.61
-5.17
Total gross exposure
Watchlist loans
Restructured loans
Change %change
51,078,238
51,358,733
(280,495)
-0.55
Adjustments to doubtful loans
3,628,215
3,025,414
602,801
19.92
Non-performing loans
Watchlist loans
2,874,090
657,874
2,291,199
627,405
582,891
30,469
25.44
4.86
46,377
49,874
242,547
81,163
25,647
284,584
(34,786)
24,227
(42,037)
-42.86
94.46
-14.77
Total loan loss provisions
3,870,762
3,309,998
560,764
16.94
Net doubtful loans
6,548,973
5,200,613
1,348,360
25.93
Non-performing loans
Watchlist loans
2,389,707
3,236,542
1,884,687
2,511,094
505,020
725,448
26.80
28.89
Restructured loans
Past due loans
Net performing loans
317,713
605,011
40,658,503
383,786
421,046
42,848,122
(66,073)
183,965
(2,189,619)
-17.22
43.69
-5.11
Total net exposure
47,207,476
48,048,735
(841,259)
-1.75
Restructured loans
Past due loans
Adjustments to performing loans
group interim
report
The adjustments relate to performing loans for Euro 242.5 million (Euro 284.6 million at 31 December 2012; 14.77%), giving a coverage ratio of 0.59% (0.66% at 31 December 2012). The decline of 7 bps is due to three main
factors:
a) the first is a significant reduction in performing loans as a substantial quantity of such loans with the worst rating,
i.e. penalising, were shifted to doubtful loan categories, essentially watchlist loans;
b) as in June 2013, the second is the general loan adjustment, for which we applied advanced Basel 2 models for
the calculation of PD and LGD (these models are now definitely consolidated and in force, only needing ratification
by the Supervisory Authority for their application also in determining capital ratios). Use of these models made it
possible to take advantage of additional information to extend the provisions also to endorsement credits issued by
performing customers, which up until last year were automatically covered by any excess provisions on cash loans;
c) the third factor is the removal in June 2013 of the penalties applied to exposures to customers resident in the
areas affected by the earthquake that hit Emilia, Lombardy and Veneto in May 2012. These were for risks that are
now reflected in the updated PD and LGD calculations, as explained above. The residual adjustments applied
following the earthquake that hit L'Aquila in 2009 have also been removed for the same reason.
35
Adjustments to doubtful loans amount to Euro 3,628.2 million (Euro 3,025.4 million at 31 December 2012;
+19.92%) with a coverage ratio of 35.65% (36.78% at 31 December 2012).
group interim
report
The total coverage ratio is 7.58% versus 6.44% at 31 December 2012.
If we take account of the direct writedowns made to non-performing loans involved in bankruptcy procedures for
Euro 1,440.7 million (Euro 1,466.6 million at 31 December 2012), and of the default interest described below as
regards CR Bra, the coverage ratio rises to 10.11% (9.04% at 31 December 2012).
The total actual value of the claim for non-performing loans comes to Euro 6,704.5 million (Euro 5,642.5 million
at 31 December 2012) and the effective coverage ratio comes to 64.36% (66.60% at 31 December 2012).
Making the same considerations, the effective coverage of doubtful loans amounts to 43.63% (46.34% at 31
December 2012).
(in thousands of Euro)
30.09.2013
Loans to customers
1. Banca popolare dell'Emilia
Romagna s.c.
2. Banca popolare di Ravenna s.p.a.
3. Banca popolare del Mezzogiorno
s.p.a.
Gross
31.12.2012
Net
Gross
Net
31,427,978 29,216,594 32,292,220 30,517,352
-2.68
-4.26
7.04
-2.43
-2.99
4.53
0.20
-0.13
5.88
13.52
12.92
0.74
-5.10
-6.16
8.71
1,407,738
-7.14
-8.59
7.50
8,929,544
8,097,496
-4.74
-5.47
10.01
-
2,116,829
2,021,041
2,169,574
2,083,261
2,731,344
2,570,795
2,725,967
2,574,256
206,423
204,900
181,839
181,451
5. Banca della Campania s.p.a.
2,816,657
2,571,439
2,968,007
2,740,144
6. Banca di Sassari s.p.a.
1,391,129
1,286,782
1,498,087
7. Banco di Sardegna s.p.a.
8,506,318
7,654,584
1,226,930
1,186,583
4. Bper (Europe) International s.a.
8. Cassa di Risparmio di Bra s.p.a.
%
%
%
gross
net coverage
change change
ratio
-
n.s.
n.s.
3.29
Total banks
Other companies and
consolidation adjustments
50,423,608 46,712,718 50,765,238 47,601,698
-0.67
-1.87
7.36
447,037
10.30
10.67
24.42
Total
51,078,238 47,207,476 51,358,733 48,048,735
-0.55
-1.75
7.58
654,630
494,758
593,495
The comparative figures of Banca popolare dell’Emilia Romagna s.c. include those of the Group banks absorbed
on 27 May 2013: Banca Popolare di Aprilia s.p.a. (Euro 498,359 thousand gross and Euro 481,014 thousand net),
Banca Popolare di Lanciano e Sulmona s.p.a. (Euro 2,756,317 thousand gross and Euro 2,549,848 thousand net)
and CARISPAQ - Cassa di Risparmio della provincia dell’Aquila s.p.a. (Euro 2,742,474 thousand gross and Euro
2,626,064 thousand net).
36
Doubtful loans (non-performing loans, watchlist loans, restructured loans and past due loans for
more than 90 days) indicated here, relate solely to the portfolio of "Loans to customers”. Their net
amount of Euro 6,549 million (+25.93%) is equal to 13.87% of total net loans to customers
(10.82% as at 31 December 2012), whereas, on a gross basis, it is equal to 19.92% (16.02% as
at 31 December 2012).
In detail, net non-performing loans amounted to Euro 2,389.7 million (+26.80%), net watchlist
loans amounted to Euro 3,236.5 million (+28.89%), net restructured loans amounted to Euro
317.7 million (-17.22%) and net past due loans totalled Euro 605 million (+43.69%).
The coverage ratio is satisfactory and suitable for the portfolio's level of risk: the coverage ratio of
total doubtful loans comes to 35.65% versus 36.78% at the end of 2012.
group interim
report
The decline of one percentage point that emerges is largely due to the sharp increase in watchlist
loans compared with non-performing loans, taking into account their lower level of coverage, as is
natural.
If we take into account the direct write-downs of non-performing loans involved in bankruptcy
proceedings for Euro 1,440.7 million (Euro 1,466.6 million at 31 December 2012), the effective
coverage ratio comes to 43.63% (46.34% as at 31 December 2012).
(in thousands of Euro)
30.09.2013
Doubtful loans
1. Banca popolare dell'Emilia
Romagna s.c.
2. Banca popolare di Ravenna s.p.a.
3. Banca popolare del Mezzogiorno
s.p.a.
4. Bper (Europe) International s.a.
5. Banca della Campania s.p.a.
6. Banca di Sassari s.p.a.
31.12.2012
%
%
%
gross
net coverage
change change
ratio
Gross
Net
Gross
Net
5,481,181
3,400,131
4,302,883
2,685,711
27.38
26.60
37.97
299,365
214,095
239,326
163,334
25.09
31.08
28.48
405,180
257,855
386,221
249,971
4.91
3.15
36.36
35,708
34,185
2,293
1,905
--
--
4.27
706,939
477,255
555,002
359,007
27.38
32.94
32.49
249,181
152,698
210,777
127,255
18.22
19.99
38.72
2,031,903
1,219,247
1,821,741
1,027,965
11.54
18.61
39.99
197,654
161,086
-
-
n.s.
n.s.
18.50
Total banks
Other companies and
consolidation adjustments
9,407,111
5,916,552
7,518,243
4,615,148
25.12
28.20
37.11
770,077
632,421
707,784
585,465
8.80
8.02
17.88
Total
Direct write-downs of nonperforming loans
10,177,188
6,548,973
8,226,027
5,200,613
23.72
25.93
35.65
1,440,681
-
1,466,621
-
-1.77
n.s.
100.00
Adjusted total
11,617,869
6,548,973
9,692,648
5,200,613
19.86
25.93
43.63
7. Banco di Sardegna s.p.a.
8. Cassa di Risparmio di Bra s.p.a.
The comparative figures of Banca popolare dell’Emilia Romagna s.c. include those of the Group banks absorbed
on 27 May 2013: Banca Popolare di Aprilia s.p.a. (Euro 32,585 thousand gross and Euro 18,779 thousand net),
Banca Popolare di Lanciano e Sulmona s.p.a. (Euro 521,906 thousand gross and Euro 340,598 thousand net) and
CARISPAQ - Cassa di Risparmio della provincia dell’Aquila s.p.a. (Euro 280,264 thousand gross and Euro 181,860
thousand net).
Note that CR Bra, which entered in the scope of consolidation in the first half of 2013, unlike the rest of the Group,
does not accrue interest on arrears for individual debt positions, proceeding in fact to their total direct write-down.
Considering the value of interest on arrears at 30 September 2013 relating to outstanding positions of Euro 6,048
thousand, the recalculated level of coverage comes to 19.98% compared with the figure of 18.50% shown in the
table.
37
group interim
report
The non-performing loans shown here relate solely to the portfolio of "Loans to customers".
Their net amount of Euro 2,389.7 million (+26.80%) comes to 5.06% of total net loans to
customers (3.92% at 31 December 2012), whereas, on a gross basis, the ratio of non-performing
loans to total loans to customers comes to 10.31% (8.13% at 31 December 2012). The coverage
ratio of non-performing loans is at 54.60% compared with 54.87% in December 2012. If we make
the comparison on a consistent basis (i.e. without the figures for Cassa di Risparmio di Bra, which
was consolidated for the first time in 2013, and taking into account the status changes in the first
quarter, mainly coming from watchlist loans, as a result of the inspection by the Bank of Italy and
that already discounted adequate provisions in line with the assessments of the Inspection Team
of approximately Euro 310 million on a gross basis and Euro 150 million of net loans), the
coverage ratios are in line with the end of 2012.
If we take account of the direct writedowns made to non-performing loans involved in bankruptcy
procedures for Euro 1,440.7 million (Euro 1,466.6 million at 31 December 2012), the total actual
value of the claim for non-performing loans comes to Euro 6,704.5 million (Euro 5,642.5 million at
31 December 2012) and the effective coverage ratio is 64.36% (66.60% at 31 December 2012).
(in thousands of Euro)
30.09.2013
Non-performing loans
1. Banca popolare dell'Emilia
Romagna s.c.
2. Banca popolare di Ravenna s.p.a.
3. Banca popolare del Mezzogiorno
s.p.a.
4. Bper (Europe) International s.a.
5. Banca della Campania s.p.a.
6. Banca di Sassari s.p.a.
31.12.2012
%
%
%
gross
net coverage
change change
ratio
Gross
Net
Gross
Net
2,883,239
1,243,892
2,179,888
975,052
32.27
27.57
56.86
119,922
65,332
95,216
46,779
25.95
39.66
45.52
211,143
96,081
192,429
85,442
9.73
12.45
54.49
-
-
-
-
-
-
-
362,098
182,793
272,640
130,059
32.81
40.55
49.52
145,766
62,863
123,868
52,378
17.68
20.02
56.87
1,122,046
452,492
1,007,975
382,540
11.32
18.29
59.67
47,602
23,361
-
-
n.s.
n.s.
50.92
Total banks
Other companies and consolidation
adjustments
4,891,816
2,126,814
3,872,016
1,672,250
26.34
27.18
56.52
371,981
262,893
303,870
212,437
22.41
23.75
29.33
Total
Direct write-downs of
non-performing loans
5,263,797
2,389,707
4,175,886
1,884,687
26.05
26.80
54.60
1,440,681
-
1,466,621
-
-1.77
n.s.
100.00
Adjusted total
6,704,478
2,389,707
5,642,507
1,884,687
18.82
26.80
64.36
7. Banco di Sardegna s.p.a.
8. Cassa di Risparmio di Bra s.p.a.
The comparative figures of Banca popolare dell’Emilia Romagna s.c. include those of the Group banks absorbed
on 27 May 2013: Banca Popolare di Aprilia s.p.a. (Euro 18,829 thousand gross and Euro 7,502 thousand net),
Banca Popolare di Lanciano e Sulmona s.p.a. (Euro 255,988 thousand gross and Euro 109,372 thousand net) and
CARISPAQ - Cassa di Risparmio della provincia dell’Aquila s.p.a. (Euro 120,457 thousand gross and Euro 45,418
thousand net).
38
The watchlist loans shown here relate solely to the portfolio of "Loans to customers". Their net
amount of Euro 3,236.5 million (+28.89%) comes to 6.86% of total net loans to customers (5.23%
at 31 December 2012), whereas, on a gross basis, the ratio of watchlist loans to total loans to
customers comes to 7.62% (6.11% at 31 December 2012). The coverage ratio of watchlist loans
comes to 16.89% compared with 19.99% at the end of 2012; the decrease reflects the change in
administrative status of non-performing loans: net of this, coverage has gone down by 0.40%.
group interim
report
(in thousands of Euro)
30.09.2013
Watchlist loans
1. Banca popolare dell'Emilia Romagna
s.c.
2. Banca popolare di Ravenna s.p.a.
3. Banca popolare del Mezzogiorno
s.p.a.
4. Bper (Europe) International s.a.
5. Banca della Campania s.p.a.
6. Banca di Sassari s.p.a.
Gross
31.12.2012
Net
Gross
Net
2,029,752 1,654,348 1,566,423 1,232,927
%
%
% net
gross
coverage
change
change
ratio
29.58
34.18
18.50
151,476
123,600
122,433
97,216
23.72
27.14
18.40
170,513
140,095
169,749
142,223
0.45
-1.50
17.84
35,708
34,185
2,293
1,905
--
--
4.27
308,409
261,193
239,713
188,623
28.66
38.47
15.31
81,277
69,495
68,624
58,038
18.44
19.74
14.50
724,993
597,130
667,057
514,822
8.69
15.99
17.64
91,575
81,978
-
-
n.s.
n.s.
10.48
Total banks
Other companies and consolidation
adjustments
3,593,703 2,962,024 2,836,292 2,235,754
26.70
32.48
17.58
275,340
-0.49
-0.30
8.71
Total
3,894,416 3,236,542 3,138,499 2,511,094
24.09
28.89
16.89
7. Banco di Sardegna s.p.a.
8. Cassa di Risparmio di Bra s.p.a.
300,713
274,518
302,207
The comparative figures of Banca popolare dell’Emilia Romagna s.c. include those of the Group banks absorbed
on 27 May 2013: Banca Popolare di Aprilia s.p.a. (Euro 10,691 thousand gross and Euro 8,416 thousand net),
Banca Popolare di Lanciano e Sulmona s.p.a. (Euro 202,627 thousand gross and Euro 171,357 thousand net) and
CARISPAQ - Cassa di Risparmio della provincia dell’Aquila s.p.a. (Euro 131,704 thousand gross and Euro 111,006
thousand net.
39
(in thousands of Euro)
Distribution of loans to resident non-financial
businesses
group interim
report
A. Agriculture, forestry and fishing
B. Mining and quarrying
C. Manufacturing
D. Provision of electricity, gas, steam and air-conditioning
E. Provision of water, sewerage, waste management and
rehabilitation
F. Construction
G. Wholesaling and retailing, car and motorcycle repairs
H. Transport and storage
I. Hotel and restaurants
J. Information and communication
K. Finance and insurance
L. Real estate
M. Professional, scientific and technical activities
N. Rentals, travel agencies, business support services
O. Public administration and defence, compulsory social
security
P. Education
Q. Health and welfare
R. Arts, sport and entertainment
S. Other services
Total loans to resident non-financial businesses
Loans to non-resident, non-financial businesses
30.09.2013
31.12.2012
1,211,855
72,407
7,661,206
1,138,874
83,365
7,885,671
658,606
625,444
410,886
5,910,486
386,109
6,105,551
5,456,552
1,086,028
5,557,318
1,165,849
1,774,849
440,468
548,442
3,598,322
1,789,694
435,059
543,167
3,734,498
1,022,403
623,496
1,053,719
711,168
8,631
31,206
7,378
26,439
461,573
454,210
202,933
233,535
210,961
250,092
31,413,884
32,164,566
% %change
2.57
0.15
6.41
-13.14
16.23
1.39
-2.85
5.30
0.87
6.42
12.52
11.56
2.30
3.76
0.93
1.16
7.62
2.17
1.32
-3.19
-1.81
-6.85
-0.83
1.24
0.97
-3.65
-2.97
-12.33
0.02
16.98
0.07
0.98
18.03
1.62
0.43
0.49
66.54
-3.81
-6.62
-2.33
182,081
415,226
0.39
-56.15
Total loans to non-financial businesses
31,595,965
32,579,792
66.93
-3.02
Individuals and other not included above
Financial businesses
Securities
Governments and other public entities
Insurance companies
10,785,349
2,588,872
261,410
1,970,262
5,618
10,497,917
2,731,434
293,806
1,939,531
6,255
22.85
5.49
0.55
4.17
0.01
2.74
-5.22
-11.03
1.58
-10.18
Total loans to businesses
47,207,476
48,048,735
100.00
-1.75
The sectors that show a reduction in both absolute and percentage terms are those related to the property sector
(construction and real estate), manufacturing and commerce.
If we exclude the adjustments made at 30 September 2013 following CR Bra's inclusion in the scope of
consolidation, i.e. making the comparison on a consistent basis, we can see significant reductions, essentially in
the following sectors: construction, down by Euro 396.6 million (-6.50%); real estate, down by Euro 262 million (7.02%); manufacturing, down by Euro 457.7 million (-5.80%); commerce, down by Euro 250.1 million (-4.5%). In
addition to the decline attributable to these sectors, there is also the decrease relating to financial companies of
Euro 142.6 million (-5.22%).
40
group interim
report
41
FINANCIAL ASSETS AND EQUITY INVESTMENTS
group interim
report
(in thousands of Euro)
Captions
20. Financial assets held for trading
- of which: derivatives
30. Financial assets designated at fair
value through profit and loss
40. Financial assets available for sale
50. Financial assets held to maturity
Total financial assets
30.09.2013
31.12.2012
Change %change
1,159,484
1,596,048
(436,564)
-27.35
220,866
310,949
(90,083)
-28.97
151,919
5,915,811
1,203,539
151,450
4,679,402
818,050
469
1,236,409
385,489
0.31
26.42
47.12
8,430,753
7,244,950
1,185,803
16.37
Financial assets amount to Euro 8,430.8 million, including Euro 7,581.3 million of debt securities (89.92% of the
total): of these, Euro 6,158.2 million relate to sovereign States and Central Banks, Euro 1,214.5 million to Banks.
Exposure to debt securities of issuers resident in the so-called PIGS countries (Portugal, Ireland, Greece and
Spain) amounted to Euro 140 million (of which Euro 36.2 million relating to government securities): Portugal Euro
14.3 million, Ireland Euro 30.6 million, Spain Euro 95.1 million, while there are no Greek bonds in portfolio.
Compared with 31 December 2012, this aggregate has decreased by Euro 28.9 million.
For their characteristics, most of the securities in portfolio, being highly liquid, are eligible for use as collateral for
refinancing transactions on the institutional market or with the European Central Bank.
Equities come to Euro 474.5 million (5.62% of the total), inclusive of Euro 448.3 million of stable equity
investments; equities held for trading are totally marginal.
"Financial assets held for trading" include financial derivatives of Euro 220.9 million (-28.97%) made up of Euro
104.2 million (-34.57%) of derivatives linked to debt securities classified in "Financial assets designated at fair
value through profit and loss" and in "Financial liabilities designated at fair value through profit and loss" (fair value
option) and forward transactions in foreign currencies (traded with customers and/or used in managing the foreign
exchange position), interest rate and foreign exchange derivatives intermediated with customers, derivatives
related to securitisations and other operational hedging derivatives. At 30 September 2013 the Group has not
entered into any of the "long-term structured repo transactions" mentioned in the document issued jointly by the
Bank of Italy, CONSOB and IVASS on 8 March 2013 (as explained in the Explanatory Notes to this quarterly
report).
The significant increase in "Financial assets available for sale" (+26.42%) is attributable mainly to the purchase of
government bonds of Italy and other core countries, essentially by the Parent Company. The increase also reflects
the first-time inclusion of CR Bra's AFS portfolio in the scope of consolidation (Euro 204.1 million). Against the
"Financial assets available for sale" of Euro 5,915.8 million, there are positive net valuation reserves for a total of
Euro 111.6 million, net of the related tax effect, as a result of the sum of positive reserves relating to debt
securities, equities and UCITS of Euro 148 million and negative reserves of Euro 36.4 million; the net reserve only
for government bonds was a positive Euro 15.6 million.
“Financial assets held to maturity” have also increased significantly. The plafond of HTM securities has been
increased to support net interest income and reduce its exposure to fluctuations in interest rates and market
values, still in a predictable scenario of exceptionally low risk-free rates for long time.
42
(in thousands of Euro)
Financial assets
1. Banca popolare dell'Emilia Romagna s.c.
2. Banca popolare di Ravenna s.p.a.
3. Banca popolare del Mezzogiorno s.p.a.
4. Bper (Europe) International s.a.
5. Banca della Campania s.p.a.
6. Banca di Sassari s.p.a.
7. Banco di Sardegna s.p.a.
8. Cassa di Risparmio di Bra s.p.a.
Total banks
Other companies and consolidation adjustments
Total
30.09.2013
31.12.2012
Change %change
6,785,675
5,853,934
931,741
15.92
88,081
190,806
113,160
93,534
(25,079)
97,272
-22.16
104.00
64,018
108,984
9,748
822,603
204,133
107,907
252,266
24,190
746,519
-
(43,889)
(143,282)
(14,442)
76,084
204,133
-40.67
-56.80
-59.70
10.19
n.s.
8,274,048
7,191,510
1,082,538
15.05
156,705
53,440
103,265
193.24
8,430,753
7,244,950
1,185,803
16.37
group interim
report
The comparative figures of Banca popolare dell’Emilia Romagna s.c. include those of the Group banks absorbed
on 27 May 2013: Banca Popolare di Aprilia s.p.a. (Euro 24,924 thousand), Banca Popolare di Lanciano e Sulmona
s.p.a. (Euro 93,753 thousand) and CARISPAQ - Cassa di Risparmio della provincia dell’Aquila s.p.a. (Euro
125,940 thousand), net of intercompany balances (Euro -39,619 thousand). The same adjustment was made to
"Other companies and consolidation adjustments”.
(in thousands of Euro)
Captions
Equity investments
30.09.2013
31.12.2012
Change
%
change
%
257,371
269,094
(11,723)
-4.36
This caption relates to significant equity investments (i.e. non-Group companies subject to significant influence,
represented by holdings of 20% or more of their share capital); these interests are measured using the equity
method. Changes during the period are mainly due: (in negative) to the share of the results of the main investments
(Euro 3.4 million), as well as to the transfer of the Cassa di Risparmio di Bra s.p.a. to controlling investments (Euro
27.6 million in the 2012 financial statements, including Euro 9.4 million for goodwill), to the sale of Ekaton s.r.l.
(Euro 1.4 million), to the impairment of the investment in BNT (Euro 0.8 million) to the sale of Felsinea Factor s.p.a.
(Euro 0.8 million), as well as to the transfer of Serfina Banca s.p.a. under "Financial assets available for sale" (Euro
2.6 million) as a result of acquiring the business; (in positive) to the increase in capital subscribed by BPER in Alba
Leasing s.p.a. (Euro 25.5 million).
Goodwill comes to a total of Euro 24.6 million (Euro 34.1 million at 31 December 2012).
43
FIXED ASSETS
group interim
report
(in thousands of Euro)
Captions
Intangible assets
of which: goodwill
30.09.2013
31.12.2012
475,991
383,045
467,488
375,935
Change %change
8,503
7,110
1.82
1.89
Intangible assets include goodwill for a total of Euro 383 million. The change from 31 December 2012 is due to the
goodwill recognised on first-time consolidation of Cassa di Risparmio di Bra s.p.a. (Euro 7.1 million). Goodwill
includes Euro 83.6 million for the acquisition in 2008 of the branches formerly owned by Unicredit, (of which Euro
30.5 million relates to Banca popolare del Mezzogiorno and Euro 53.1 million to BPER), and Euro 299.3 million for
the acquisition of investments in Group companies. Following the merger of the three Banks of Central Italy, at 30
September 2013 the amounts of goodwill of Banca Popolare di Lanciano e Sulmona (Euro 1.7 million), Banca
Popolare di Aprilia (Euro 10.1 million) and CARISPAQ - Cassa di Risparmio della provincia dell’Aquila (Euro 13.5
million) are already reported in the separate financial statements of the Parent Company, in addition to which there
is the goodwill already recorded at the time of the mergers of Banca CRV (Euro 2.3 million) and Meliorbanca (Euro
104.7 million).
(in thousands of Euro)
Captions
Property, plant and equipment
including owned land and properties
44
30.09.2013
31.12.2012
982,487
894,086
984,217
895,292
Change %change
(1,730)
(1,206)
-0.18
-0.13
INTERBANK POSITION
(in thousands of Euro)
Net interbank position
30.09.2013
31.12.2012
Change
%change
1,702,179
2,250,781
(548,602)
-24.37
777,361
994,097
(216,736)
-21.80
57,020
162,051
(105,031)
-64.81
278,153
686,902
(408,749)
-59.51
589,645
407,731
181,914
44.62
8,035,535
7,269,461
766,074
10.54
(6,333,356)
(5,018,680)
(1,314,676)
26.20
A. Due from banks
1. Current accounts and deposits
2. Repurchase agreements
3. Debt securities
4. Other
B. Due to banks
Total (A-B)
group interim
report
The following table gives details of such operations with the ECB. The Euro 145 thousand change
in the capital portion compared with 31 December 2012 is entirely due to CR Bra joining the
Group, as it also has outstanding long-term refinancing operations, with Euro 85 million expiring in
January 2015 and Euro 60 million expiring in February 2015.
(in millions of Euro)
Refinancing transactions with the European Central Bank
Capital
Maturity
1. Long-Term Refinancing Operation (LTRO) December 2011
2. Long-Term Refinancing Operation (LTRO) February 2012
3. Short-Term Refinancing Operations
2,485 January 15
2,060 February 15
-
Total
4,545
At 30 September 2013, the market value, including the interest portion, amounts to Euro 4,623
million. On the same date, the Central Treasury held significant resources relating to securities
eligible for refinancing at the European Central Bank, of an overall amount, net of margin calls, of
Euro 12,225 million.
Counterbalancing Capacity
Nominal
value
Eligible securities and loans
1 Securities as collateral for own and third-party
commitments
2 Securities subject to funding repurchase agreements
3 Securities and loans not transferred to the Pooling
Account
4 Securities and loans transferred to the Pooling
Account
Guarantee
value
(in millions of Euro)
Restricted Available
portion
portion
12,225
8,470
255
3,593
255
3,593
1,619
6,758
3,755
1,619
4,623
2,135
of which:,
Own debt guaranteed by the Italian Government
1,300
1,179
Own securitisations
2,972
2,242
Guaranteed Bank Bonds issued by the Bank
1,050
918
534
252
Collaterized Bank Assets (A.BA.CO.)
The net interbank position is negative for Euro 6.3 billion, including Euro 4.5 billion from LTRO
operations, and is adequately covered by the above securities eligible for refinancing and cash
reserves, resulting in a positive net cash position.
45
LIABILITIES AND SHAREHOLDERS' EQUITY
group interim
report
Liabilities and shareholders' equity
10. Due to banks
20. Due to customers
30. Debt securities in issue
40. Financial liabilities held for trading
50. Financial liabilities designated at fair value through
profit and loss
60. Hedging derivatives
80. Tax liabilities
a) current
b) deferred
90. Liabilities associated with non-current assets
held for sale
100.Other liabilities
110. Provision for termination indemnities
120. Provisions for risks and charges
a) pensions and similar commitments
b) other provisions
140. Valuation reserves
170. Reserves
180. Share premium reserve
190. Share capital
200. Treasury shares
210. Minority interests
220. Profit (loss) for the period pertaining to the Parent
Company
Total liabilities and shareholders' equity
46
30.09.2013
31.12.2012
Change
%change
10.54
8,035,535
7,269,461
766,074
32,504,053
32,288,488
215,565
0.67
9,818,702
11,047,786
(1,229,084)
-11.13
196,530
216,864
(20,334)
-9.38
3,143,502
3,865,649
(722,147)
-18.68
39,920
37,661
2,259
6.00
165,348
169,626
(4,278)
-2.52
57,820
46,426
11,394
24.54
107,528
123,200
(15,672)
-12.72
-
8,800
(8,800)
-100.00
2,352,135
1,465,718
886,417
60.48
206,888
223,324
(16,436)
-7.36
279,419
281,329
(1,910)
-0.68
107,063
104,833
2,230
2.13
172,356
176,496
(4,140)
-2.35
118,263
199,447
(81,184)
-40.70
2,266,222
2,264,190
2,032
0.09
624,154
619,462
4,692
0.76
1,001,482
998,165
3,317
0.33
(7,272)
(7,266)
(6)
0.08
679,315
700,325
(21,010)
-3.00
14,206
(11,271)
25,477
-226.04
61,438,402
61,637,758
(199,356)
-0.32
BORROWING
(in thousands of Euro)
Captions
Current accounts and demand deposits
Restricted deposits
Repurchase agreements
Other short-term loans
Bonds
- subscribed by institutional customers
30.09.2013
31.12.2012
Change %change
25,028,531
3,944,514
23,907,807
4,318,870
1,120,724
(374,356)
4.69
-8.67
1,132,257
2,398,751
9,395,685
1,339,596
2,722,215
10,541,534
(207,339)
(323,464)
(1,145,849)
-15.48
-11.88
-10.87
-71.34
255,079
889,931
(634,852)
9,140,606
9,651,603
(510,997)
-5.29
3,566,519
4,371,901
(805,382)
-18.42
Direct customer deposits
45,466,257
47,201,923
(1,735,666)
-3.68
Indirect deposits (off-balance sheet figure)
3.18
- subscribed by ordinary customers
Certificates of deposit
25,949,356
25,148,436
800,920
- of which managed
11,217,009
10,313,000
904,009
8.77
- of which administered
14,732,347
14,835,436
(103,089)
-0.69
71,415,613
72,350,359
(934,746)
-1.29
Customer funds under management
Bank borrowing
Funds under administration or management
8,035,535
7,269,461
766,074
10.54
79,451,148
79,619,820
(168,672)
-0.21
group interim
report
Direct customer deposits, amounting to Euro 45,466.3 million, show a decrease of 3.68% with respect to
December 2012, despite the overall rise of Euro 1,094.6 million (2.41% on total at 30 September 2013),
attributable to the inclusion of Cassa di Risparmio di Bra in the scope of consolidation.
Net of this contribution, on a consistent basis of comparison, the reduction comes to 6%, primarily due to:
repurchase agreements ("repos"), down by Euro 207.3 million (-15.48%); bonds, down by Euro 1,649.4 million (15.65%); certificates of deposit, down by Euro 825 million (-18.87%); other short-term loans (in particular cold
money), with a decrease of Euro 323.7 million (-11.89%). Conversely current accounts increase by Euro 619.3
million (+2.59%).
Indirect customer deposits, marked to market, come to Euro 25,949.4 million, up on 31 December 2012 (+3.18%).
The total nominal value of indirect borrowing of Euro 21,342.3 million has increased by 1.91% since 31 December
2012. Total funds administered or managed by the Group, including deposits from banks (Euro 8,035.5 million)
amount to Euro 79,451.1 million, a slight decrease of 0.21% compared with 31 December 2012.
Group banks' average cost of borrowing from customers during the first nine months was 1.47%,
which is down on the same period of last year (1.70%), a decrease of around 23 basis points.
Against total interest-bearing liabilities, the cost incurred in the period came to 1.32%, a decrease
of 27 bps compared with the first nine months of 2012.
47
(in thousands of Euro)
Direct deposits
30.09.2013
31.12.2012
27,273,895
29,866,725
(2,592,830)
-8.68
1,970,568
3,190,157
2,065,648
3,354,231
(95,080)
(164,074)
-4.60
-4.89
506,200
3,737,780
503,783
3,584,810
2,417
152,970
0.48
4.27
1,398,845
9,187,042
1,094,571
1,376,895
9,100,089
-
21,950
86,953
1,094,571
1.59
0.96
n.s.
Total banks
48,359,058
49,852,181
(1,493,123)
-3.00
Other companies and consolidation adjustments
(2,892,801)
(2,650,258)
(242,543)
9.15
Total
45,466,257
47,201,923
(1,735,666)
-3.68
1. Banca popolare dell'Emilia Romagna s.c.
group interim
report
2. Banca popolare di Ravenna s.p.a.
3. Banca popolare del Mezzogiorno s.p.a.
4. Bper (Europe) International s.a.
5. Banca della Campania s.p.a.
6. Banca di Sassari s.p.a.
7. Banco di Sardegna s.p.a.
8. Cassa di Risparmio di Bra s.p.a.
Change %change
The comparative figures of Banca popolare dell’Emilia Romagna s.c. include those of the Group banks absorbed
on 27 May 2013: Banca Popolare di Aprilia s.p.a. (Euro 627,048 thousand), Banca Popolare di Lanciano e
Sulmona s.p.a. (Euro 2,787,890 thousand) and CARISPAQ - Cassa di Risparmio della provincia dell’Aquila s.p.a.
(Euro 3,643,253 thousand), net of intercompany balances (Euro 1,123,403 thousand). The same adjustment was
made to "Other companies and consolidation adjustments".
Direct deposits include subordinated liabilities:
(in thousands of Euro)
Captions
30.09.2013
31.12.2012
Change %change
Convertible subordinated liabilities
Non-convertible subordinated liabilities
49,905
1,592,181
277,851
1,736,180
(227,946)
(143,999)
-82.04
-8.29
Total subordinated liabilities
1,642,086
2,014,031
(371,945)
-18.47
Convertible subordinated liabilities:
The nominal value of subordinated liabilities convertible into shares of consolidated banks and companies is Euro
49.9 million. These liabilities include a bond allocated to Fondazione Banco di Sardegna as part payment for
ordinary shares representing the "controlling interest" in that bank, Euro 31.2 million. The decrease is mainly due to
the repayment on 1 January 2013 of the BPER 3.70% 2006-2012 loan which expired on 31 December 2012 with a
marginal conversion of only 70 bonds into the same number of BPER shares.
Non-convertible subordinated liabilities:
The decrease relates primarily to the partial repayment of the BPER 4.75% 2011-2017 loan for a nominal amount
of Euro 140 million.
48
(in thousands of Euro)
Indirect deposits
30.09.2013
31.12.2012
19,508,914
18,324,484
1,184,430
6.46
1,137,674
985,353
1,096,594
986,414
41,080
(1,061)
3.75
-0.11
680,929
1,159,086
315,188
2,922,390
537,223
563,533
1,150,416
327,357
3,121,649
-
117,396
8,670
(12,169)
(199,259)
537,223
20.83
0.75
-3.72
-6.38
n.s.
Total banks
27,246,757
25,570,447
1,676,310
6.56
Other companies and consolidation adjustments
(1,297,401)
(422,011)
(875,390)
207.43
Total
25,949,356
25,148,436
800,920
3.18
1. Banca popolare dell'Emilia Romagna s.c.
2. Banca popolare di Ravenna s.p.a.
3. Banca popolare del Mezzogiorno s.p.a.
4. Bper (Europe) International s.a.
5. Banca della Campania s.p.a.
6. Banca di Sassari s.p.a.
7. Banco di Sardegna s.p.a.
8. Cassa di Risparmio di Bra s.p.a.
Change %change
group interim
report
The comparative figures of Banca popolare dell’Emilia Romagna s.c. include those of the Group banks absorbed
on 27 May 2013: Banca Popolare di Aprilia s.p.a. (Euro 210,150 thousand), Banca Popolare di Lanciano e
Sulmona s.p.a. (Euro 451,172 thousand) and CARISPAQ - Cassa di Risparmio della provincia dell’Aquila s.p.a.
(Euro 768,949 thousand).
The increase in "consolidation adjustments" is derived from the elimination of indirect deposits of Euro 1,018 million
acquired from BPER by Multilease AS (an SPV), represented by securities issued against the multi-originator selfsecuritisation of loans from leasing transactions, carried out jointly by Companies of the Sardaleasing Group and
ABF Leasing.
Indirect deposits do not include the placement of insurance policies, which shows a good increase
compared with 31 December 2012 (+13.84%), mainly due to the life insurance business.
(in thousands of Euro)
Bancassurance
Insurance policy portfolio
- of which: life sector
- of which: non-life sector
30.09.2013
31.12.2012
2,511,154
2,434,384
76,770
2,205,948
2,130,635
75,313
Change %change
305,206
303,749
1,457
13.84
14.26
1.93
The impact of CR Bra was marginal: Euro 37.6 million related entirely to life insurance.
49
SHAREHOLDERS’ EQUITY
(in thousands of Euro)
group interim
report
Captions
Consolidated shareholders' equity
- of which: net profit (loss) for the period
- of which: shareholders' equity excluding net profit
(loss) for the period
30.09.2013
31.12.2012
Change %change
4,017,055
14,206
4,062,727
(11,271)
(45,672)
25,477
-1.12
-226.04
4,002,849
4,073,998
(71,149)
-1.75
(in thousands of Euro)
Captions
Minority interests
- of which: net profit (loss) pertaining to minority
interests
- of which: shareholders' equity pertaining to minority
interests excluding their share of net profit (loss)
for the period
30.09.2013
31.12.2012
Change %change
679,315
700,325
(21,010)
-3.00
9,014
(21,327)
30,341
-142.27
670,301
721,652
(51,351)
-7.12
(in thousands of Euro)
Captions
Total shareholders' equity
30.09.2013
31.12.2012
4,696,370
4,763,052
Change %change
(66,682)
-1.40
This figure is made up of liability captions 140, 170, 180, 190, 200, 210 and 220.
(in thousands of Euro)
Shareholders' equity
1. Banca popolare dell'Emilia Romagna s.c.
30.09.2013
31.12.2012
Change %change
3,541,846
3,624,418
(82,572)
-2.28
2. Banca popolare di Ravenna s.p.a.
3. Banca popolare del Mezzogiorno s.p.a.
308,464
365,155
298,314
347,426
10,150
17,729
3.40
5.10
4. Bper (Europe) International s.a.
5. Banca della Campania s.p.a.
46,238
482,501
43,677
481,346
2,561
1,155
5.86
0.24
237,391
1,123,301
231,723
1,149,506
5,668
(26,205)
2.45
-2.28
6. Banca di Sassari s.p.a.
7. Banco di Sardegna s.p.a.
8. Cassa di Risparmio di Bra s.p.a.
Total banks
Other companies and consolidation adjustments
Total
Net profit (loss) for the period
Total shareholders' equity
84,306
-
84,306
n.s.
6,189,202
6,176,410
12,792
0.21
(1,507,038)
(1,402,087)
(104,951)
7.49
4,682,164
4,774,323
(92,159)
-1.93
14,206
(11,271)
25,477
-226.04
4,696,370
4,763,052
(66,682)
-1.40
The comparative figures of Banca popolare dell’Emilia Romagna s.c. include those of the Group banks absorbed
on 27 May 2013: Banca Popolare di Aprilia s.p.a. (Euro 114,167 thousand), Banca Popolare di Lanciano e
Sulmona s.p.a. (Euro 319,555 thousand) and CARISPAQ - Cassa di Risparmio della provincia dell’Aquila s.p.a.
(Euro 190,075 thousand), net of intercompany balances (Euro 467,623 thousand). The same adjustment was
made to "Other companies and consolidation adjustments".
The decline is mainly due to the negative change in valuation reserves relating to "Financial assets available for
sale", as a result of the significant sales of government bonds from this portfolio”.
50
3.4 Capital for supervisory purposes and capital ratios
Capital for supervisory purposes as at 30 September 2013 was determined for Bank of Italy
purposes in accordance with Circular 263 "New instructions for the prudent supervision of banks"
of 27 December 2006 and subsequent amendments, so without the net profit for the period, while
total risk-weighted assets (RWA) were calculated on the basis of the Basel 2 standardised
approach.
The figures for capital for supervisory purposes to be calculated as a ratio of total risk-weighted
assets of Euro 44,313.7 million (Euro 44,758.3 million at 31 December 2012), are as follows:
Tier 1 capital: Euro 3,706.2 million, with a Core element of Euro 3,683.9 million. The Core
Tier 1 ratio and the Tier 1 ratio therefore come to 8.31% and 8.36%.
Total capital for supervisory purposes: Euro 5,287.6 million. The Total capital ratio comes
to 11.93%.
Taking into account, for comparison purposes, the net profit at 30 September 2013 attributable to
shareholders' equity (Euro 21.4 million) and the effects of applying the fair value option for the
quarter, net of tax, for a positive value with respect to the elements be deducted of Euro 7.5
million, capital for supervisory purposes can be quantified as follows:
Tier 1 capital: Euro 3,756.4 million (Euro 3,714.8 million at 31 December 2012). The Core
element amounts to Euro 3,734 million (Euro 3,701.6 million at 31 December 2012).
Tier 2 capital: Euro 1,581.3 million (Euro 1,712.7 million at 31 December 2012).
Total capital for supervisory purposes: Euro 5,337.7 million (Euro 5,427.5 million at 31
December 2012), without any Tier 3 elements as in the comparison period.
Capital as a proportion of the total of the above asset exposures gives the following capital ratios:
Core Tier 1 ratio: 8.43% (8.27% in December 2012);
Tier 1 capital ratio: 8.48% (8.30% in December 2012);
Total capital ratio: 12.05% (12.13% in December 2012);
with committed capital of Euro 3,545.1 million (Euro 3,580.7 million at 31 December 2012).
group interim
report
The inclusion of CR Bra in the Group's scope of consolidation has had a negative effect that can
be quantified at around -13 bps and -11 bps on the Core Tier 1 and Tier 1 ratios respectively.
51
(in thousands of Euro)
group interim
report
Core Capital
items to be deducted
Core Tier 1 capital
Hybrid instruments and
shares
30.09.2013
pro-forma
31.12.2012
Change
%change
3,850,629
(166,764)
3,683,865
3,900,810
(166,764)
3,734,046
3,865,844
(164,220)
3,701,624
34,966
(2,544)
32,422
0.90
1.55
0.88
preference
22,365
22,365
13,217
9,148
69.21
Tier 1 capital
3,706,230
3,756,411
3,714,841
41,570
1.12
Tier 2 capital
1,581,328
1,581,328
1,712,658
(131,330)
-7.67
Capital for supervisory purposes
5,287,558
5,337,739
5,427,499
(89,760)
-1.65
-
-
-
-
-
5,287,558
5,337,739
5,427,499
(89,760)
-1.65
44,313,688
44,313,688
44,758,313
(444,625)
-0.99
Committed capital:
- Credit and counterparty risk
- Market risk
- Operational risk
- Other precautionary requirements
3,132,961
31,098
320,981
60,055
3,132,961
31,098
320,981
60,055
3,171,674
30,399
315,835
62,757
(38,713)
699
5,146
(2,702)
-1.22
2.30
1.63
-4.31
Total committed capital
(35,570)
-0.99
Tier 3 capital
Capital for supervisory purposes
including Tier 3
Risk-weighted assets
52
30.09.2013
as per law
3,545,095
3,545,095
3,580,665
Core Tier 1 ratio
Tier 1 capital ratio
8.31%
8.36%
8.43%
8.48%
8.27%
8.30%
0.16
0.18
Total capital ratio
11.93%
12.05%
12.13%
-0.08
3.5 Reconciliation of consolidated net profit/shareholders' equity
Consolidated net profit comprises the sum of the Group's interest in the net profits (losses) at 30
September 2013 of the following Group Banks and Companies included within the scope of
consolidation.
group interim
report
(in thousands of Euro)
Reconciliation of consolidated net profit
Banca popolare dell'Emilia Romagna s.c.
Other Group companies:
Banca popolare di Ravenna s.p.a.
30.09.2013
(20,070)
59,103
2,831
Banca popolare del Mezzogiorno s.p.a.
BpER (Europe) International s.a.
21,535
694
Banca della Campania s.p.a.
Banco di Sardegna s.p.a. (consolidated value)
14,182
6,554
Cassa di Risparmio di Bra s.p.a.
Nadia s.p.a.
(955)
872
BPER Services s.cons.p.a.
EMRO Finance Ireland limited
Mutina s.r.l.
Nettuno Gestione Crediti s.p.a.
Optima s.p.a. SIM
Modena Terminal s.r.l.
Emilia Romagna Factor s.p.a.
Estense Covered Bond s.r.l.
A.B.F. Leasing s.p.a.
Melior Valorizzazioni Immobili s.r.l.
BPER Trust Company s.p.a.
Immobiliare Reiter s.p.a.
Galilei immobiliare s.r.l.
1,825
4,109
99
2,400
986
2,843
878
503
(103)
(113)
(37)
Total Group share
Consolidation adjustments
Consolidated net profit (loss)
39,033
(24,827)
14,206
53
As required by current regulations, the following statement is presented with regard to the position
at 30 September 2013:
group interim
report
Reconciliation of the shareholders’ equity and results of the Parent Company with
the related consolidated amounts
Increase (decrease)
Net profit (loss)
AMOUNTS RELATING TO THE PARENT COMPANY
(20,070)
3,521,776
DIFFERENCES between the shareholders' equity of companies
consolidated on a line-by-line basis (net of minority interests) and
the book value of the related equity investments held by their
parent companies, as follows:
56,457
492,213
- adjustments to goodwill related to consolidated companies
- elimination of intercompany profits and losses
(3,001)
- share of the results of fully consolidated companies, net of tax
effect
59,458
DIVIDENDS collected from companies consolidated on a line-byline basis or stated under the equity method
(18,773)
1
DIFFERENCE between book value and the interest in shareholders' equity (including results for the period) of companies carried
at equity
(3,408)
3,065
NET PROFIT AND SHAREHOLDERS' EQUITY OF THE
PARENT COMPANY AS AT 30.09.2013
14,206
4,017,055
9,014
679,315
23,220
4,696,370
NET PROFIT AND SHAREHOLDERS' EQUITY OF MINORITY
INTERESTS
TOTAL CONSOLIDATED NET PROFIT AND SHAREHOLDERS'
EQUITY AS AT 30.09.2013
TOTAL CONSOLIDATED NET PROFIT AS AT 30.09.2012
TOTAL CONSOLIDATED SHAREHOLDERS' EQUITY AT
31.12.2012
54
Shareholders'
equity
138,041
4,763,052
3.6 Income statement aggregates
(in thousands of Euro)
0
Captions
30.09.2013 30.09.2012
Change
%change
10. Interest and similar income
1,555,772
1,655,108
(99,336)
-6.00
20. Interest and similar expense
(591,589)
(674,307)
82,718
-12.27
964,183
980,801
(16,618)
-1.69
30. Net interest income
40. Commission income
559,585
571,006
(11,421)
-2.00
50. Commission expense
(40,099)
(40,576)
477
-1.18
60. Net commission income
519,486
530,430
(10,944)
-2.06
70. Dividends and similar income
23,530
4,547
18,983
417.48
80. Net trading income
32,874
90,382
(57,508)
-63.63
(191)
(1,074)
883
-82.22
112,496
50,039
62,457
124.82
159.62
90. Net hedging gains (losses)
100. Gains/losses on disposal or repurchase of:
a) loans
b) financial assets available for sale
c) financial assets held to maturity
d) financial liabilities
110. Net results on financial assets and liabilities
designated at fair value
(1,215)
(468)
(747)
110,062
25,990
84,072
323.48
-
(179)
179
-100.00
3,649
24,696
(21,047)
-85.22
10.66
(46,820)
(42,310)
(4,510)
120. Net interest and other banking income
1,605,558
1,612,815
(7,257)
-0.45
130. Net impairment adjustments to:
(623,106)
(423,654)
(199,452)
47.08
(591,383)
(419,978)
(171,405)
40.81
(4,621)
(4,828)
207
-4.29
(27,102)
1,152
(28,254)
--
982,452
1,189,161
(206,709)
-17.38
(975,761)
(966,095)
(9,666)
1.00
a) payroll
(591,780)
(600,671)
8,891
-1.48
b) other administrative costs
(383,981)
(365,424)
(18,557)
5.08
(20,078)
(10,696)
(9,382)
87.72
200. Net adjustments to property, plant and equipment
(30,426)
(32,163)
1,737
-5.40
210. Net adjustments to intangible assets
(15,817)
(11,279)
(4,538)
40.23
51.34
a) loans
b) financial assets available for sale
d) other financial assets
140. Net profit from financial activities
180. Administrative costs:
190. Net provision for risks and charges
220. Other operating charges/income
230. Operating costs
240. Profit (loss) from equity investments
260. Adjustments to goodwill
162,975
107,690
55,285
(879,107)
(912,543)
33,436
-3.66
(4,415)
6,106
(10,521)
-172.31
-
(36)
36
-100.00
341
(2,649)
2,990
-112.87
99,271
280,039
(180,768)
-64.55
(77,309)
(142,480)
65,171
-45.74
21,962
137,559
(115,597)
-84.03
1,258
482
776
161.00
320. Net profit (loss)
23,220
138,041
(114,821)
-83.18
330. Net profit (loss) pertaining to minority interests
340. Profit (loss) for the period pertaining to the Parent
Company
(9,014)
3,666
(12,680)
-345.88
14,206
141,707
(127,501)
-89.98
270. Gains (losses) on disposal of investments
280. Profit (loss) from current operations before tax
290. Income taxes on current operations
300. Profit (loss) from current operations after tax
310. Profit (loss) after tax on non-current assets held for
sale
group interim
report
55
56
90. Net hedging gains (losses)
(5,318)
15,433
(1,041)
14,392
330. Net profit (loss) pertaining to minority interests
340. Profit (loss) pertaining to the Parent Com pany
1,525
13,908
(30,509)
44,417
88
-
(5)
320. Net profit (loss)
310. Profit (loss) after tax on non-current assets held for sale
300. Profit (loss) from current operations after tax
290. Income taxes on current operations
280. Profit (loss) from current operations before tax
270. Gains (losses) on disposal of investments
260. Adjustments to goodw ill
240. Profit (loss) from equity investments
(285,535)
57,822
220. Other operating charges/income
230. Operating costs
(4,958)
(10,081)
210. Net adjustments to intangible assets
200. Net adjustments to property, plant and equipment
190. Net provision for risks and charges
(198,440)
(124,560)
b) other administrative costs
(323,000)
329,869
(5,468)
(670)
(161,628)
a) payroll
180. Administrative costs:
140. Net profit from financial activities
d) other financial assets
b) financial assets available for sale
a) loans
(167,766)
497,635
130. Net impairment adjustments to:
(18,215)
120. Net interest and other banking incom e
1,381
-
23,417
36
(35,856)
(532)
(35,324)
(1,082)
(34,242)
(5,374)
(28,868)
39
-
(8,200)
(312,885)
55,765
(5,307)
(10,155)
(13,060)
(131,959)
(208,169)
(340,128)
292,178
(19,390)
(2,528)
(278,131)
(300,049)
592,227
(17,230)
43
-
74,004
(723)
73,324
74
24,834
110. Net results on financial assets and liabilities designated at fair value
d) financial liabilities
c) financial assets held to maturity
b) financial assets available for sale
a) loans
100. Gains/losses on disposal or repurchase of:
22,415
175,522
(280)
70. Dividends and similar income
12,041
575
60. Net com m ission incom e
(12,997)
188,519
326,081
(196,370)
522,451
35,670
(7,441)
43,111
815
42,296
(41,426)
83,722
214
-
3,790
(280,687)
49,388
(5,552)
(10,190)
(1,700)
(127,462)
(185,171)
(312,633)
360,405
(2,244)
(1,423)
(151,624)
(155,291)
515,696
(11,375)
2,225
-
12,641
(528)
14,338
15
12,516
540
172,675
(13,645)
186,320
326,987
(183,420)
510,407
2nd quarter 3rd quarter 2013
2013
8,317
171,289
50. Commission expense
80. Net trading income
184,746
(13,457)
40. Commission income
311,115
30. Net interest incom e
522,914
(211,799)
20. Interest and similar expense
1st quarter 2013
10. Interest and similar income
Captions
14,206
(9,014)
23,220
1,258
21,962
(77,309)
99,271
341
-
(4,415)
(879,107)
162,975
(15,817)
(30,426)
(20,078)
(383,981)
(591,780)
(975,761)
982,452
(27,102)
(4,621)
(591,383)
(623,106)
1,605,558
(46,820)
3,649
-
110,062
(1,215)
112,496
(191)
32,874
23,530
519,486
(40,099)
559,585
964,183
(591,589)
1,555,772
87,737
(6,038)
93,775
-
93,775
(64,748)
158,523
(27)
-
(233)
(308,239)
31,283
(3,581)
(10,315)
(4,907)
(122,801)
(197,918)
(320,719)
467,022
(696)
(201)
(98,725)
(99,622)
566,644
(26,380)
917
(179)
11,077
169
11,984
(329)
72,137
920
171,804
(11,292)
183,096
336,508
(229,990)
566,498
30.09.2013 1st quarter 2012
Consolidated income statement by quarter as at 30 September 2013
(4,960)
11,577
(16,537)
-
(16,537)
(20,701)
4,164
(1,633)
(36)
5,384
(321,557)
30,255
(3,637)
(11,414)
(3,654)
(127,774)
(205,333)
(333,107)
322,006
150
(4,672)
(190,883)
(195,405)
517,411
10,768
21,926
-
(351)
(515)
21,060
(362)
(19,714)
3,288
181,722
(13,955)
195,677
320,649
(226,019)
546,668
58,930
(1,873)
60,803
482
60,321
(57,031)
117,352
(989)
-
955
(282,747)
46,152
(4,061)
(10,434)
(2,135)
(114,849)
(197,420)
(312,269)
400,133
1,698
45
(130,370)
(128,627)
528,760
(26,698)
1,853
-
15,264
(122)
16,995
(383)
37,959
339
176,904
(15,329)
192,233
323,644
(218,298)
541,942
2nd quarter 3rd quarter 2012
2012
141,707
3,666
138,041
482
137,559
(142,480)
280,039
(2,649)
(36)
6,106
(912,543)
107,690
(11,279)
(32,163)
(10,696)
(365,424)
(600,671)
(966,095)
1,189,161
1,152
(4,828)
(419,978)
(423,654)
1,612,815
(42,310)
24,696
(179)
25,990
(468)
50,039
(1,074)
90,382
4,547
530,430
(40,576)
571,006
980,801
(674,307)
1,655,108
(152,978)
17,661
(170,639)
(482)
(170,157)
117,295
(287,452)
2,964
(12)
9,085
(293,262)
35,963
(4,733)
(12,685)
(18,436)
(124,465)
(168,906)
(293,371)
(6,227)
(5,844)
(4,011)
(538,415)
(548,270)
542,043
(14,438)
223
-
42,024
(306)
41,941
(160)
7,995
456
177,511
(14,289)
191,800
328,738
(212,603)
541,341
30.09.2012 4th quarter 2012
(11,271)
21,327
(32,598)
-
(32,598)
(25,185)
(7,413)
315
(48)
15,191
(1,205,805)
143,653
(16,012)
(44,848)
(29,132)
(489,889)
(769,577)
(1,259,466)
1,182,934
(4,692)
(8,839)
(958,393)
(971,924)
2,154,858
(56,748)
24,919
(179)
68,014
(774)
91,980
(1,234)
98,377
5,003
707,941
(54,865)
762,806
1,309,539
(886,910)
2,196,449
31.12.2012
group interim
report
The following table shows the summary data of the consolidated income statement at 30
September 2013, with comparative figures from the previous year, which when referring to the
Parent Company, in the detailed information, take into account the merger:
of the wholly-owned subsidiary Meliorbanca, carried out on 26 November 2012 and
effective for accounting and tax purposes from 1 January 2012;
of the subsidiaries CARISPAQ, BPLS and BPA, carried out on 27 May 2013 and effective
for tax and accounting purposes from 1 January 2013.
Reconciliation schedules showing how these pro-forma figures of the Parent Company were
calculated are attached to this consolidated quarterly report. These figures have not been audited
by PricewaterhouseCoopers s.p.a.
group interim
report
Net interest income comes to Euro 964.2 million, a decrease of 1.69% (Euro 980.8 million at 30
September 2012). The result is positively influenced by the inclusion in the consolidation of CR
Bra for an amount in excess of Euro 16 million, while negatively affected by the continuing decline
in market interest rates (average 3-month Euribor in the first nine months declining by 50 bps
compared with the same period in 2012) and weak demand for commercial loans, only partially
offset by the increase in the contribution from the portfolio of financial assets. net of CR Bra, there
has been a decrease of 3.36%. Compared with the previous quarter, however, net interest income
is substantially in line (Euro 327 million compared with Euro 326.1 million, +0.28%) with the yield
spread at much the same levels as last quarter, with both the mark-up and mark-down falling by
the same amount.
(in thousands of Euro)
Net interest income
1.
2.
3.
4.
5.
6.
7.
8.
30.09.2013
30.09.2012
Banca popolare dell'Emilia Romagna s.c.
Banca popolare di Ravenna s.p.a.
Banca popolare del Mezzogiorno s.p.a.
Bper (Europe) International s.a.
Banca della Campania s.p.a.
Banca di Sassari s.p.a.
Banco di Sardegna s.p.a.
Cassa di Risparmio di Bra s.p.a.
491,750
45,679
75,132
2,442
82,569
38,701
162,447
16,354
489,489
44,718
75,958
2,877
86,716
38,418
195,257
-
2,261
961
(826)
(435)
(4,147)
283
(32,810)
16,354
0.46
2.15
-1.09
-15.12
-4.78
0.74
-16.80
n.s.
Total banks
915,074
933,433
(18,359)
-1.97
49,109
47,368
1,741
3.68
964,183
980,801
(16,618)
-1.69
Other companies and consolidation adjustments
Total
Change %change
The comparative figures of Banca popolare dell’Emilia Romagna s.c. include those of Meliorbanca s.p.a. (Euro
29,490 thousand), a Group company merged on 26 November 2012, of Banca Popolare di Aprilia s.p.a. (Euro
15,125 thousand), Banca Popolare di Lanciano e Sulmona s.p.a. (Euro 60,085 thousand) and CARISPAQ – Cassa
di Risparmio della provincia dell’Aquila s.p.a. (Euro 43,210 thousand), Group companies merged on 27 May 2013,
net of intercompany balances (Euro 181 thousand). The same adjustment was made to "Other companies and
consolidation adjustments.
57
group interim
report
Net commission income, Euro 519.5 million, decreased (-2.06% on 30 September 2012). The
comparison is marginally affected by changes in the scope of consolidation (CR Bra has been
consolidated at 30 September 2013 with a contribution of Euro 7.7 million, whereas at 30
September 2012 there was a contribution of commission income on the part of the custodian bank
business of Euro 1.8 million); on the other hand, a significant impact was made by regulatory
changes during the period (introduced by the "Save Italy" decree in force from the fourth quarter
of 2012 which led to a different accounting allocation from "Commission income" to "Other
operating income"); at 30 September 2013 these changes had an impact of Euro 58 million.
Recalculating these commissions pro-forma, taking into account the items mentioned above,
results in an increase of 7.78%.
(in thousands of Euro)
Net commission income
Trading in currency/financial instruments
Indirect deposits and insurance policies
Credit cards, collections and payments
Loans and guarantees
Other commissions
Total net commission income
30.09.2013
30.09.2012
Change %change
5,330
94,402
113,394
282,197
6,694
80,874
111,829
307,012
(1,364)
13,528
1,565
(24,815)
-20.38
16.73
1.40
-8.08
24,163
24,021
142
0.59
519,486
530,430
(10,944)
-2.06
The net result from trading activities (including dividends) is positive for Euro 121.9 million,
up on the first nine months of 2012 (Euro 101.6 million). The key elements in forming this result
were profits on the sale of financial assets (Euro 116.4 million, all of Euro 60.3 million higher than
the figure at 30 September 2012), dividends (Euro 23.5 million, higher by Euro 19 million
compared with 30 September 2012 because of a sizeable extraordinary dividend received from
Arca Vita) and capital gains on financial assets of Euro 18.2 million (of which Euro 9.9 million on
debt securities), compared with Euro 79.6 million in the same period of 2012. By contrast,
application of the fair value option to liabilities shows a negative value of Euro 54.2 million (it was
negative by Euro 51.8 million at 30 September 2012).
(in thousands of Euro)
Net trading income (including dividends)
Dividends
Gain on disposal of financial assets
Gains on financial assets
Losses on financial assets
Fair value option
Other revenues/losses
Total
58
30.09.2013
30.09.2012
23,530
116,393
18,151
(7,054)
(54,210)
25,079
121,889
4,547
56,088
79,633
(6,281)
(51,827)
19,424
101,584
Change %change
18,983
60,305
(61,482)
(773)
(2,383)
5,655
20,305
417.48
107.52
-77.21
12.31
4.60
29.11
19.99
Net interest and other banking income amounts to Euro 1,605.6 million, substantially
unchanged with respect to the same period last year (-0.45%), and benefits from the significant
contribution of CR Bra.
(in thousands of Euro)
Net interest and other banking income
1.
2.
3.
4.
5.
6.
7.
8.
Banca popolare dell'Emilia Romagna s.c.
Banca popolare di Ravenna s.p.a.
Banca popolare del Mezzogiorno s.p.a.
Bper (Europe) International s.a.
Banca della Campania s.p.a.
Banca di Sassari s.p.a.
Banco di Sardegna s.p.a.
Cassa di Risparmio di Bra s.p.a.
Total banks
Other companies and consolidation adjustments
Total
30.09.2013
30.09.2012
888,737
63,387
115,190
4,840
127,524
72,103
255,134
31,778
882,965
73,950
126,636
7,144
159,929
69,182
325,118
-
5,772
(10,563)
(11,446)
(2,304)
(32,405)
2,921
(69,984)
31,778
1,558,693
1,644,924
(86,231)
-5.24
46,865
(32,109)
78,974
-245.96
1,605,558
1,612,815
(7,257)
-0.45
group interim
report
Change %change
0.65
-14.28
-9.04
-32.25
-20.26
4.22
-21.53
n.s.
The comparative figures of Banca popolare dell’Emilia Romagna s.c. include those of Meliorbanca s.p.a. (Euro
45,445 thousand), a Group company merged on 26 November 2012, of Banca Popolare di Aprilia s.p.a. (Euro
29,049 thousand), Banca Popolare di Lanciano e Sulmona s.p.a. (Euro 91,343 thousand) and CARISPAQ – Cassa
di Risparmio della provincia dell’Aquila s.p.a. (Euro 68,053 thousand), Group companies merged on 27 May 2013,
net of intercompany balances (Euro 3,163 thousand). The same adjustment was made to "Other companies and
consolidation adjustments”.
Net adjustments to loans and other financial assets amount to Euro 623.1 million, a significant
increase on the first nine months of 2012 (+47.08%). This increase is a result of both the
continuing economic recession and the serious difficulties suffered by companies and households
as a consequence, and of more restrictive classification and provisioning criteria.
The level of coverage of doubtful loans is satisfactory and suitable for the portfolio's level of risk:
ample information is given on the coverage ratio in the part of this Report that deals with “Loans to
customers”. The significant increase in adjustments to other financial assets (Euro 27.1 million
versus write-backs of Euro 1.2 million at 30 September 2012) refers largely to the provisions
made in respect of endorsement loans related to performing customers. This provision derives
from the way in which the general loan adjustment was determined, as we applied advanced
Basel 2 models for the calculation of PD and LGD (these models are now definitely consolidated
and in force); this made it possible to take advantage of additional information to extend the
provisions also to this type of loans, which up to now were automatically covered by any excess
provisions on cash loans. It is therefore a one-off adjustment offset to a large extent by the
realignment of the level of coverage of performing cash loans.
The adjustments made on “Financial assets available for sale” amount to Euro 4.6 million (-4.29%
compared with 30 September 2012) and refer to the identification of impairment losses, consistent
with the accounting policies adopted by the Group, recorded for Euro 1.7 million on the equity
portfolio and Euro 2.9 million on the UCITS portfolio.
59
(in thousands of Euro)
Net impairment adjustments to loans (caption
130 a)
group interim
report
30.09.2013
30.09.2012
437,607
16,258
235,057
15,608
202,550
650
86.17
4.16
3. Banca popolare del Mezzogiorno s.p.a.
4. Bper (Europe) International s.a.
10,247
1,135
14,792
394
(4,545)
741
-30.73
188.07
5.
6.
7.
8.
18,382
15,090
54,100
16,532
29,571
10,919
100,060
-
(11,189)
4,171
(45,960)
16,532
-37.84
38.20
-45.93
n.s.
569,351
406,401
162,950
40.10
22,032
13,577
8,455
62.27
591,383
419,978
171,405
40.81
1. Banca popolare dell'Emilia Romagna s.c.
2. Banca popolare di Ravenna s.p.a.
Banca della Campania s.p.a.
Banca di Sassari s.p.a.
Banco di Sardegna s.p.a.
Cassa di Risparmio di Bra s.p.a.
Total banks
Other companies and consolidation adjustments
Total
Change %change
The comparative figures of Banca popolare dell’Emilia Romagna s.c. include those of Meliorbanca s.p.a. (Euro
15,380 thousand), a Group company merged on 26 November 2012, and of Banca Popolare di Aprilia s.p.a. (Euro
1,919 thousand), Banca Popolare di Lanciano e Sulmona s.p.a. (Euro 22,375 thousand) and CARISPAQ - Cassa
di Risparmio della provincia dell’Aquila s.p.a. (Euro 14,039 thousand), the Group banks absorbed on 27 May 2013.
The total cost of credit at 30 September 2013 comes to 125 bps, corresponding to 167 bps on an
annualised basis, although it is worth pointing out that the sizeable one-off adjustment recorded at
30 June 2013 (Euro 158 million) suggests that this assessment is not in line with expectations.
The cost of credit in the same period last year amounted to 87 bps, whereas the effective cost at
31 December 2012 was 199 bps.
The net profit from financial activities, Euro 982.5 million, shows a decrease of 17.38% on 30
September 2012. On a quarterly basis there has been an increase of Euro 68.2 million,
accounting for 23.35%, on the last quarter.
Operating costs, net of other operating charges/income, amount to Euro 879.1 million, 3.66%
down on the same period last year: a decrease that is even more significant if we exclude CR
Bra's contribution (-5.38%).
The decrease is mainly attributable to the rise in "Other operating income" (Euro 163 million:
+51.34% on 30 September 2012). Since the fourth quarter of 2012, the change to the fee
structure imposed by the "Save Italy" decree is recorded under caption 220 (Euro 58 million).
Taking into account these elements and certain extraordinary items accounted for in the two
periods:
legal costs incurred for the management of non-performing loans, some of which (in the
case of certain Group banks) were allocated directly to the debtor (Euro 6.5 million at 30
September 2013);
personnel charges relating to provisions for redundancy incentives and the Solidarity
Fund (Euro 9 million in 2013 and Euro 22.5 million in 2012);
the capital gain realised in the previous year for the sale of the custodian bank business
(Euro 20.9 million);
operating costs compared on a consistent basis are down by 0.55%.
60
(in thousands of Euro)
Operating costs
1.
2.
3.
4.
5.
6.
7.
8.
30.09.2013
30.09.2012
Banca popolare dell'Emilia Romagna s.c.
Banca popolare di Ravenna s.p.a.
Banca popolare del Mezzogiorno s.p.a.
Bper (Europe) International s.a.
Banca della Campania s.p.a.
Banca di Sassari s.p.a.
Banco di Sardegna s.p.a.
Cassa di Risparmio di Bra s.p.a.
421,784
38,548
67,737
2,735
83,165
51,834
182,039
15,682
441,523
39,986
74,013
2,507
88,667
54,087
197,072
-
(19,739)
(1,438)
(6,276)
228
(5,502)
(2,253)
(15,033)
15,682
-4.47
-3.60
-8.48
9.09
-6.21
-4.17
-7.63
n.s.
Total banks
863,524
897,855
(34,331)
-3.82
15,583
14,688
895
6.09
879,107
912,543
(33,436)
-3.66
Other companies and consolidation adjustments
Total
Change %change
group interim
report
The comparative figures of Banca popolare dell’Emilia Romagna s.c. include those of Meliorbanca s.p.a. (Euro
19,140 thousand), a Group company merged on 26 November 2012, of Banca Popolare di Aprilia s.p.a. (Euro
16,696 thousand), Banca Popolare di Lanciano e Sulmona s.p.a. (Euro 52,736 thousand) and CARISPAQ – Cassa
di Risparmio della provincia dell’Aquila s.p.a. (Euro 39,770 thousand), Group companies merged on 27 May 2013,
net of intercompany balances (Euro 182 thousand). The same adjustment was made to "Other companies and
consolidation adjustments”.
Payroll costs, Euro 591.8 million, are down by 1.48% compared with 30 September 2012; net of
extraordinary costs mentioned above (Euro 9 million in 2013 and Euro 22.5 million in 2012) and
the impact for the consolidation of CR Bra (Euro 10.2 million), they show a decrease of 0.97%.
Other administrative costs amount to Euro 384 million, a rise of 5.08%, which decline to 3.20%
if calculated net of the contribution of CR Bra (Euro 6.9 million); the increase is due to the legal
costs incurred for the management of the above non-performing loans (Euro 6.5 million recorded
at 30 September 2013).
The "taxation" element, almost entirely recovered in "other charges/income", totals Euro 99.5
million (Euro 86.9 million at 30 September 2012); other costs (Euro 284.5 million) increase by
2.15% (Euro 278.5 million at 30 September 2012), but only by 0.29% net of the consolidation of
CR Bra (Euro 279.3 million).
Net provisions for risks and charges (Euro 20.1 million) are up by Euro 9.4 million.
There has been an increase of 6.45% in net impairment losses on tangible and intangible
assets (Euro 46.2 million).
The profit from current operations before tax amounts to Euro 99.3 million (Euro 280 million at
30 September 2012, -64.55%).
Income taxes for the period are estimated at Euro 77.3 million, giving an effective tax rate of
77.88%, mainly because of the non-deductibility of loan loss provisions and most payroll costs for
IRAP purposes.
61
group interim
report
Net profit, net of taxes and including the result of the assets held for sale, is Euro 23.2 million
(Euro 138 million at 30 September 2012).
The profit pertaining to minority interests amounts to Euro 9 million (at 30 September 2012
there was a loss of Euro 3.7 million).
The net profit pertaining to the Parent Company amounts to Euro 14.2 million (Euro 141.7
million at 30 September 2012).
(in thousands of Euro)
Net profit
1.
2.
3.
4.
5.
6.
7.
8.
Banca popolare dell'Emilia Romagna s.c.
Banca popolare di Ravenna s.p.a.
Banca popolare del Mezzogiorno s.p.a.
Bper (Europe) International s.a.
Banca della Campania s.p.a.
Banca di Sassari s.p.a.
Banco di Sardegna s.p.a.
Cassa di Risparmio di Bra s.p.a.
Total banks
Other companies and consolidation adjustments
Total
30.09.2013
30.09.2012
Change %change
(20,070)
3,256
22,254
695
14,286
1,737
9,605
(1,425)
125,466
11,751
24,046
3,021
25,088
1,743
14,667
-
(145,536)
(8,495)
(1,792)
(2,326)
(10,802)
(6)
(5,062)
(1,425)
-116.00
-72.29
-7.45
-76.99
-43.06
-0.34
-34.51
n.s.
30,338
205,782
(175,444)
-85.26
(16,132)
(64,075)
47,943
-74.82
14,206
141,707
(127,501)
-89.98
The comparative figures of Banca popolare dell’Emilia Romagna s.c. include those of Meliorbanca s.p.a. (Euro
4,278 thousand), a Group company merged on 26 November 2012, of Banca Popolare di Aprilia s.p.a. (Euro 7,145
thousand), Banca Popolare di Lanciano e Sulmona s.p.a. (Euro 8,966 thousand) and CARISPAQ – Cassa di
Risparmio della provincia dell’Aquila s.p.a. (Euro 9,026 thousand), Group companies merged on 27 May 2013, net
of intercompany balances (Euro 6,032 thousand). The same adjustment was made to "Other companies and
consolidation adjustments".
62
3.7 Group employees
Employees
1.
2.
3.
4.
5.
6.
7.
8.
Banca popolare dell'Emilia Romagna s.c.
Banca popolare di Ravenna s.p.a.
Banca popolare del Mezzogiorno s.p.a.
Bper (Europe) International s.a.
Banca della Campania s.p.a.
Banca di Sassari s.p.a.
Banco di Sardegna s.p.a.
Cassa di Risparmio di Bra s.p.a.
Total banks
30.09.2013
31.12.2012
Change
5,759
468
915
16
1,064
555
2,424
198
5,881
477
933
15
1,094
564
2,557
-
(122)
(9)
(18)
1
(30)
(9)
(133)
198
11,399
11,521
(122)
324
313
11
11,723
11,834
(111)
Other companies
Total
group interim
report
The number of employees indicated for each bank takes account of staff seconded to other Group companies.
In particular, BPER’s employees at 30 September 2013 include 657 people seconded to the Group, of which 622
are with BPER Services S.C.p.A.; the equivalent numbers at 31 December 2012 were 659 and 629, respectively.
The positive change compared with 31 December 2012 is given by the consolidation of Cassa di Risparmio di Bra
s.p.a. (198 people) and the acquisition of the banking business of Serfina Banca s.p.a. (21 people); the negative
change mainly relates to the outputs for the agreement signed with the Trade Unions on the subject of voluntary
redundancies and the "Solidarity Fund" (269 people) with effect from 1 July 2013.
63
3.8 Geographical organisation of the Group
group interim
report
Branches
30.09.2013
31.12.2012
Change
1. Banca popolare dell'Emilia Romagna s.c.
2. Banca popolare di Ravenna s.p.a.
533
71
533
70
1
3.
4.
5.
6.
7.
115
130
57
392
28
115
130
57
392
-
28
1,326
1,297
29
Banca popolare del Mezzogiorno s.p.a.
Banca della Campania s.p.a.
Banca di Sassari s.p.a.
Banco di Sardegna s.p.a.
Cassa di Risparmio di Bra s.p.a.
Total commercial banks
8. Bper (Europe) International s.a.
Total
1
1
-
1,327
1,298
29
The number of branches of Banca popolare dell’Emilia Romagna s.c. at 31 December 2012 includes 25 of Banca
Popolare di Aprilia s.p.a., 78 of Banca Popolare di Lanciano e Sulmona s.p.a. and 54 of CARISPAQ – Cassa di
Risparmio della provincia dell’Aquila s.p.a., Group companies merged on 27 May 2013.
The Group's commercial banks are located throughout the country as can be seen from the
following table:
64
Details
Emilia - Romagna
Bologna
Ferrara
Forlì – Cesena
Modena
Parma
Piacenza
Ravenna
Reggio Emilia
Rimini
Abruzzo
Chieti
L’Aquila
Pescara
Teramo
Basilicata
Matera
Potenza
Calabria
Catanzaro
Cosenza
Crotone
BPER BPRA BPMEZZ BCAM BSSS BSAR CRBRA 30.09.2013 31.12.2012
279
60
2
31
90
27
5
2
43
19
103
36
47
12
8
36
20
16
44
10
14
9
332
60
15
33
90
28
5
39
43
19
103
36
47
12
8
36
20
16
44
10
14
9
334
61
15
33
91
28
5
39
43
19
101
35
47
11
8
36
20
16
44
10
14
9
Reggio Calabria
7
7
7
Vibo Valentia
4
4
4
108
108
108
29
5
7
26
41
2
1
29
5
7
26
41
75
3
10
2
58
2
5
3
1
1
49
1
4
5
1
1
11
24
1
1
9
2
2
1
2
2
29
5
7
26
41
75
3
10
2
58
2
5
3
1
1
49
1
4
5
1
1
11
24
1
1
9
2
3
Campania
Avellino
Benevento
Caserta
Naples
Salerno
Lazio
Frosinone
Latina
Rieti
Rome
Viterbo
Liguria
Genoa
La Spezia
Savona
Lombardy
Bergamo
Brescia
Cremona
Lecco
Lodi
Mantua
Milan
Monza Brianza
Varese
Marche
Ancona
Ascoli Piceno
Fermo
Macerata
Pesaro-Urbino
58
2
9
2
44
1
42
1
4
5
1
1
11
17
1
1
9
2
2
1
2
2
52
1
13
2
1
37
1
14
1
1
1
12
1
5
3
1
1
7
7
group interim
report
2
2
65
Details
group interim
report
66
BPER BPRA BPMEZZ BCAM BSSS BSAR CRBRA 30.09.2013 31.12.2012
Molise
Campobasso
Isernia
Piedmont
Alessandria
Asti
Cuneo
Turin
Apulia
Bari
Barletta Andria Trani
Foggia
Taranto
Sardinia
Cagliari
Carbonia-Iglesias
Medio Campidano
Nuoro
Ogliastra
Olbia-Tempio
Oristano
Sassari
Sicily
Agrigento
Catania
Messina
Palermo
Siracusa
Tuscany
Florence
Grosseto
Livorno
Lucca
Massa Carrara
Pisa
Pistoia
Prato
Trentino-Alto Adige
Trento
Umbria
Terni
Veneto
Belluno
Padua
Rovigo
Treviso
Venice
Verona
Vicenza
10
7
3
12
4
Total 30.09.2013
533
71
115
130
57
392
Total 31.12.2012
533
70
115
130
57
392
28
3
4
17
4
2
15
11
1
2
20
4
16
3
56
16
3
4
6
1
7
2
17
358
84
21
23
46
21
38
57
68
20
4
3
7
3
3
7
1
1
1
7
1
1
2
1
2
2
2
2
3
3
2
2
18
2
18
7
6
2
3
28
10
7
3
28
3
4
17
4
37
11
5
18
3
414
100
24
27
52
22
45
59
85
20
4
3
7
3
3
15
2
1
1
4
1
2
2
2
3
3
2
2
36
2
7
6
2
3
12
4
10
7
3
37
11
5
18
3
414
100
24
27
52
22
45
59
85
20
4
3
7
3
3
15
2
1
1
4
1
2
2
2
3
3
2
2
35
2
7
6
2
2
12
4
1,326
1,297
1,297
29
4. OTHER INFORMATION
4.1 Treasury shares
No quotas or shares in Group companies are held through trust companies or other third parties;
furthermore, such parties were not used during the period to buy or sell shares or quotas in Group
companies.
group interim
report
The carrying amount of the Group’s interest in the treasury shares held by consolidated
companies, classified as a deduction from liability caption 200, is Euro 7,272 thousand.
The table below shows the details at 30 September 2013:
Number of
Total par value
Group interest
455,458
1,366,374
7,270,068
Banca di Sassari s.p.a.
25,255
30,306
2,324
Total as at 30.09.2013
480,713
1,396,680
7,272,392
Total as at 31.12.2012
478,887
1,391,699
7,266,422
shares
Banca popolare dell'Emilia Romagna s.c.
4.2 Ratings
On 9 July, Standard & Poor's lowered its assessment of the creditworthiness of Italian sovereign
debt, downgrading the medium-to-long term rating from BBB+ to BBB and assigning a negative
outlook, as did Fitch Rating at the beginning of March, revising it downwards from A- to BBB+,
subsequently confirming this rating on 25 October 2013. These agencies also downgraded a good
part of their ratings of the national banking system, including BPER:
International Rating Agency
Standard & Poor's
Fitch Ratings
Issue date
Long-term
Short-term
Outlook
29 August 2013
BB-
B
Stable
26 July 2013
BB+
B
Negative
Standard & Poor’s
On 29 August 2013, Standard & Poor's, the international rating agency, has revised the long-term
rating to BB- from BB, while confirming the short-term rating to B and, at the same time, improving
the outlook to "stable" from "negative".
Fitch Ratings
On 26 July 2013, as part of various rating changes on mid-sized Italian banks, Fitch Ratings
revised its long-term rating to BB+ from BBB, its short-term rating to B from F3 and its Viability
rating to bb+ from bbb. The Support rating and Support rating floor were confirmed at 3 and BB+,
respectively. The outlook remains “negative
67
4.3 Inspections by the Supervisory Authorities on Group Banks and Companies
group interim
report
CONSOB
On the basis of the commitments made by the Parent Company with its communication of 31
October 2012 following the inspection begun on 13 April 2011 and ended on 17 February 2012,
CONSOB sent a letter on 26 April 2013 to Banca popolare dell’Emilia Romagna requesting
further details and reminding the Bank to resolve the matters raised during the inspection. The
Parent Company sent CONSOB the documentation requested by the deadline, sending a copy to
the sister banks so that they are aware of the situation.
In another letter dated 10 May 2013, CONSOB also requested additional information on certain
contracts entered into and on the amount of financial instruments traded on the BPER Group's
Systematic Internaliser called “Melt”, in addition to the total number of persons who have access
to that system, with a view to mapping and reviewing the micro-structural characteristics of Italian
trading platforms. This data will have to be sent monthly to the Supervisory Authority. The Parent
Company has complied with this request by sending a data stream for all Group banks.
In the first half of 2012, CONSOB officially began an inspection at Banca Popolare di Ravenna
s.p.a. to review:
transactions in the ordinary shares of Banca Popolare di Ravenna s.p.a. since January
2010;
the activities carried out in connection with the acceptance of the voluntary Public
Exchange Offer of Banca popolare dell'Emilia Romagna s.c. for the ordinary shares of
Banca Popolare di Ravenna s.p.a.
The inspection officially ended on 26 September 2012.
In a letter dated 18 March 2013, the Supervisory Authority asked the Bank to take corrective
action to bring internal procedures into line with the MiFID; these interventions are currently being
prepared or are already in place at the Parent Company, having been identified as a result of the
inspection carried out by CONSOB, given that the procedures adopted are the same as those
recommended. With the same communication, the Supervisory Authority asked the Board of
Directors, Statutory Auditors and the Compliance function to provide their thoughts on the
adaptation activities undertaken by the Parent Company. On 14 June 2013, the Supervisory
Authority also requested information on the portfolio management business. The Bank prepared
two different communications for the Supervisory Authority in response to its requests, which were
sent in July 2013.
Bank of Italy
The inspection at the Parent Company, valid for the entire BPER Group, that began on 12
November 2012, was concluded on 1 March 2013. Its purpose was to look into the assessment of
adequacy of loan losses provisions for non-performing loans, watchlist loans and restructured
loans, and the related application policies and practices. The inspection had systemic
connotations as it involved other major banking groups and various small and medium-sized
entities at the same time, such that the principal methods applied and the main results were the
subject of a public notice released by the Bank of Italy at the end of July.
On 24 June, the Supervisory Authority notified to the Bank the results of the inspection, conducted
in accordance with criteria that reflect the deepening economic downturn and the growing
difficulties in the housing market, which gave rise to partially unfavourable results; these form part
of the evaluation of the prudent process and derive from certain weaknesses found in the internal
rules and practices in use, in addition to the need for higher provisions. The Supervisory Authority
68
has, however, acknowledged that the higher estimates of loan losses were almost entirely
incorporated in the 2012 financial statements and that corrective action has been initiated to
improve the organisational controls in this area. In view of the observations made, the Corporate
Bodies promptly formulated their own considerations, and activated an acceleration in the steps
already taken to update procedures in this area.
group interim
report
On 4 March 2013, the Bank of Italy began a new inspection, in continuation of the previous one,
to carry out assessments on the "adequacy of the system of governance, management and
control of credit risk, as well as recognition of the work undertaken by the BPER Group for the
introduction of an internal model to calculate capital requirements for this type of risk". The
intervention of the Supervisory Authority is consistent with the activities of BPER on one of the
key topics of the 2012-2014 Industrial Plan (Basel 2 programme: activation of a process of
ratification of internal models for credit risk and evolution of the methodology for calculating the
capital requirement). The inspection was completed on 5 July.
On 17 September 2013, the Supervisory Authority notified to the Bank the results of its inspection,
which was concluded with partially favourable results. In a nutshell, despite the highly critical
economic situation it was found that the Bank had a relatively low exposure to credit risk. The
Bank of Italy also invited BPER to strengthen its activities of guidance, coordination and control of
the Group. In view of the observations made, the Corporate Bodies promptly formulated their own
considerations.
With reference to the inspection that ended in December 2011 at Banca della Campania s.p.a.,
the results of which have been notified in March 2012, the Bank of Italy issued notice in February
2013 that imposed administrative sanctions against members of the Board of Directors, the
General Manager and the members of the Board of Statutory Auditors.
During the first half of 2012, the Bank of Italy carried out an ordinary inspection on Banco di
Sardegna s.p.a. as part of its normal supervisory activities, which ended in the same year. The
Supervisory Authority notified in July 2013 that it was imposing administrative sanctions against
the members of the Board of Directors, the General Manager and the members of the Board of
Statutory Auditors.
69
4.4 Disclosure of exposures to sovereign debt held by listed companies
group interim
report
70
With communication DEM/11070007 of 5 August 2011 CONSOB pointed out that on 28 July
2011 the European Securities Markets Authority (ESMA) published Document no. 2011/266 on
the disclosures concerning sovereign debt (i.e. bonds issued by central and local governments
and by government entities, as well as loans granted to them) to be included in annual and interim
financial statements prepared by listed companies that have adopted International Accounting
Standards (IAS/IFRS).
As a result of the increased interest of markets in sovereign debt, ESMA has stressed the need
for greater transparency on the subject in financial statements of European listed issuers that
apply IAS/IFRS.
With its document, which does not have any independent prescriptive authority, ESMA has tried
to assist issuers in preparing disclosures on sovereign debt that fully comply with the related
principles.
In accordance with these instructions, the following is a summary of the relevant information on
exposures of the Banca popolare dell’Emilia Romagna Group to the aggregate in question.
Debt securities
Issuer
Rating
Cat
Governments:
Italy
Belgium
Germany
Spain
AFS
Reserves
Fair value
%
6,158,169
6,166,835
23,026
99.95%
5,568,374
5,907,581
5,916,532
23,440
95.89%
519,420
25,020
4,326,064
697,870
-
537,358
29,629
4,553,443
787,151
-
537,358
29,629
4,553,443
796,102
-
#
#
23,440
#
#
57,500
55,637
55,637
(1,967)
0.90%
HFT
CFV
AFS
HTM
L/R
57,500
100,000
55,637
97,911
55,637
97,911
#
#
(1,967)
#
#
913
1.59%
HFT
CFV
AFS
HTM
L/R
100,000
25,002
97,911
24,644
97,911
24,644
#
#
913
#
#
658
0.40%
2
25,000
20,494
2
24,642
20,321
2
24,642
20,457
#
#
658
#
#
279
0.33%
HFT
CFV
AFS
HTM
L/R
3,994
11,500
5,000
15,000
3,863
11,265
5,193
15,760
3,863
11,265
5,329
16,010
#
#
279
#
#
217
0.26%
HFT
CFV
-
-
-
#
#
AFS
HTM
10,000
5,000
10,594
5,166
10,594
5,416
217
#
-
-
-
#
BBB+
AAA
AA
AAA
HFT
CFV
AFS
HTM
L/R
Austria
Book value
5,822,273
HFT
CFV
AFS
HTM
L/R
The
Netherlands
Nominal
value
AAA
BBB
L/R
group interim
report
71
group interim
report
Issuer
Ireland
Portugal
France
Australia
Rating
Cat
72
AFS
Reserves
Fair value
%
10,288
10,390
-
0.17%
HFT
CFV
AFS
HTM
L/R
10,000
10,000
10,288
10,135
10,390
9,362
#
#
#
#
-
0.16%
HFT
CFV
AFS
HTM
L/R
10,000
9,000
10,135
8,681
9,362
8,681
#
#
#
#
(513)
0.14%
HFT
CFV
-
-
-
#
#
AFS
HTM
L/R
9,000
6,903
8,681
7,211
8,681
7,211
(513)
#
#
(1)
HFT
CFV
-
-
-
#
#
AFS
HTM
6,903
-
7,211
-
7,211
-
(1)
#
L/R
2,861
2,884
2,876
#
-
0.05%
0.05%
BB+
AA+
AAA
2,861
2,884
2,876
-
HFT
CFV
AFS
22
-
21
-
21
-
#
#
-
HTM
L/R
2,839
5,825,134
2,863
6,161,053
2,855
6,169,711
#
#
23,026
-
Total debt securities
Book value
10,000
BBB+
Other public entities:
Italy
Nominal
value
0.12%
100.00%
Loans
Issuer
Rating
Cat
Governments:
Italy
BBB+
1,495,112
1,495,112
HFT
CFV
AFS
HTM
L/R
Other public entities:
Italy
HFT
CFV
AFS
HTM
L/R
Algeria
HFT
CFV
AFS
HTM
L/R
Total loans
Nominal value
Book value
Fair value
1,495,112
1,495,112
AFS Reserves
-
-
%
group interim
report
75.88%
75.88%
#
#
1,495,112
475,150
1,495,112
475,150
-
#
#
-
470,875
470,875
-
-
24.12%
23.90%
#
#
470,875
4,275
#
#
-
-
470,875
4,275
0.22%
#
#
4,275
1,970,262
#
#
-
-
4,275
1,970,262
100.00%
The ratings indicated are those of Fitch Rating at 30 September 2013.
Based on their book value, repayment of these exposures is distributed as follows:
on demand
Debt securities
up to 1 year
1 to 5 years
over 5 years
Total
-
808,023
3,447,541
1,905,489
6,161,053
Loans
263,723
331,638
336,896
1,038,005
1,970,262
Total
263,723
1,139,661
3,784,437
2,943,494
8,131,315
73
4.5 Main litigation and legal proceedings pending
group interim
report
Tax disputes
With reference to the subsidiary EMRO Finance Ireland Ltd, on 19 July 2011 the tax police
notified an official report of findings to the Irish Company at the end of an audit relating to the tax
years 2005-2009.
On 12 March 2012, the Modena Tax Office filed a notice of assessment, which is not enforceable,
relating to tax years 2005 and 2006, in which they contest the company's foreign status, involving
total taxes of Euro 11.2 million.
Management, with the support of authoritative legal advice, considers that there are all the
elements to appeal against this assessment and does not consider it likely that this matter will
have negative consequences.
In any case, at the end of April 2012 the Irish company filed a proposal to come to a settlement in
order to assess possible alternatives to litigation, starting with the inclusion in taxable income of
very minor amounts in relation to the activity carried on by EMRO Finance Ireland, while
confirming their absolute conviction that they had acted correctly. At the end of this attempt to
come to a settlement, which ended in a stalemate, the company filed an appeal with the Modena
Tax Commission.
In December 2012, the company received a tax bill for part of the taxes contained in the notices of
assessment for 2005 and 2006, against which the company obtained a stay of execution from the
Provincial Tax Commission of Modena filed on 5 March 2013.
The hearing before the Commission was held on 23 September 2013 and we are waiting for the
judgement to be announced.
Alongside the dispute, the Mutual Agreement Procedure (MAP) between Ireland and the Ministry
of Economy and Finance - Finance Department, pursuant to Article 25 of the OECD Model, has
been activated as an alternate path for an amicable settlement of the Company's tax residence.
In the absolute conviction that they had acted correctly, with the support of important external
legal advice, the Company did not consider there to be the conditions to make any provision for
the taxes in dispute, but for prudence sake posting to the provision for risks and charges the
estimated value of the legal costs involved, given the uncertainty as to how long the litigation is
likely to last.
Investigation into what the media have labelled the “Parioli scam”
It should be noted that certain individuals, who are suspects in the investigation into what the
media have labelled the “Parioli scam,” held accounts, also by means of companies held by them,
with a Rome branch of CARISPAQ, from 27 May 2013 absorbed by the Group,
In this context it should be noted that CARISPAQ has been cited as being responsible in civil
proceedings no. 14545/2011 R.G.T. before the Court of Rome in a panel, IX Criminal Chamber, in
which Gianfranco Lande stands accused of alleged conspiracy to carry out fraud as well as other
crimes against property, unauthorised financial practices and trying to obstruct the supervisory
functions; crimes committed through companies controlled by Lande, some of which had current
accounts at a Rome branch of CARISPAQ. In this regard, it should be noted that CARISPAQ has
been cited for third-party liability by 249 persons.
28 June 2012, the Court of Rome condemned Gianfranco Lande to 9 years and 8 months in
prison and a fine of Euro 20,000.
74
CARISPAQ was also ordered, jointly and severally with the defendant, to pay damages in favour
of plaintiffs, to be paid in separate proceedings, as well as reimbursement of the legal expenses
incurred by the plaintiffs, as quantified by the Court. The Court rejected all requests for a
provisional award.
It follows that, according to the judgement, CARISPAQ is not currently required to pay any sum.
The written judgement with the reasons underlying the sentence was filed on 27 December 2012.
CARISPAQ had appeal against the sentence on 20 March 2013 before the Court of Appeal of
Rome. In fact, the first degree judgement affirms the Bank's responsibility on a questionable legal
basis and never applied to date against a private entity, given that it has no indirect liability for the
facts ascribed to Lande. The judgement on appeal is in progress and the next hearing is
scheduled for 12 November 2013.
It should also be noted that some of those alleged to have been damaged by Lande's conduct,
some of whom did not present themselves as plaintiffs in these criminal proceedings, have sued
the Bank under civil law for reimbursement of the damage suffered, even in the absence of any
causal link between the damage alleged by the plaintiffs and any illegal acts or irregularities
carried out by CARISPAQ, where definitively established. These civil proceedings are still at the
preparatory stage.
group interim
report
For completeness of information, it should be noted that three CARISPAQ employees, who were
in charge of the Rome branch at the time, have been indicted by the Public Prosecutor: one for
participation in the fraud committed by Lande; two for alleged irregularities against the anti-money
laundering legislation in the management of the E.I.M. accounts at their branch. The preliminary
hearing held on 4 April 2013 was dedicated exclusively to filing numerous plaintiff's briefs and the
Judge, reserving the right to handle any of the matters involving these briefs, adjourned the
hearing to 20 May 2013. At that hearing, the Judge admitted the summons of BPER for possible
civil liability as the merging company of CARISPAQ, adjourning the matter to the hearing on 1
July 2013. At this last hearing, the same Judge admitted as plaintiffs all those who had applied.
The next hearing was held on 21 October 2013.
The Bank has duly appeared as defendant, contesting both the issue of the inadmissibility of the
plaintiff's filings and the fact that it is not possible to duplicate the requests for compensation
already made in Lande's trial. These requests were, however, rejected by the Court, mainly
because the condemnation of civil liability, already pronounced in the first lawsuit, was not yet
covered by res judicata.
At present, no direct requests for damages have been received in relation to the facts of which
employees have been accused.
For an assessment of the potential financial and economic impacts that could arise from this
situation, during the preparation of this consolidated quarterly report, CARISPAQ, now BPER
following its recent merger, has over time obtained a number of legal opinions from the law firms
that assist it in the various trials and pro veritate opinions prepared by a respected professional
totally unrelated to the Bank's defence, as well as contributions from another respected
professional, the latest being at the end of June 2013.
In particular, a detailed study has been made of the merits of the judgment of conviction issued
against the bank, in the light of the rules and principles applicable in our legal system with regard
to passive legitimation of third-party liability and compensation for damages in criminal
proceedings. Particular attention has been given to issues relating to the lack of a causal link
between the alleged damage and the conduct of CARISPAQ.
In particular, then, with reference to the conviction suffered by CARISPAQ and commented on
earlier, all of the said professionals unanimously considered as remote the risk of CARISPAQ
75
group interim
report
(now BPER) having to pay damages, both in terms of an, and in terms of a hypothetical quantum,
as they believe that the conviction can be overturned at the next level of justice.
Given the above, it is currently believed that there is only a remote possibility that the bank will
suffer adverse consequences as a result of this matter; consequently, in accordance with IAS 37,
it was decided not to make any provision.
Judgment of the Court of Modena
You are reminded that the Court of Modena, in its judgment of 24 February 2012, cancelled the
shareholders' resolution of 16 April 2011 for partial renewal of the Board of Directors of the Parent
Company, which appointed as Directors for the three-year period 2011-2013 Piero Ferrari (current
member of the Executive Committee), Alberto Marri (current member of the Executive and
Strategy Committees), Giuseppe Lusignani (current member of the Internal Audit and Strategy
Committees), Fioravante Montanari, Erminio Spallanzani (current member of the Executive
Committee) and Manfredi Luongo (Minority Director). Given that this is a constitutive judgement,
which is not enforceable, the composition of the BPER Board - as far as the Directors involved in
the judgment are concerned - remains as it was, as do the resolutions that it has passed and the
responsibilities and powers that have been attributed.
The Bank appealed against this judgement, serving notice on 19 June 2012 and highlighting the
serious argumentative gaps in it, also with reference to key legal questions.
In the appeal proceedings, at the hearing of 16 January 2013, the Bologna Court of Appeal set
the date for the next hearing on 21 October 2014, for the statement of conclusions.
76
5. SIGNIFICANT SUBSEQUENT EVENTS AND OUTLOOK FOR OPERATIONS
5.1 Subsequent events
Issue and placement of Covered Bonds
Under the long-term programme of Guaranteed Bank Bonds ("Covered Bonds") of Euro 5 billion,
intended for institutional investors, with the approval of the base prospectus by the Luxembourg
"Commission de Surveillance du Secteur Financier" on 30 November 2011, updated on 8 August
2013, a new bond issue, the third of the programme and the first placed on the market, was
carried out on 15 October 2013 for an amount of Euro 750 million. The security, issued with a
fixed annual rate of 3.375% and maturing in 5 years, was received by investors with considerable
interest and demand was more than twice the nominal value issued.
group interim
report
Data collection for the ECB-SSM (SPE2)
On 11 October 2013, the Parent Bank BPER was asked by the Italian Supervisory Authority, in
coordination with the European Central Bank in the context of the broader Banking Union project
as regards the imminent start of the Single Supervisory Mechanism (SSM), to produce a set of
data not currently available in the streams already forwarded to the Bank of Italy, designed to feed
the regulatory analytical models being developed for the supervision of major banking groups.
Strategic project to simplify and streamline the Group
On 30 October 2013, the Board of Directors of the Parent Bank approved the guidelines of a
strategic project to simplify and streamline the organisational and governance structure of the
Banking Group: the plan is for the banks having their registered office in the Italian peninsula to
be absorbed by the Parent Company between the end of 2014 and the first half of 2015.
This integrates what was already planned and implemented under the 2012-2014 Business Plan
and forms a base on which to establish priorities for the next Plan.
The purpose of this project is to make the guidance, supervision and control activities within the
Group more effective and to achieve significant synergies, while expanding the range of services
offered to customers. The staff of the banks due to be absorbed will be given the utmost
consideration to ensure an appropriate enhancement of the resources. In addition, attention to the
particular characteristics of the various local communities that we serve will be ensured by setting
up suitable delocalised control units (Territorial Divisions) and Territorial Committees with the task
of developing interventions to support local communities and their economy, as we have already
carried out successfully during previous mergers.
77
5.2 Outlook for operations
group interim
report
In the latter part of the year, it seems that a slow and gradual recovery in economic activity has
begun, despite a business environment that remains difficult, conditioned by significant
uncertainty on the political and economic front. The weakness in domestic demand will continue
to limit the chances of a recovery in lending activities and could lead to pressure on the revenues
of the banking system. Credit quality will continue to influence the banking system's earnings
prospects, albeit to a lesser extent than last year, while the process of cost control should
continue.
The BPER Group's main objectives for the latter part of the year are to maintain an adequate level
of financial solidity, to strengthen traditional banking profitability and to reduce operating costs
even more. While initial signs of normalisation are visible, the cost of credit is expected to remain
high, but still lower than in 2012.
Modena, 12 November 2013
The Board of Directors
The Chairman
Ettore Caselli
78
CONSOLIDATED
FINANCIAL STATEMENTS
Banca popolare dell’Emilia Romagna
Banking Group
79
Consolidated balance sheet as at 30 September 2013
(in thousands of Euro)
Assets
10. Cash and balances with central banks
30.09.2013
31.12.2012
421,763
488,873
20. Financial assets held for trading
30. Financial assets designated at fair value through profit and loss
1,159,484
1,596,048
151,919
151,450
40. Financial assets available for sale
50. Financial assets held to maturity
5,915,811
4,679,402
1,203,539
818,050
60. Due from banks
70. Loans to customers
1,702,179
2,250,781
47,207,476
48,048,735
80. Hedging derivatives
90. Remeasurement of financial assets backed by general hedges (+/-)
2,381
-
-
1,060
100. Equity investments
120. Property, plant and equipment
257,371
269,094
982,487
984,217
130. Intangible assets
475,991
467,488
of which: goodwill
383,045
375,935
140. Tax assets
a) current
987,426
957,066
64,270
113,483
b) deferred
b1) of which L. 214/2011
150. Non-current assets and disposal groups held for sale
160. Other assets
923,156
843,583
785,990
715,316
Total assets
Liabilities and shareholders' equity
10. Due to banks
20. Due to customers
30. Debt securities in issue
40. Financial liabilities held for trading
50. Financial liabilities designated at fair value through profit and loss
60. Hedging derivatives
80. Tax liabilities
a) current
b) deferred
90. Liabilities associated with non-current assets held for sale
100.Other liabilities
110. Provision for termination indemnities
120. Provisions for risks and charges
a) pensions and similar commitments
b) other provisions
140. Valuation reserves
2,817
18,329
967,758
907,165
61,438,402
61,637,758
30.09.2013
31.12.2012
8,035,535
7,269,461
32,504,053
32,288,488
9,818,702
11,047,786
196,530
216,864
3,143,502
3,865,649
39,920
37,661
165,348
169,626
57,820
46,426
107,528
123,200
-
8,800
2,352,135
1,465,718
206,888
223,324
279,419
281,329
107,063
104,833
172,356
176,496
118,263
199,447
170. Reserves
180. Share premium reserve
2,266,222
2,264,190
624,154
619,462
190. Share capital
200. Treasury shares
1,001,482
998,165
(7,272)
(7,266)
210. Minority interests
220. Profit (loss) for the period pertaining to the Parent Company
Total liabilities and shareholders' equity
679,315
700,325
14,206
(11,271)
61,438,402
61,637,758
consolidated
financial
statements
81
Consolidated income statement as at 30 September
2013
consolidated
financial
statements
(in thousands of Euro)
Captions
30.09.2013
30.09.2012
10. Interest and similar income
1,555,772
1,655,108
20. Interest and similar expense
(591,589)
(674,307)
30. Net interest income
964,183
980,801
40. Commission income
559,585
571,006
50. Commission expense
(40,099)
(40,576)
60. Net commission income
519,486
530,430
70. Dividends and similar income
23,530
4,547
80. Net trading income
32,874
90,382
(191)
(1,074)
112,496
50,039
90. Net hedging gains (losses)
100. Gains/losses on disposal or repurchase of:
a) loans
b) financial assets available for sale
c) financial assets held to maturity
d) financial liabilities
110. Net results on financial assets and liabilities designated at fair value
(468)
110,062
25,990
-
(179)
3,649
24,696
(46,820)
(42,310)
120. Net interest and other banking income
1,605,558
1,612,815
130. Net impairment adjustments to:
(623,106)
(423,654)
(591,383)
(419,978)
(4,621)
(4,828)
a) loans
b) financial assets available for sale
d) other financial assets
140. Net profit from financial activities
(27,102)
1,152
982,452
1,189,161
(975,761)
(966,095)
a) payroll
(591,780)
(600,671)
b) other administrative costs
(383,981)
(365,424)
190. Net provision for risks and charges
(20,078)
(10,696)
200. Net adjustments to property, plant and equipment
(30,426)
(32,163)
210. Net adjustments to intangible assets
(15,817)
(11,279)
220. Other operating charges/income
162,975
107,690
(879,107)
(912,543)
(4,415)
6,106
180. Administrative costs:
230. Operating costs
240. Profit (loss) from equity investments
260. Adjustments to goodwill
270. Gains (losses) on disposal of investments
280. Profit (loss) from current operations before tax
290. Income taxes on current operations
300. Profit (loss) from current operations after tax
-
(36)
341
(2,649)
99,271
280,039
(77,309)
(142,480)
21,962
137,559
1,258
482
320. Net profit (loss)
23,220
138,041
330. Net profit (loss) pertaining to minority interests
(9,014)
3,666
340. Profit (loss) for the period pertaining to the Parent Company
14,206
141,707
Earnings per
share
(Euro)
30.09.2013
Earnings per
share
(Euro)
30.09.2012
Basic EPS
0.041
0.421
Diluted EPS
0.046
0.425
310. Profit (loss) after tax on non-current assets held for sale
82
(1,215)
Statement of consolidated comprehensive income
(in thousands of Euro)
Statement of consolidated comprehensive income
10 Profit (loss) for the period
30.09.2013
30.09.2012
23,220
138,041
(91,780)
167,870
consolidated
financial
statements
Other elements of income, net of income taxes
20 Financial assets available for sale
60 Cash flows hedges
90 Actuarial gains (losses) on defined-benefit pension
100 Portion of the valuation reserves of equity investments carried at equity
2,365
(1,870)
(1,198)
(16,782)
2,800
(968)
110 Total other elements of income (net of income taxes)
(87,813)
148,250
120 Total comprehensive income (Captions 10+110)
(64,593)
286,291
130 Comprehensive income attributable to minority interests
140 Total consolidated comprehensive income pertaining to Parent
7,283
(71,876)
738
285,553
Company
83
84
-
66,068
715,675
3,930,715
-
-
700,325
4,062,727
(32,598)
(7,268)
-
-
-
-
-
19,170
-
(19,170)
(19,170)
-
-
-
-
715,675
3,930,715
237,359
(83,362)
-
109,276
70,474
2,446,615
2,517,089
752,856
-
1,113,172
1,113,172
C ha nge s B a la nc e a s
in o pe ning
a t 1.1.12
ba la nc e s
( *)
-
-
-
-
244,056
66,068
2,702,649
2,768,717
691,714
-
1,098,431
1,098,431
-
-
-
-
D iv ide nds
a nd o t he r
a llo c a t io ns
-
-
-
-
-
-
-
-
-
-
-
-
(209,256)
-
-
-
-
209,256
209,256
R e s e rv e s
-
-
-
-
-
-
-
-
-
-
-
(28,103)
(28,103)
D iv ide nds
a nd o t he r
a llo c a t io ns
-
-
-
-
-
-
-
A llo c a t io n o f prio r ye a r
re s ult s
-
-
32,598
-
-
-
-
(32,598)
(32,598)
R e s e rv e s
A llo c a t io n o f prio r ye a r
re s ult s
3,660
(11,220)
-
-
-
(13,307)
(610)
26,889
26,279
(4,959)
-
(15,573)
(15,573)
C ha nge s
in
re s e rv e s
(28,293)
18,201
-
-
-
5,842
179,955
(181,749)
(1,794)
(10,638)
-
(3,502)
(3,502)
C ha nge s
in
re s e rv e s
-
21,878
-
76,046
-
-
-
-
-
(55,907)
-
1,739
1,739
Is s ue o f
ne w
s ha re s
-
8,013
-
4
-
-
-
-
-
4,692
-
3,317
3,317
Is s ue o f
ne w
s ha re s
-
-
-
-
-
-
-
-
-
-
-
-
-
-
-
-
-
-
-
-
-
-
-
-
-
-
P urc ha s
e of
t re a s ury
s ha re s
-
-
-
-
-
-
-
-
-
-
-
-
-
E xt ra o rdina ry
dis t ribut io n
o f div ide nds
-
-
-
-
-
-
-
-
-
-
-
-
-
-
-
-
-
-
-
-
-
-
-
-
-
-
s ha re s
C hang es i n D e riv a t iv e
eq ui t y
s on
i nst r ument s
t re a s ury
-
-
-
-
-
-
-
-
-
-
-
-
-
s ha re s
C hang es i n D e riv a t iv e
eq ui t y
s on
i nst r ument s
t re a s ury
C ha nge s during t he pe rio d
-
-
-
-
-
-
-
-
-
-
-
-
-
E xt ra o rdina ry
dis t ribut io n
o f div ide nds
T ra ns a c t io ns o n s ha re ho lde rs ' e quit y
-
(10)
-
(10)
-
-
-
-
-
-
-
-
-
P urc ha s
e of
t re a s ury
s ha re s
T ra ns a c t io ns o n s ha re ho lde rs ' e quit y
C ha nge s during t he pe rio d
-
-
-
-
-
-
-
-
-
-
-
-
-
Sto ck
o pt io ns
-
-
-
-
-
-
-
-
-
-
-
-
-
Sto ck
o pt io ns
738
285,553
138,041
-
-
148,250
-
-
-
-
-
-
-
C o m pre he ns iv
e inc o m e a s
a t 3 0 .0 9 .2 0 12
7,283
(71,876)
23,220
-
-
(87,813)
-
-
-
-
-
-
-
C o m pre he ns iv
e inc o m e a s
a t 3 0 .0 9 .2 0 13
679,315
-
9,014
(2)
-
43,822
135
467,968
468,103
61,614
-
4,198,823
141,707
(7,290)
-
184,090
70,483
2,192,206
2,262,689
619,462
-
998,165
998,165
G ro up
-
96,764
96,764
M ino rit y
int e re s t s
720,073
-
(3,666)
(26)
-
40,959
(619)
509,724
509,105
72,528
-
101,173
101,173
M ino rit y
int e re s t s
S ha re ho lde rs ' e quit y a s
a t 3 0 .0 9 .2 0 12
-
4,017,055
14,206
(7,272)
-
118,263
245,888
2,020,334
2,266,222
624,154
-
1,001,482
1,001,482
G ro up
S ha re ho lde rs ’ e quit y a s
a t 3 0 .0 9 .2 0 13
(in thousands of Euro)
(*) The change in the opening balances of reserves from profits and valuation reserves is in line with the approach adopted by the National Association of Actuaries (Circular no. 35 of 21 December 2012), as detailed in
Part A of the Explanatory Notes to the 2012 consolidated financial statements.
M ino rit y int e re s t s
G ro up s ha re ho lde rs ' e quit y
237,359
N e t pro f it ( lo s s )
(83,362)
E quit y ins t rum e nt s
T re a s ury s ha re s
90,106
70,474
2,465,785
2,536,259
752,856
V a lua t io n re s e rv e s
b) o ther
a) fro m pro fits
R e s e rv e s :
S ha re pre m ium re s e rv e
-
1,113,172
b) o ther shares
1,113,172
a) o rdinary shares
B a la nc e a s
a t 3 1.12 .11
700,325
S ha re c a pit a l:
M ino rit y int e re s t s
4,062,727
(32,598)
G ro up s ha re ho lde rs ' e quit y
N e t pro f it ( lo s s )
(7,268)
-
-
244,056
-
2,702,649
-
-
-
-
C ha nge s B a la nc e a s
in o pe ning
a t 1.1.13
ba la nc e s
2,768,717
691,714
T re a s ury s ha re s
E quit y ins t rum e nt s
V a lua t io n re s e rv e s :
b) o ther
a) fro m pro fits
R e s e rv e s :
S ha re pre m ium re s e rv e
-
1,098,431
a) o rdinary shares
b) o ther shares
1,098,431
S ha re c a pit a l:
B a la nc e a s
a t 3 1.12 .12
Statement of changes in consolidated shareholders' equity
consolidated
financial
statements
CONSOLIDATED
EXPLANATORY NOTES
Banca popolare dell’Emilia Romagna
Banking Group
85
consolidated
explanatory
notes
Form and content of the consolidated interim report as at 30 September
2013
pag. 89 Information on the consolidated balance sheet
pag. 99 Information on the consolidated income statement
pag. 127 Information on risks and related hedging policy
pag. 141 Information on consolidated shareholders' equity
pag. 145 Information on business combinations
pag. 157 Key to abbreviations in tables:
FV:
Fair value
FV*: Fair value excluding variations due to changes in the credit worthiness of the issuer since the issue date
NV:
Nominal or notional value
BV:
Book value
L1:
Fair value hierarchy - Level 1
L2:
Fair value hierarchy - Level 2
L3:
Fair value hierarchy - Level 3
#:
not applicable
87
FORM AND CONTENT OF THE CONSOLIDATED
INTERIM REPORT AS AT 30 SEPTEMBER 2013
consolidated
explanatory
notes
89
1 Introduction
consolidated
explanatory
notes
The consolidated quarterly report as at 30 September 2013 ("the report") of the Banca popolare
dell'Emilia Romagna Group has been prepared in compliance with art. 154-ter of the Consolidated
Finance Act ("CFA" - Decree 58 of 24 February 1998 and subsequent amendments).
2 Declaration of compliance with International Financial Reporting Standards
The figures contained in the report have been determined in accordance with the accounting rules
set by the IAS/IFRS endorsed by the European Commission under the procedure referred to in
art. 6 of EC Regulation 1606/2002 and already used in the preparation of the consolidated
financial statements as at 31 December 2012 and in the consolidated interim financial report at 30
June 2013, as well as by the IAS/IFRS that became mandatory from 2013, which are shown in the
following table.
In any case, this document does not constitute an "interim financial report" as intended by
International Accounting Standard (IAS) 34.
90
EC Approval
Regulation
475/2012
Title
In force from years
beginning
Amendments to IAS 1 - Presentation of Items of Other
Comprehensive Income
1 July 2012
consolidated
explanatory
notes
The amendments are intended to clarify the presentation of the
increasing number of items of other comprehensive income and to
help users of financial statements to distinguish between those that
may and those that may not be subsequently reclassified to profit
and loss.
475/2012
Amendments to IAS 19 - Employee Benefits
1 January 2013
These changes should help users of financial statements to
understand better how defined-benefit plans affect the company's
financial position, results of operations and cash flows.
1255/2012
Amendments to IFRS 1, IAS 12, IFRS 13 and IFRIC 20
1 January 2013
The objective of the amendments to IFRS 1 is to enable entities that
have been subject to severe hyperinflation to use fair value as the
deemed cost of their assets and liabilities in the opening statement of
financial position prepared in accordance with IFRS. The objective of
the amendments to IAS 12 is to clarify that the carrying amount of
investment property measured on the basis of the fair value model
would be recovered through its sale and an entity would be required
to use the tax rate applicable to the sale of the underlying asset.
IFRS 13 establishes a single IFRS framework for measuring fair
value; it is to be applied when another IFRS requires or permits fair
value measurements or requires disclosures about fair value
measurements.
The objective of IFRIC 20 is to provide guidance on the recognition
of certain types of costs during the production phase of an opencast
mine.
1256/2012
Amendments to IFRS 7 Financial Instruments: Disclosures Offsetting Financial Assets and Financial Liabilities
1 January 2013
The purpose of these changes is to prescribe additional quantitative
information to help users compare and reconcile information under
IFRS and those resulting from the application of American Generally
Accepted Accounting Principles (US GAAP).
183/2013
Amendments to IFRS 1 First-time Adoption of International
Financial Reporting Standards - Government Loans
1 January 2013
These amendments relate to government loans at an interest rate
that is lower than the market. The aim is to exempt first-time
adopters of IFRS from full retrospective application of the relevant
provisions during the transition to IFRS.
301/2013
Improvements to IFRS - 2009-2011 Cycle
1 January 2013
The objective of these Improvements is to deal with inconsistencies
in IFRSs on topics that are not particularly urgent.
91
consolidated
explanatory
notes
The following table shows the new international accounting standards or amendments to
standards already in force, whose application is mandatory from 1 January 2014 or later date (if
the financial statements do not coincide with the calendar year). The Group has decided not to
take advantage of the possibility of early implementation.
EC Approval
Regulation
1254/2012
Title
In force from years
beginning
Regulation that adopts IFRS 10, IFRS 11, IFRS 12, IAS 27 and
IAS 28
1 January 2014
The objective of IFRS 10 is to provide a single model for the
consolidated financial statements. This new standard replaces IAS
27 Consolidated and Separate Financial Statements and SIC 12 Special Purpose Entities (aka "special purpose vehicles"). IFRS 11
establishes principles for financial reporting by entities that are party
to joint control arrangements and replaces IAS 31 Interests in Joint
Ventures and SIC-13 Jointly Controlled Entities - Non-Monetary
Contributions by Venturers. IFRS 12 combines, enhances and
replaces the disclosure requirements for subsidiaries, joint
arrangements, associates and unconsolidated structured entities. As
a result of these new IFRS, the IASB also issued IAS 27 Revised
and IAS 28 Revised.
1256/2012
Amendments to IAS 32 Financial Instruments: Presentation Offsetting Financial Assets and Financial Liabilities.
1 January 2014
The changes to IFRS 7 also resulted in amendments to IAS 32,
providing additional guidance so as to reduce inconsistencies in the
practical application of the Standard
313/2013
Guide to transitional provisions (Amendments to IFRS 10, 11 and
12).
The amendments provide for a simpler transition to IFRS 10, IFRS
11 and IFRS 12, limiting the requirement to provide adjusted
comparative information only to the previous comparative period. In
addition, for information relating to structured entities that are not
consolidated, the amendments suppress the requirement to present
comparative information for periods prior to the date on which IFRS
12 is applied for the first time.
92
1 January 2014
3 General policies
This report consists of the consolidated balance sheet, the consolidated income statement, the
statement of consolidated comprehensive income and the statement of changes in consolidated
shareholders' equity, as well as the consolidated explanatory notes and the information on
operations. The schedules provide comparative figures from the balance sheet as at 31
December 2012 and from the income statement as at 30 September 2012.
consolidated
explanatory
notes
The schedules and the rules governing their preparation comply with the updated version of
Circular no. 262/2005, issued by the Bank of Italy on 18 November 2009 and published in the
Gazzetta Ufficiale no. 238 on 21 December 2009.
Unless stated otherwise, the amounts shown in the financial statements and explanatory notes
are expressed in thousands of Euro.
The balance sheet, income statement and statement of changes in shareholders' equity of Banca
popolare dell'Emilia Romagna s.c., the Parent Company, are provided in attachments to this
report. The report also includes pro-forma schedules following the mergers:
of the three Banks of Central Italy (CARISPAQ, BPLS and BPA) completed on 27 May
2013, for the balance sheet and income statement;
of the subsidiaries Em.Ro. popolare and Meliorbanca completed on 24 September 2012
and 26 November 2012 respectively, only for their income statement aggregates.
The general principles adopted for the preparation of the quarterly report, the consolidation
principles and the accounting policies applied in the phases of recognition, classification,
measurement and derecognition of assets and liabilities, as well as the bases for recognising
revenues and costs, are the same as those reported in Part A of the Notes to the 2012
consolidated financial statements.
93
4 Scope of consolidation and methodology
consolidated
explanatory
notes
Investments in subsidiaries and companies under joint control (consolidated on a
proportional basis)
Head
office
Name of the company
Type of
relationship
(a)
Share
capital in
Euro
Nature of holding
Parent
company
% held
Voting
rights
(b)
A. Companies included
in consolidation
A.1 Companies consolidated
line-by-line
1. Banca Popolare di Ravenna
s.p.a.
2. Banca Popolare del
Mezzogiorno
s.p.a.
3. Banca della Campania s.p.a.
4. Banco di Sardegna s.p.a.
5. Banca di Sassari s.p.a.
Ravenna
1
54,408,227
B.P.E.R.
86.965
Crotone
1
134,970,564
B.P.E.R.
96.772
Naples
1
83,223,210
B.P.E.R.
99.273
Cagliari
1
155,247,762
B.P.E.R.
50.391
Sassari
1
74,458,607
B. Sard.
79.722
B.P.E.R.
17.972
6. Cassa di Risparmio di Bra
s.p.a.
7. Banca pop. Em. Rom.
(Europe) Int. s.a.
Bra
1
27,300,000
B.P.E.R.
67.000
Luxembourg
1
30,667,500
B.P.E.R.
99.000
8. EMRO Finance Ireland ltd.
Dublin
1
155,000
B.P.E.R.
100.000
9. Nadia s.p.a.
Modena
1
87,000,000
B.P.E.R.
100.000
10. BPER Services s.cons.p.a.
Modena
1
10,920,000
B.P.E.R.
92.838
B. Sard.
4.762
B.S.S.
0.400
B.P.R.
0.400
B.d.C.
0.400
B.P.Mezz.
0.400
Optima
0.400
B.P.R.
Sardaleasing
94
1.000
0.400
11. Sardaleasing s.p.a.
Sassari
1
51,650,000
B.P.E.R.
5.000
12. Optima s.p.a. S.I.M.
Modena
1
13,000,000
B.P.E.R.
100.000
13. Tholos s.p.a.
Sassari
1
17,015,995
B. Sard.
100.000
14. Numera s.p.a.
Sassari
1
2,065,840
B. Sard.
100.000
15. Mutina s.r.l.
Modena
1
10,000
B.P.E.R.
100.000
16. Nettuno Gestione Crediti
s.p.a.
17. Modena Terminal s.r.l.
Bologna
1
1,500,000
B.P.E.R.
100.000
Campogalliano
1
8,000,000
B.P.E.R.
100.000
18. Emilia Romagna Factor s.p.a.
Bologna
1
36,393,940
B.P.E.R.
60.710
19. ABF Leasing s.p.a.
Milan
1
7,800,000
B.P.E.R.
100.000
B. Sard.
91.162
51.000
Name of the company
Head
office
Type of
Relationship
(a)
Share
capital in
Euro
Nature of holding
Parent
company
% held
20. Immobiliare Reiter s.p.a.
Modena
1
900,000
Nadia
100.000
21. Galilei Immobiliare s.r.l.
Modena
1
100,000
Nadia
100.000
22. Melior Valorizzazioni Immobili
s.r.l.
23. Estense Covered Bond s.r.l.
Milan
1
10,000
B.P.E.R.
100.000
Conegliano
1
10,000
B.P.E.R.
60.000
24. BPER Trust Company s.p.a.
Modena
1
500,000
B.P.E.R.
100.000
25. Polo Campania s.r.l.
Naples
1
110,000
B.d.C.
100.000
26. Sarda Vibrocementi s.r.l.
Sassari
1
1,954,535
B.P.E.R.
100.000
27. Italiana Valorizzazioni
Immobiliari s.r.l.
Milan
1
2,000,000
B.P.E.R.
100.000
Voting
rights
(b)
consolidated
explanatory
notes
A.2 Consolidated on a
proportional basis
Key:
(a)
Type of relationship:
1
Majority of votes at the ordinary shareholders' meeting
(b)
Voting rights at ordinary shareholders' meeting, distinguishing between actual and potential.
Consolidation principles
This document is the result of consolidating the interim reports of the Banks and Companies
making up the Group or, in any case, under its control. No interim report has been prepared for
Polo Campania s.r.l. and Italiana Valorizzazioni Immobiliari s.r.l. as they were formed recently and
are not yet operational.
For consolidation purposes we used the reports prepared in accordance with IAS/IFRS by the
individual banks and financial companies subject to Bank of Italy supervision, as well as by
Em.Ro. Finance Ireland. All of the other Group companies that are subject to local accounting
principles have had to prepare accounting schedules with figures restated in accordance with
IAS/IFRS.
As regards the companies in which a significant interest is held (20% or more), for Cassa di
Risparmio di Savigliano s.p.a., Cassa di Risparmio di Fossano s.p.a., Cassa di Risparmio di
Saluzzo s.p.a., Banca della Nuova Terra s.p.a. and Alba Leasing s.p.a. their half-year accounts at
30 June 2013 have been used, when available; otherwise, the annual financial statements at 31
December 2012, the latest ones to be approved, have been used.
95
5 Subsequent events
consolidated
explanatory
notes
This report was approved on 12 November 2013 by the Board of Directors of Banca popolare
dell’Emilia Romagna.
Reference is made to the detailed information provided in the “Significant subsequent events and
outlook for operations” section of the Group interim report on operations.
6 Other information
Bank of Italy Circulars and other documents of the Supervisory Authority
On 15 January 2013, the Bank of Italy issued a technical note that stressed the importance of
transparency of information on disposals of financial instruments.
It is also worth noting the document issued jointly by the Bank of Italy/CONSOB/IVASS no. 6
dated 8 March 2013 on the "Accounting treatment of term structured repos” (transactions
involving a purchase of securities, a hedging derivative and a repurchase agreement).
Application of this standard requires careful assessment by management of the specific
characteristics of the transactions carried out, especially when they involve complex operations
such as those mentioned in this document.
The Authorities are of the opinion that management has to carefully consider the purposes
underlying the combination of contractual arrangements that make up term structured repo
transactions, even if formally they are considered separate elements, in order to decide on the
most appropriate accounting treatment.
In practice, if management concludes that the conditions of paragraph B.6, IAS 39, Guidance on
Implementing, do not apply, each of the individual components of the contract has to be
recognised separately.
With this document, the Bank of Italy/CONSOB/IVASS draw the attention of the members of
management and supervisory boards and of managers responsible for preparing financial reports
on the need to ensure adequate and complete information on term structured repos as regards
their presentation, impact on the results and financial position, including pro-forma figures, and
the underlying risks and related management strategies. The Group has not carried out any such
transactions as of 30 September 2013.
On 18 June 2013 the Bank of Italy issued Circular no. 284 “Archive of historically registered
losses on default positions”. This circular provides for the creation of an archive for the collection
of data on loan recoveries by regulated intermediaries (banks and financial entities) that makes it
possible to calculate loss rates historically recorded on loans in default (commonly known as
"LGD reporting"). The creation of such an archive is linked to the new accounting model for
impairment being defined by the IASB, which will replace the current one based on incurred
losses in accordance with IAS 39.
The report also serves as a source of information for the Supervisory Authority on intermediaries
who adopt or intend to adopt the advanced internal models to calculate capital requirements for
credit risk (AIRB), with particular reference to the determination of the rate of loss given default
(LGD).
On 7 August 2013, the Supervisory Authority sent a note setting out the operative implications for
financial intermediaries as a result of the matters set out in the Exposure Draft "Financial
96
Instruments: Expected Credit Losses" published by the IASB on 13 March 2013, which contains a
proposal for a new accounting model for the calculation of value adjustments to receivables
based on "expected losses" rather than "incurred losses".
The proposed model provides for the classification of financial instruments to which it applies in
three functional classes to reflect the progressive increase in credit impairments consistent with
the process of deterioration of the quality of debtors with respect to the starting moment and to
which the different methods of measuring impairment losses correspond. Correct application of
the model therefore requires intermediaries to trace the history of each financial instrument in
order to handle transfers from one class to another properly. During initial adoption of the model it
is also expected that if application of the classification criteria of the stock of financial assets
existing in the various classes is particularly onerous, reference should be made to the credit
quality of the receivables at the date of valuation.
The Bank of Italy notes that the new rules present aspects of operational complexity for
intermediaries and how, if confirmed, the ability of intermediaries to reconstruct the evolution of
the credit quality of financial instruments with respect to the time they were granted ("purchase")
can affect, even quite significantly, the amount of new value adjustments required, particularly on
first-time application of the model.
consolidated
explanatory
notes
On 12 September 2013, the Supervisory Authority made Circular no. 262/2005 "Banks' financial
statements: layout and preparation" available for a 60-day consultation.
Audit
The report is not subject to a formal review by the auditors PricewaterhouseCoopers s.p.a., but
only to routine accounting checks.
97
INFORMATION ON THE CONSOLIDATED BALANCE
SHEET
consolidated
explanatory
notes
99
ASSETS
consolidated
explanatory
notes
Financial assets held for trading
Caption 20
2.1 Financial assets held for trading: breakdown by sector
Description/Amounts
30.09.2013
L1
L2
31.12.2012
L3
L1
L2
L3
A. Cash assets
1. Debt securities
1.1 Structured securities
1.2 Other debt securities
2. Equities
3. UCITS units
4. Loans
4.1 Repurchase agreements
4.2 Other
Total A
B. Derivatives
1. Financial derivatives
1.1 Trading
1.2 Connected with the fair
value option
1.3 Other
2. Credit derivatives
2.1 Trading
2.2 Connected with the fair
value option
2.3 Other
Total B
Total A+B
568,704
271,852
46,516
926,796
317,322
113
1
1,572
-
2,081
880
-
568,703
270,280
46,516
924,715
316,442
113
20,381
31,164
-
1
-
-
12,603
28,257
-
-
8
-
-
-
-
-
-
-
-
-
-
-
-
-
620,249
271,853
46,516
967,656
317,322
121
7,243
172,911
40,712
6,282
255,641
49,026
7,243
68,690
40,712
6,282
96,363
49,026
-
104,221
-
-
159,278
-
-
-
-
-
-
-
-
-
-
-
-
-
-
-
-
-
-
-
-
-
-
-
-
-
-
-
-
-
-
-
7,243
172,911
40,712
6,282
255,641
49,026
627,492
444,764
87,228
973,938
572,963
49,147
The financial derivatives connected with the fair value option are mainly associated with debt securities classified
as financial liabilities designated at fair value through profit and loss (liability caption 50).
Impaired cash assets (€ 1 thousand) relate to securities issued by a company of the Lehman Brothers Group.
100
2.2 Financial assets held for trading: breakdown by issuer/borrower
Description/Amounts
A. Cash assets
1. Debt securities
a) Governments and Central Banks
b) Other public entities
c) Banks
d) Other issuers
2. Equity instruments
a) Banks
b) Other issuers
- insurance companies
- financial companies
- non-financial companies
- other
3. UCITS units
4. Loans
a) Governments and Central Banks
b) Other public entities
c) Banks
d) Other parties
Total A
B. Derivative instruments
a) Banks
- fair value
b) Customers
- fair value
Total B
Total (A+B)
30.09.2013
31.12.2012
887,072
1,244,231
541,223
21
310,137
35,691
759,370
23
20,382
12,603
4,338
16,044
1,844
10,759
1,526
1,700
consolidated
explanatory
notes
413,794
71,044
26
338
14,492
8,721
-
-
31,164
28,265
-
-
-
-
-
-
-
-
-
-
938,618
1,285,099
146,216
211,558
146,216
211,558
74,650
99,391
74,650
99,391
220,866
310,949
1,159,484
1,596,048
101
Financial assets designated at fair value through profit and loss
Caption 30
consolidated
explanatory
notes
3.1 Financial assets designated at fair value through profit and loss: breakdown by sector
30.09.2013
Description/Amounts
1. Debt securities
1.1 Structured securities
1.2 Other debt securities
2. Equity instruments
3. UCITS units
4. Loans
4.1 Structured
4.2 Other
L1
L2
38,964
38,964
1,906
64,237
-
35,278
4,158
31,120
1,051
-
31.12.2012
L3
L1
L2
340
340
3,897
6,246
-
42,504
42,504
2,211
60,547
-
34,563
4,464
30,099
1,014
-
L3
327
327
3,812
6,472
-
Total
105,107
36,329
10,483
105,262
35,577
10,611
Cost
96,895
38,604
13,538
100,907
40,436
14,683
Financial assets designated at fair value through profit and loss: use of the fair value
option
Description
a) Natural hedges using derivatives
b) Natural hedges using other financial instruments
c) Other cases of accounting mismatches
d) Financial instruments managed and measured at fair value
e) Structured products with embedded derivatives
Total
102
30.09.2013
35,059
112,702
4,158
151,919
3.2 Financial assets designated at fair value through profit and loss: breakdown by
borrower/issuer
Description/Amounts
1. Debt securities
a) Governments and Central Banks
b) Other public entities
c) Banks
d) Other issuers
2. Equity instruments
a) Banks
b) Other issuers:
- insurance companies
- financial companies
- non-financial companies
- other
3. UCITS units
4. Loans
a) Governments and Central Banks
b) Other public entities
c) Banks
d) Other parties
Total
30.09.2013
31.12.2012
74,582
77,394
29,629
23,965
20,988
29,767
26,632
20,995
5,803
6,023
967
4,836
1,183
4,840
-
24
-
-
4,836
4,816
-
-
71,534
68,033
-
-
-
-
-
-
-
-
-
-
151,919
151,450
consolidated
explanatory
notes
103
Financial assets available for sale
Caption 40
consolidated
explanatory
notes
4.1 Financial assets available for sale: breakdown by sector
Description/Amounts
30.09.2013
L1
L2
31.12.2012
L3
L1
L2
L3
1. Debt securities
5,109,096
295,885
11,116
3,835,957
351,385
292
1.1 Structured securities
1.2 Other debt securities
2. Equity instruments
2.1 Valued at fair value
5,109,096
8,802
8,802
295,885
-
11,116
439,519
317,116
3,835,957
6,811
351,385
603
292
456,432
3,966
-
-
122,403
47,427
-
6,811
4,290
603
-
330,702
125,730
23,632
-
-
-
5,121,864
295,885
498,062
3,847,058
351,988
480,356
2.2 Valued at cost
3. UCITS units
4. Loans
Total
Financial assets available for sale are measured at fair value on the basis described in Part A of the explanatory
notes in the 2012 consolidated financial statements.
Debt securities mainly relate to investments made in government bonds with the aim of returning to a more
balanced asset sensitivity structure.
Equity instruments are represented by stable equity investments.
The UCITS units consist of closed-end investment and real estate funds.
4.2 Financial assets available for sale: breakdown by borrower/issuer
Description/Amounts
30.09.2013
31.12.2012
5,416,097
4,187,634
4,769,384
505,500
141,213
3,701,802
449,473
36,359
2.Equity instruments
448,321
463,846
a) Banks
b) Other issuers:
234,035
214,286
228,715
235,131
- insurance companies
62,809
76,829
- financial companies
83,563
95,222
- non-financial companies
67,729
62,633
1. Debt securities
a) Government and Central Banks
b) Other public entities
c) Banks
d) Other issuers
- other
3. UCITS units
4. Loans
a) Government and Central Banks
b) Other public entities
c) Banks
d) Other parties
Total
104
185
447
51,393
27,922
-
-
-
-
5,915,811
4,679,402
4.3 Micro-hedged financial assets available for sale
1. Financial assets covered by specific fair value hedges
a) Interest rate risk
b) Price risk
c) Foreign exchange risk
d) Credit risk
e) Multiple risks
2. Financial assets covered by specific cash flow hedges
a) Interest rate risk
b) Foreign exchange risk
c) Other
Total
30.09.2013
31.12.2012
-
-
-
-
-
-
370,775
370,775
-
310,389
310,389
-
370,775
310,389
consolidated
explanatory
notes
105
Financial assets held to maturity
Caption 50
consolidated
explanatory
notes
5.1 Financial assets held to maturity: breakdown by sector
30.09.2013
FV
L1
L2
BV
1. Debt securities
- Structured
securities
- Other
1,203,539 1,124,257
L3
127,252
31.12.2012
FV
L1
L2
BV
-
818,050
683,480
L3
187,048
-
-
-
-
-
-
-
-
-
1,203,539
1,124,257
127,252
-
818,050
683,480
187,048
-
-
-
-
-
-
-
-
-
2. Loans
Key:
FV = fair value
BV = book value
5.2 Financial assets held to maturity: breakdown by issuer/borrower
Type of transaction/Amounts
1. Debt securities
a) Governments and Central Banks
b) Other public entities
c) Banks
d) Other issuers
2. Loans
a) Governments and Central Banks
b) Other public entities
c) Banks
d) Other entities
106
30.09.2013
31.12.2012
1,203,539
818,050
817,933
374,919
10,687
410,503
394,315
13,232
-
-
-
-
-
-
-
-
-
-
Total
1,203,539
818,050
Total fair value
1,251,508
870,528
Due from banks
Caption 60
6.1 Due from banks: breakdown by sector
Type of transaction/Amounts
30.09.2013
31.12.2012
354,329
354,329
-
213,130
213,130
-
1,347,850
235,531
541,830
292,336
2,037,651
410,352
583,745
356,652
57,020
162,051
A. Due from Central Banks
1. Restricted deposits
2. Reserve requirement
3. Repurchase agreements
4. Other
B. Due from banks
1. Current accounts and demand deposits
2. Restricted deposits
3. Other loans
3.1. Repurchase agreements
3.2 Finance leases
63
75
235,253
194,526
278,153
686,902
3.3 Other
4. Debt securities
4.1 Structured securities
-
-
4.2 Other debt securities
278,153
686,902
1,702,179
2,250,781
Total (book value)
consolidated
explanatory
notes
Loans to customer
Caption 70
7.1 Loans to customers: breakdown by sector
Type of transaction/
Amounts
1. Current accounts
2. Repurchase
agreements
3. Mortgage loans
4. Credit cards, personal
loans and assignments
of one-fifth of salary
5. Finance leases
6. Factoring
7. Other loans
8. Debt securities
8.1 Structured
securities
8.2 Other debt
securities
Total (book value)
30.09.2013
31.12.2012
Doubtful loans
Performing
loans
Purchased
6,783,625
-
10,181
22,443,232
Doubtful loans
Performing
loans
Purchased
1,178,336
7,135,672
-
957,190
-
3,382,446
104,564
22,665,829
-
2,600,408
1,294,741
2,388,306
610,645
6,867,785
259,988
-
74,930
579,045
41,397
1,291,397
1,422
1,366,676
2,592,884
694,260
7,995,843
292,394
-
56,127
514,402
67,295
1,003,779
1,412
-
-
-
-
-
-
Other
Other
259,988
-
1,422
292,394
-
1,412
40,658,503
-
6,548,973
42,848,122
-
5,200,613
The sub-caption “Other loans” of performing loans includes € 3,069 million of bullet loans, € 2,283 million of
advances on invoices subject to collection, € 871 million of import/export advances, € 167 million of credit
assignment and € 478 million of other miscellaneous entries.
107
7.2 Loans to customers: breakdown by issuer/borrower
Type of
transaction/Values
consolidated
explanatory
notes
1. Debt securities:
a) Governments
b) Other public
entities
c) Other issuers
- non-financial
companies
- financial
companies
- insurance
companies
- other
2. Loans to
a) Governments
b) Other public
entities
c) Other parties
- non-financial
companies
- financial
companies
- Insurance
companies
- other
Total
30.09.2013
Doubtful loans
Performing
loans
Purchased
Other
Performing
loans
31.12.2012
Doubtful loans
Purchased
Other
259,988
-
-
1,422
-
292,394
-
-
1,412
-
7,924
252,064
-
1,422
7,986
284,408
-
1,412
-
-
860
-
-
845
134,590
-
562
168,239
-
567
114,536
2,938
-
-
116,169
-
-
-
40,398,515
-
6,547,551
42,555,728
-
5,199,201
1,495,112
-
-
1,451,361
-
-
467,083
38,436,320
-
8,067
6,539,484
485,008
40,619,359
-
3,162
5,196,039
25,987,368
-
5,608,597
28,191,025
-
4,388,767
2,436,070
-
152,802
2,614,321
-
117,113
5,618
10,007,264
-
778,085
6,255
-
-
9,807,758
-
690,159
40,658,503
-
6,548,973
42,848,122
-
5,200,613
7.3 Loans to customers: hedged assets
1. Loans subject to micro-hedging of fair value
a) Interest rate risk
b) Price risk
c) Foreign exchange risk
d) Credit risk
e) Other risks
2. Loans subject to micro-hedging of cash flow
a) Interest rate risk
b) Foreign exchange risk
c) Other
Total
108
30.09.2013
31.12.2012
24,854
24,173
24,854
-
24,173
-
-
-
24,854
24,173
Hedging derivatives
Caption 80
consolidated
explanatory
notes
8.1 Hedging derivatives: breakdown by type and level
FV
L1
30.09.2013
L2
A. Financial derivatives
FV
NV
L3
31.12.2012
L1
L2
NV
L3
-
2,381
-
90,005
-
-
-
-
1) Fair value
-
2,228
-
82,505
-
-
-
-
2) Cash flows
3) Foreign
investments
-
153
-
7,500
-
-
-
-
-
-
-
-
-
-
-
-
B. Credit derivatives
-
-
-
-
-
-
-
-
1) Fair value
-
-
-
-
-
-
-
-
2) Cash flows
-
-
-
-
-
-
-
-
-
2,381
-
90,005
-
-
-
-
Total
The cash flow hedge agreements will expire in 2015
Key:
NV = nominal value
L1 = Level 1
L2 = Level 2
L3 = Level 3
8.2 Hedging derivatives: breakdown by hedged portfolio and type of hedge (book value)
Fair value
Cash flows
Foreign investments
Operation/Type of hedge
1. Financial assets
available for sale
2. Loans
3. Financial assets held
to maturity
4. Portfolio
5. Other operations
Total assets
1. Financial liabilities
2. Portfolio
Total liabilities
1. Expected
transactions
2. Portfolio of financial
assets and liabilities
Macro-hedge
Specific
Macro-hedge
Multiple risks
Price risk
Credit risk
Exchange risk
Interest rate risk
Specific
-
-
-
-
-
-
153
-
-
-
-
-
-
-
-
-
-
-
-
-
-
-
-
-
-
-
-
-
-
-
-
-
-
-
153
-
2,228
-
-
-
-
-
-
-
-
-
-
-
-
-
-
-
-
-
2,228
-
-
-
-
-
-
-
-
-
-
-
-
-
-
-
-
-
-
-
-
-
-
-
-
-
-
109
Remeasurement of hedged assets backed by general hedges
Caption 90
consolidated
explanatory
notes
9.1 Remeasurement of hedged assets: breakdown by hedged portfolio
Type of transaction/Amounts
1. Positive adjustment
1.1 of specific portfolios:
a) loans
b) financial assets available for sale
1.2 general adjustment
2. Negative adjustment
2.1 specific portfolios:
a) loans
b) financial assets available for sale
2.2 general adjustment
Total
110
30.09.2013
31.12.2012
-
1,060
1,060
-
1,060
-
-
-
-
-
-
-
-
-
-
-
-
-
1,060
Property, plant and equipment
Caption 120
consolidated
explanatory
notes
12.1 Property, plant and equipment: breakdown of assets valued at cost
Description/Amounts
30.09.2013
31.12.2012
1.1 Owned
724,617
739,766
a) land
169,603
171,571
b) buildings
475,376
483,630
c) furniture
36,434
36,749
d) electronic systems
19,284
21,449
e) other
23,920
26,367
4,258
4,360
A. Assets used in business
1.2 Purchased under finance leases
a) land
-
-
4,246
4,339
c) furniture
-
-
d) electronic systems
-
-
12
21
Total A
B. Investment property
728,875
744,126
2.1 Owned
249,107
240,091
a) land
84,914
80,842
164,193
159,249
-
-
a) land
-
-
b) buildings
-
-
Total B
249,107
240,091
Total (A+B)
977,982
984,217
b) buildings
e) other
b) buildings
2.2 Purchased under finance leases
111
12.3 Property, plant and equipment used for business purposes: change in the period
0
consolidated
explanatory
notes
0
Buildings
0
0
Furniture Electronic
systems
0
Other
0
30.09.2013
A. Opening gross amount
A.1 Total net write-downs
171,571
668,319
170,899
168,376
187,391
1,366,556
-
180,350
134,150
146,927
161,003
622,430
A.2 Opening net amount
171,571
487,969
36,749
21,449
26,388
744,126
2,127
10,184
5,409
3,819
5,300
26,839
2,127
8,801
4,971
3,442
4,896
24,237
2,140
8,922
721
339
1,132
13,254
-
1,210
-
-
-
1,210
-
-
-
-
-
-
-
-
-
-
-
-
-
-
-
-
-
-
b) income statement
B.5 Positive exchange rate
adjustments
B.6 Transfer from properties held
for investment
-
-
-
-
-
-
-
-
-
-
-
-
-
-
-
-
-
-
B.7 Other changes
-
173
438
377
404
1,392
4,095
18,531
5,724
5,984
7,756
42,090
-
1,022
896
252
213
2,383
-
10,999
4,783
5,715
6,448
27,945
100
B Increases
B.1 Purchases
- of which business combinations
B.2 Capitalised improvement
expenditure
B.3 Write-backs
B.4 Positive changes in fair value
posted to:
a) shareholders’ equity
C. Decreases
C.1 Sales
C.2 Depreciation
C.3 Impairment charges posted to:
-
100
-
-
-
-
-
-
-
-
-
b) income statement
C.4 Negative changes in fair value
posted to:
a) shareholders’ equity
-
100
-
-
-
100
-
-
-
-
-
-
-
-
-
-
-
-
b) income statement
C.5 Negative exchange rate
adjustments
C.6 Trasfer to:
-
-
-
-
-
-
a) shareholders’ equity
a) properties held for
investment
b) non-current assets held for
sale
C.7 Other changes
D. Closing net balance
D.1 Total net write-downs
D.2 Closing gross amount
112
0
Land
-
-
-
-
-
-
4,095
6,127
-
-
-
10,222
4,095
6,127
-
-
-
10,222
-
-
-
-
-
-
-
283
45
17
1,095
1,440
169,603
479,622
36,434
19,284
23,932
728,875
-
188,596
144,070
150,286
164,139
647,091
169,603
668,218
180,504
169,570
188,071
1,375,966
12.4 Investment property: change in the period
30.09.2013
Land
Buildings
A. Opening gross amount
80,842
192,123
A.1 Total net write-downs
-
32,874
A.2 Opening net amount
80,842
159,249
5,975
10,093
1,880
2,863
1,880
2,622
B.2 Capitalised improvement expenditure
-
670
B.3 Positive changes in fair value
-
-
B.4 Write-backs
-
8
B. Increases
B.1 Purchases
- of which business combinations
B.5 Exchange gains
-
-
4,095
6,127
-
425
C. Decreases
23
2,524
C.1 Sales
-
130
C.2 Depreciation
-
2,381
C.3 Negative changes in fair value
-
-
C.4 Impairment changes
-
-
C.5 Exchange losses
-
-
C.6 Transfers to other asset portfolios:
-
-
-
-
B.6 Transfers from assets used in business
B.7 Other changes
a) property used in business
b) non-current assets held for sale
C.7 Other changes
D. Closing net balance
D.1 Total net write-downs
-
-
23
13
86,794
166,818
-
32,874
D.2 Closing gross amount
86,794
199,692
E. Measured at fair value
80,711
183,131
consolidated
explanatory
notes
Depreciation is calculated with reference to the estimated useful lives of the assets concerned,
commencing from when they enter into service. The useful lives of the principal categories of
property, plant and equipment are summarised below.
Category
Useful life
Land
Buildings
Office furniture and machines
Furnishings
Lifting equipment
Motor vehicles
Alarm systems
IT hardware
not depreciated
based on the useful lives identified from specific appraisals
100 months
80 months
160 months
48 months
40 months
60 months
113
Intangible assets
Caption 130
consolidated
explanatory
notes
13.1 Intangible assets: breakdown by type
Description/Amounts
30.09.2013
Limited
duration
A.1 Goodwill
31.12.2012
Unlimited
duration
Limited
duration
Unlimited
duration
#
383,045
#
375,935
A.1.1 attributable to the Group
#
383,045
#
375,935
A.1.2 attributable to minority interests
#
-
#
-
92,946
-
91,553
-
92,946
-
91,553
-
23
-
31
-
92,923
-
91,522
-
-
-
-
-
a) Intangible assets generated internally
-
-
-
-
b) Other assets
-
-
-
-
92,946
383,045
91,553
375,935
A.2 Other intangible assets
A.2.1 Carried at cost:
a) Intangible assets generated internally
b) Other assets
A.2.2 Carried at fair value:
Total
"Other intangible assets" include € 17,669 thousand representing the value of the client relationships identified on
final allocation of the purchase price paid at the end of 2008 for the former Unicredit branches; these relationships
are estimated as having a useful life of 18 years.
The remaining "Other intangible assets" mainly comprise applications software measured at cost and amortised on
a straight-line basis over a period that can vary, but not exceeding five years, depending on the degree of
obsolescence.
114
13.2 Intangible assets: change in the period
0
0
Goodwill
0
Other intangible
assets: generated
internally
Lim.
Unilm.
Other intangible
assets: other
Lim.
30.09.2013
Unilm.
A. Opening balance
A.1 Total net write-downs
459,459
51
-
220,601
-
680,111
83,524
20
-
129,079
-
212,623
A.2 Opening net amount
375,935
31
-
91,522
-
467,488
7,110
-
-
17,211
-
24,321
7,110
-
-
17,211
-
24,321
7,109
-
-
266
-
7,375
#
-
-
-
-
-
#
-
-
-
-
-
-
-
-
-
-
-
#
-
-
-
-
-
#
-
-
-
-
-
B.5 Exchange gains
-
-
-
-
-
-
B.6 Other changes
-
-
-
-
-
-
-
8
-
15,810
-
15,818
-
-
-
-
-
-
-
8
-
15,810
-
15,818
#
8
-
15,810
-
15,818
B Increases
B.1 Purchases
- of which business combinations
B.2 Increases in intangible
assets generated internally
B.3 Write-backs
B.4 Positive changes in fair
value
- posted to shareholders’
equity
- posted to income statement
C. Decreases
C.1 Sales
C.2 Adjustments
- Amortisation
- Write-downs
-
-
-
-
-
-
#
-
-
-
-
-
-
-
-
-
-
-
#
-
-
-
-
-
#
-
-
-
-
-
#
-
-
-
-
-
C.4 Transfer to non-current
assets held for sale
#
-
-
-
-
-
C.5 Exchange losses
#
-
-
-
-
-
C.6 Other changes
#
-
-
-
-
-
383,045
23
-
92,923
-
475,991
83,522
-
-
137,791
-
221,313
466,567
23
-
230,714
-
697,304
+ shareholders’ equity
+ posted to income
statement
C.3 Negative changes in fair
value
- posted to shareholders’
equity
- income statement
D. Closing net balance
D.1 Total net value adjustments
E. Closing gross amount
consolidated
explanatory
notes
All intangibile assets are stated at cost
Key:
Lim.: finite useful life
Unlim.: indefinite useful life
115
13.3 Other information
13.3.1 Goodwill
consolidated
explanatory
notes
The goodwill arising during the period and that already recorded in the financial statements are
summarised in the following table:
Goodwill
1. Group companies
1.1 Banks
31.12.2012
352,401
158,615
345,291
6,876
6,124
51,346
82,256
4,904
7,109
176,788
6,876
6,124
51,346
82,256
4,904
1,655
10,150
13,477
-
1.2 Parent Company BPER
185,358
160,075
- Purchase of UNICREDIT branches
- Meliorbanca s.p.a.
- Banca CRV - Cassa di Risparmio di Vignola s.p.a.
- Banca Popolare di Lanciano e Sulmona s.p.a. (*)
- Banca Popolare di Aprilia s.p.a. (*)
- CARISPAQ - Cassa di Risparmio dell'Aquila s.p.a. (*)
53,118
104,685
2,273
1,655
10,150
13,477
53,118
104,685
1.3 Other companies
8,428
8,428
- ABF Leasing s.p.a.
- Emilia Romagna Factor s.p.a.
- Estense Covered Bond s.r.l.
1,657
6,769
2
1,657
6,769
2
30,644
112
30,532
30,644
112
30,532
383,045
375,935
- Banca Popolare di Ravenna s.p.a.
- Banca Popolare del Mezzogiorno s.p.a.
- Banca della Campania s.p.a.
- Banco di Sardegna s.p.a.
- Banca di Sassari s.p.a.
- Banca Popolare di Lanciano e Sulmona s.p.a. (*)
- Banca Popolare di Aprilia s.p.a. (*)
- CARISPAQ - Cassa di Risparmio dell'Aquila s.p.a. (*)
- Cassa di Risparmio di Bra s.p.a.
2. Other goodwill
- Leasinvest s.p.a. business segment
- Purchase of UNICREDIT branches
Total
(*) absorbed by BPER on 27 May 2013.
116
30.09.2013
2,272
-
Non-current assets and disposal groups held for sale and
associated liabilities
Asset caption 150 and liability caption 90
consolidated
explanatory
notes
15.1 Non-current assets and disposal groups classified as held for sale: breakdown by
asset type
30.09.2013
31.12.2012
A. Individual assets
A.1 Financial assets
A.2 Equity investments
A.3 Property, plant and equipment
A.4 Intangible assets
A.5 Other non-current assets
2,817
-
2,980
-
Total A
2,817
2,980
B.1 Financial assets held for trading
B.2 Financial assets designated at fair value through profit and loss
B.3 Financial assets available for sale
B.4 Financial assets held to maturity
B.5 Due from banks
B.6 Loans to customers
B.7 Equity investments
B.8 Property, plant and equipment
B.9 Intangible assets
B.10 Other assets
-
1,026
-
Total B
-
15,349
C.1 Payables
C.2 Securities
C.3 Other liabilities
-
-
Total C
-
-
D. Liabilities associated with groups of assets held for sale
D.1 Due to banks
D.2 Due to customers
D.3 Debt securities in issue
D.4 Financial liabilities held for trading
D.5 Financial liabilities designated at fair value through profit and loss
D.6 Provisions
D.7 Other liabilities
-
8,800
Total D
-
8,800
-
B. Assets groups classified as held for sale
138
6,033
41
66
15
8,030
C. Liabilities associated with individual assets held for sale
Pursuant to IFRS 5, the assets reclassified to this caption are those for which an approved disposal plan was in
place and negotiations with potential buyers were at an advanced stage at the balance sheet date.
For the current quarter, this caption includes a property which is expected to be sold in the coming months.
117
LIABILITIES
consolidated
explanatory
notes
Due to banks
Caption 10
1.1 Due to banks: breakdown by type
Type of transaction/Members of the group
30.09.2013
31.12.2012
1. Due to Central Banks
2. Due to banks
2.1 Current accounts and demand deposits
4,604,235
3,431,300
173,743
4,441,944
2,827,517
31,533
3,174,962
112,105
2,291,208
2,590,858
1,684,864
584,104
606,344
51,062
1,440
8,035,535
7,269,461
Type of transaction/Members of the group
30.09.2013
31.12.2012
1. Current accounts and demand deposits
2. Restricted deposits
3. Loans
25,028,531
3,944,514
2,671,997
23,907,807
4,318,870
3,081,626
3.1 repurchase agreements
1,132,257
1,339,596
3.2 other
1,539,740
1,742,030
859,011
980,185
32,504,053
32,288,488
2.2 Restricted deposits
2.3 Loans
2.3.1 Repurchase agreements
2.3.2 Other
2.4 Payables for commitments to repurchase own equity instruments
2.5 Other payables
Total
422,764
Due to customers
Caption 20
2.1 Due to customers: breakdown by sector
4. Payables for commitments to repurchase own equity instruments
5. Other payables
Total
118
Debt securities in issue
Caption 30
consolidated
explanatory
notes
3.1 Debt securities in issue: breakdown by sector
Type of
security/Amounts
30.09.2013
Book
value
31.12.2012
Fair value
Level 1
Level 2
Fair value
Book
value
Level 3
Level 1
Level 2
Level 3
A. Securities
1. Bonds
1.1 structured
1.2 other
2. Other
securities
2.1 structured
2.2 other
Total
6,252,183
-
- 6,278,371
-
-
6,675,885
-
-
-
-
6,252,183
-
-
6,675,885
196,837
6,472,180
-
3,566,519
-
-
- 3,548,519
-
4,371,901
-
-
- 4,371,901
-
3,566,519
-
-
4,371,901
-
-
9,818,702
6,278,371
3,548,519
- 6,278,371 3,548,519 11,047,786
196,837 6,472,180
-
4,371,901
196,837 6,472,180 4,371,901
Bonds include subordinated bonds issued by the Group totalling € 806,518 thousand, as analysed in table 3.2
below.
The "Level 3" column of point 2.2 reports the nominal value of certificates of deposit, the fair value of which has not
been disclosed since these are short-term transactions.
119
3.2 Analysis of caption 30 "Debt securities in issue": subordinated securities
Book value
30.09.2013
consolidated
explanatory
notes
B.P.E.R. subordinated convertible bond 2.75%, 2001-2013
B.P.R. subordinated convertible bond 3.50%, 2008-2013
B.P.L.S. subordinated convertible bond 4.50%, 2008-2013
Total convertible bonds
B.P.E.R. subordinated convertible bond 3.70%, 2006-2012
Book value
31.12.2012
31,441
9,351
9,113
63,336
8,956
49,905
81,211
8,919
-
196,640
-
196,640
EMTN B.P.E.R. subordinated non-convertible bond floating rate 3-month
Euribor +100 bps, 2006-2016
75,593
75,573
EMTN B.P.E.R. subordinated non-convertible bond floating rate 3-month
Euribor +95 bps, 2007-2017
179,486
211,134
Lower Tier II B.P.E.R. subordinated non-convertible bond floating rate 3month Euribor +130 bps, 2008-2014
39,984
39,909
Lower Tier II B.P.E.R. subordinated non-convertible bond 4.75%, 20122018
404,755
390,179
Lower Tier II B.P.E.R. subordinated non-convertible bond 5.81%, 20132020
12,387
-
Cassa di Risparmio di Bra s.p.a. floating-rate subordinated bond 2008-2015
nom. 10,000,000
9,914
-
Cassa di Risparmio di Bra s.p.a. fixed-rate Lower Tier II subordinated bond
2010-2017 amortising 4%
8,048
-
Cassa di Risparmio di Bra s.p.a. fixed-rate Lower Tier II subordinated bond
2011-2021 amortising nom. 7,000,000
7,160
-
Cassa di Risparmio di Bra s.p.a. subordinated bond 2012-2020 amortising
5.25%
Cassa di Risparmio di Bra s.p.a. floating-rate irredeemable Tier I bond
5,033
10,003
-
BPER (Europe) int. S.a. subordinated non-convertible bond floating rate 6
month Euribor, + 0.50%, 2008-2013
-
25,149
Lower Tier II CARISPAQ subordinated non-convertible bond floating rate,
2010-2020
4,250
4,276
Total expired convertible bonds
Total non-convertible bonds
756,613
746,220
Total bonds
806,518
1,024,071
As shown in the table, the amount of € 40,554 thousand relates to bonds convertible into shares of the Parent
Company, including the convertible bond issued by BPLS (€ 9,113 thousand), while € 9,351 thousand relates to
bonds convertible into shares of other Group banks.
The BPER 3.70% 2006-2012 loan which expired on 31 December 2012, including the interest to be paid, was
repaid almost entirely to customers on 1 January 2013 (the only exception being the conversion of 70 bonds into
the same number of shares with rights from 1 January 2013).
The BPER (Europe) Int. S.a. floating rate 6-mth Euribor +0.50%, 2008-2013 subordinated non-convertible bond
expired on 14 January 2013; Banca popolare dell’Emilia Romagna (Europe) International s.a. then issued a new
Lower Tier II subordinated bond for € 20 million at a fixed rate of 4.80%, which was fully subscribed by the Parent
Company.
The loans issued by CARISPAQ and BPLS have kept their original name even after the merger with BPER.
120
3.3 Analysis of caption 30 "Debt securities in issue": micro-hedged securities
30.09.2013
1. Payables with fair value micro-hedge
a) interest rate risk
b) foreign exchange risk
c) multiple risks
2. Payables with cash flow micro-hedge
a) interest rate risk
b) foreign exchange risk
c) multiple risks
Total
consolidated
explanatory
notes
81,432
81,432
81,432
121
Financial liabilities held for trading
Caption 40
consolidated
explanatory
notes
4.1 Financial liabilities held for trading: breakdown by sector
Type of
transaction/Members
of the group
30.09.2013
NV
FV
L2
L1
31.12.2012
FV*
NV
L3
FV
L2
L1
FV*
L3
A. Cash liabilities
1. Due to banks
-
-
-
-
58
56
-
-
56
25,089
25,836
-
-
-
-
25,836
300
312
-
-
312
-
-
-
-
-
-
-
-
-
-
-
-
-
-
-
-
-
3.1.1 Structured
-
-
-
-
-
#
-
-
-
-
#
3.1.2 Other bonds
-
-
-
-
#
-
-
-
-
#
3.2 Other securities
-
-
-
-
-
-
-
-
-
-
3.2.1 Structured
-
-
-
-
#
-
-
-
-
#
2. Due to customers
3. Debt securities
3.1 Bonds
-
-
-
-
#
-
-
-
-
#
25,089
25,836
-
-
25,836
358
368
-
-
368
3.2.2 Other
Total A
-
B. Derivatives
1. Financial
derivatives
-
58
128,914
41,722
-
-
86
168,941
47,469
-
1.1 For trading
#
58
122,429
41,722
#
#
86
161,900
47,469
#
1.2 Connected with the
fair value option
#
-
6,485
-
#
#
-
7,041
-
#
1.3 Other
#
-
-
-
#
#
-
-
-
#
2. Credit derivatives
-
-
-
-
-
-
-
-
-
-
2.1 For trading
#
-
-
-
#
#
-
-
-
#
2.2 Connected with the
fair value option
#
-
-
-
#
#
-
-
-
#
2.3 Other
#
-
-
-
#
#
-
-
-
#
Total B
#
58
128,914
41,722
#
#
86
168,941
47,469
#
Total (A+B)
#
25,894
128,914
41,722
#
#
454
168,941
47,469
#
The caption "cash liabilities" concerns the balance of "technical shorts" generated by capital market transactions.
The financial derivatives connected with the fair value option are mainly associated with debt securities classified as
financial liabilities designated at fair value through profit and loss (liability caption 50).
Key:
FV = Fair value
FV* = Fair value excluding variations due to changes in the creditworthiness of the issuer since the issue date
NV = Notional or nominal value
L1 = Level 1
L2 = Level 2
L3 = Level 3
122
Financial liabilities designated at fair value through profit and
loss
Caption 50
consolidated
explanatory
notes
5.1 Financial liabilities designated at fair value through profit and loss: breakdown by
sector
Type of
security/Amounts
30.09.2013
31.12.2012
FV
NV
L1
FV
L2
FV*
L3
NV
L1
L2
FV*
L3
1. Due to banks
-
-
-
-
-
-
-
-
-
-
1.1 Structured
-
-
-
-
#
-
-
-
-
#
1.2 Other
-
-
-
-
#
-
-
-
-
#
-
-
-
-
-
-
-
-
-
-
-
-
-
-
#
-
-
-
-
#
-
-
-
-
#
-
-
-
-
#
2. Due to customers
2.1 Structured
2.2 Other
3. Debt securities
3,079,069
3.1 Structured
3.2 Other
Total
-
- 3,143,502
- 3,200,789 3,799,922
- 3,865,649
- 3,974,279
-
-
-
-
#
-
-
#
3,079,069
- 3,143,502
-
# 3,799,922
-
- 3,865,649
-
#
3,079,069
- 3,143,502
- 3,200,789 3,799,922
- 3,865,649
- 3,974,279
The cumulative change in fair value attributable to the change in credit risk amounts to € 57,286 thousand; this
change had a negative effect during the period of € 10,481 thousand.
Key:
FV = Fair value
FV* = Fair value excluding variations due to changes in the credit worthiness of the issuer since the issue date
NV = Nominal or notional value
L1 = Level 1
L2 = Level 2
L3 = Level 3
Financial liabilities designated at fair value through profit and loss: use of the fair value
option
Captions/Amounts
30.09.2013
Due to
banks
Due to
customers
Debt securities
Natural hedges using derivatives
-
-
Natural hedges using other financial instruments
-
-
3,143,502
-
Other accounting mismatches
-
-
-
Financial instruments managed and measured at fair value
-
-
-
Structured products with embedded derivatives
-
-
-
Total
-
-
3,143,502
123
5.2 Analysis of caption 50 "Financial liabilities designated at fair value through profit and
loss": subordinated securities
consolidated
explanatory
notes
124
30.09.2013
31.12.2012
Lower Tier II B.P.E.R. subordinated non-convertible bond 5.20%,
2008-2014
143,059
143,884
Lower Tier II B.P.E.R. subordinated non-convertible bond 5.90%,
2008-2014
41,161
41,417
Lower Tier II B.P.E.R. subordinated
amortizing 5.12%, 2009-2015
10,432
16,039
Lower Tier II B.P.E.R. subordinated non-convertible bond 4.35%,
2010-2017
18,073
17,952
Lower Tier II B.P.E.R. subordinated non-convertible bond 4.94%,
2010-2017
51,556
51,014
Lower Tier II B.P.E.R. subordinated non-convertible bond 4.75%,
2011-2017
571,287
719,654
Total non-convertible bonds
835,568
989,960
Total bonds
835,568
989,960
non-convertible
bond,
Hedging derivatives
Caption 60
consolidated
explanatory
notes
6.1 Hedging derivatives: breakdown by type and by levels
Fair value 30.09.2013
L1
A. Financial
derivatives
L2
Fair value 31.12.2012
NV
L3
L1
L2
NV
L3
-
39,920
-
338,431
-
37,661
-
1) Fair value
-
2,768
-
23,431
-
4,646
-
302,296
37,296
2) Cash flows
3) Foreign
investments
-
37,152
-
315,000
-
33,015
-
265,000
-
-
-
-
-
-
-
-
B. Credit derivatives
-
-
-
-
-
-
-
-
1) Fair value
-
-
-
-
-
-
-
-
2) Cash flows
-
-
-
-
-
-
-
-
-
39,920
-
338,431
-
37,661
-
302,296
Total
The cash flow hedge agreements have the following expiry dates: notional value of € 100 million in 2014 , € 115
million in 2017, € 50 million in 2021 and € 50 million in 2023.
The related cash flows will impact the income statement up to the relevant expiration dates.
Key:
NV = Nominal or notional value
L1 = Level 1
L2 = Level 2
L3 = Level 3
Operation/Type of hedge
Fair value
Foreign investments
6.2 Hedging derivatives: analysis by hedged portfolio and type of hedge
Cash flows
1. Financial assets
available for sale
2. Loans
General
Specific
General
Multiple risks
Price risk
Credit risk
Interest rate
risk
Exchange risk
Specific
-
-
-
-
-
#
37,152
#
#
2,768
-
-
#
-
#
-
#
#
3. Financial assets held to
maturity
#
-
-
#
-
#
-
#
#
4. Portfolio
#
#
#
#
#
-
#
-
#
5. Other operations
-
-
-
-
-
#
-
#
-
Total assets
2,768
-
-
-
-
-
37,152
-
-
1. Financial liabilities
-
-
-
#
-
#
-
#
#
2. Portfolio
#
#
#
#
#
-
#
-
#
Total liabilities
-
-
-
-
-
-
-
-
-
1. Expected transactions
#
#
#
#
#
#
-
#
#
2. Portfolio of financial
assets and liabilities
#
#
#
#
#
-
#
-
-
125
INFORMATION ON THE CONSOLIDATED INCOME
STATEMENT
consolidated
explanatory
notes
127
Interests
Captions 10 and 20
consolidated
explanatory
notes
1.1 Interest and similar income: breakdown
Captions/Technical forms
Debt
securities
Loans
Other
transactions
30.09.2013
30.09.2012
40,551
58,232
61,157
1. Financial assets held for trading
2. Financial assets designated at fair
value through profit and loss
17,681
-
2,213
-
-
2,213
2,530
3. Financial assets available for sale
114,589
-
-
114,589
90,384
33,185
6,880
7,170
#
12,854
1,314,678
#
5,719
33,185
19,734
1,321,848
5,719
18,060
40,212
4. Financial assets held to maturity
5. Due from banks
6. Loans to customers
7. Hedging derivatives
8. Other assets
Total
1,440,448
2,267
#
#
252
252
50
181,718
1,327,532
46,522
1,555,772
1,655,108
Securities
Other
transactions
30.09.2013
30.09.2012
1.4 Interest and similar expense: breakdown
Captions/Technical forms
1. Due to central banks
128
Debts
21,525
#
-
21,525
31,351
2. Due to banks
3. Due to customers
4. Debt securities in issue
5. Financial liabilities held for trading
6. Financial liabilities designated at fair
value through profit and loss
7. Other liabilities and provisions
8. Hedging derivatives
11,153
253,591
#
258
#
#
-
11,153
253,591
19,190
255,029
211,557
-
-
211,557
258
260,999
31
#
#
93,339
#
#
166
-
93,339
166
-
107,693
14
-
Total
286,527
304,896
166
591,589
674,307
Commissions
Captions 40 and 50
consolidated
explanatory
notes
2.1 Commission income: breakdown
Type of service/Amounts
a) Guarantees given
b) Credit derivatives
c) Management, brokerage and consulting services
1. trading in financial instruments
2. trading in foreign exchange
3. asset management
3.1. individual
3.2. collective
4. custody and administration of securities
5. custodian bank
6. placement of securities
7. order taking
8. advisory services
8.1 regarding investments
8.2 regarding financial structuring
9. distribution of third-party services
9.1 asset management
30.09.2013
30.09.2012
28,365
27,730
-
-
127,395
2,038
3,845
14,334
119,764
3,010
14,119
13,523
4,155
13,694
215
171
3,244
49,432
11,437
2,596
3,619
1,850
35,991
10,631
7,176
220
792
2,376
6,384
40,469
1,076
39,638
585
9.1.1. individual
115
-
9.1.2. collective
961
585
16,068
23,325
15,782
23,271
9.2 insurance products
9.3 other products
d) Collection and payment services
100,009
99,355
e) Servicing related to securitisation
1,082
1,158
f) Services for factoring transactions
5,763
7,198
g) Tax collection services
-
-
h) Management of multilateral trading systems
-
-
i) Maintenance and management of current accounts
128,991
124,979
j) Other services
167,980
190,822
- Commission income on other loans to customers
130,870
156,798
- Commission income on cash card services
18,248
17,349
- Other commission income
18,862
16,675
559,585
571,006
Total
Commission income is earned solely by members of the Banking Group.
129
2.2 Commission expense: breakdown
Type of service/Amounts
consolidated
explanatory
notes
a) Guarantees received
b) Credit derivatives
c) Management and brokerage services
1. trading in financial instruments
2. trading in foreign exchange
3. asset management:
3.1. own portfolio
3.2. third-party portfolio
4. custody and administration of securities
5. placement of financial instruments
6. offer of securities, financial products and services through
financial promoters
d) Collection and payment services
e) Other services
Total
Commission expense is incurred solely by members of the Banking Group.
130
30.09.2013
30.09.2012
11,792
9,693
-
-
1,742
1,749
541
10
-
443
18
25
-
-
-
25
1,189
2
1,253
10
-
-
4,863
4,875
21,702
24,259
40,099
40,576
Net trading income
Caption 80
consolidated
explanatory
notes
4.1 Net trading income: breakdown
Transactions/Income items
Capital
gains
(A)
1. Financial assets held for trading
1.1 Debt securities
1.2 Equity instruments
1.3 UCITS units
1.4 Loans
1.5 Other
2. Financial liabilities held for trading
2.1 Debt securities
2.2 Debts
2.3 Other
3. Other financial assets and liabilities:
exchange differences
4. Derivatives
4.1 Financial derivatives:
- On debt securities and interest rates
- On equities and equity indices
- on currency and gold
- Other
4.2 Credit derivatives
Total
Trading
profits
Capital
losses
Trading
losses
Net result
(B)
(C)
(D)
30.09.2013
[(A+B)(C+D)]
11,078
8,487
(5,942)
(1,129)
12,494
6,796
1,967
2,315
-
7,341
1,025
1
120
(4,686)
(759)
(497)
-
(1,083)
(46)
-
8,368
2,187
1,819
120
-
-
-
-
-
-
-
-
-
-
#
#
#
#
(483)
48,777
143,233
(41,542)
(133,331)
20,863
48,777
143,233
(41,542)
(133,331)
20,863
48,698
142,458
(40,092)
(132,640)
18,424
79
498
(1,450)
(571)
(1,444)
#
#
#
#
3,726
-
277
-
(120)
157
-
-
-
-
-
59,855
151,720
(47,484)
(134,460)
32,874
Trading activities are carried out solely by members of the Banking Group.
Following the application of corrective measures in determining the fair value of OTC derivatives, in accordance
with the clarifications introduced by IFRS 13 with reference to the measurement of "non-performance risk", there
has been a modest increase in "losses" of € 1,129 thousand.
131
Net hedging gains (losses)
Caption 90
consolidated
explanatory
notes
5.1 Net hedging gains (losses): breakdown
Income items/Amounts
30.09.2013
30.09.2012
A.1. Fair value hedges
A.2. Hedged financial assets (fair value)
A.3. Hedged financial liabilities (fair value)
A.4. Cash flow hedges
A.5. Foreign currency assets and liabilities
1,239
641
-
115
1,278
-
Total income from hedging activity (A)
1,880
1,393
B. Charges relating to:
B.1. Fair value hedges
B.2. Hedged financial assets (fair value)
B.3. Hedged financial liabilities (fair value)
B.4. Cash flow hedges
B.5. Foreign currency assets and liabilities
627
1,358
86
-
2,467
Total charges from hedging activity (B)
2,071
2,467
C. Net hedging gains (losses) (A-B)
(191)
(1,074)
A. Income relating to:
132
-
Net result on financial assets and liabilities designated at fair
value
Caption 110
consolidated
explanatory
notes
7.1 Net result on financial assets and liabilities designated at fair value: breakdown
Transactions/Income components
1. Financial assets
1.1 Debt securities
1.2 Equity securities
1.3 UCITS units
1.4 Loans
2. Financial liabilities
2.1 Debt securities
2.2 Due to banks
2.3 Due to customers
3. Other financial assets and liabilities:
exchange differences
4. Derivatives
Total
Capital
gains
Gains on
disposal
Capital
losses
Losses on
disposal
Net result
(A)
(B)
(C)
(D)
30.09.2013
7,073
3,133
106
3,834
6,336
204
62
37
105
4,035
(1,112)
(299)
(85)
(728)
(14,253)
(16)
(1)
(1)
(14)
(613)
6,149
2,895
57
3,197
(4,495)
6,336
-
4,035
-
(14,253)
-
(613)
-
(4,495)
-
#
#
#
#
(4)
1,937
15,346
(1)
4,238
(47,681)
(63,046)
(2,725)
(3,354)
(48,470)
(46,820)
Assets and liabilities are measured at fair value solely by members of the Banking Group. The net result of the
measurement of financial liabilities at fair value and of derivatives connected operationally (fair value option for
financial liabilities) is € -54,210 thousand.
133
Net impairment adjustments
Caption 130
8.1 Net impairment adjustments to loans and advances: breakdown
Write-backs
A. Due from banks
- Loans
- Debt securities
B. Loans to customers
Doubtful loans acquired
Interest
Portfolio
Specific
Other
Write-offs
Specific
30.09.2013 30.09.2012
Portfolio
Other writebacks
Adjustments
Interest
Transactions/Income
items
Other writebacks
consolidated
explanatory
notes
(169)
(2,081)
-
-
-
-
-
(2,250)
-
-
-
-
-
-
-
-
-
-
(169)
(2,081)
-
-
-
-
-
(2,250)
-
(35,533)
(878,218)
(993)
77,994
205,829
-
41,788
(589,133)
(419,978)
-
-
-
-
-
-
-
-
-
- Loans
-
-
-
-
-
-
-
-
-
- Debt securities
-
-
-
-
-
-
-
-
-
Other receivables
(35,533)
(878,218)
(993)
77,994
205,829
-
41,788
(589,133)
(419,978)
- Loans
(35,533)
(878,218)
-
77,994
205,829
-
41,788
(588,140)
(420,282)
-
-
(993)
-
-
-
-
(993)
304
(35,702)
(880,299)
(993)
77,994
205,829
-
41,788
(591,383)
(419,978)
- Debt securities
C. Total
8.2 Net impairment adjustments to financial assets available for sale: breakdown
Transactions/Income
items
134
Adjustments
Write-backs
Specific
Specific
30.09.2013
30.09.2012
Write-Offs
Other
Interest
Other
writebacks
A. Debt securities
B. Equity instruments
C. UCITS units
D. Due from banks
E. Loans to customers
-
(2,986)
(1,635)
-
-
-
(2,986)
(1,635)
-
(94)
(1,322)
(3,412)
-
F. Total
-
(4,621)
-
-
(4,621)
(4,828)
8.4 Impairment losses on other financial assets: breakdown
Write-backs
Portfolio
Interest
Interest
Portfolio
Specific
Other
Write-offs
Specific
30.09.2013 30.09.2012
Other writebacks
Adjustments
Other writebacks
Transactions/Income
items
consolidated
explanatory
notes
A. Guarantees given
-
(25,763)
(9,666)
-
8,287
-
34
(27,108)
1,152
B. Credit derivatives
C. Commitments to
disburse funds
-
-
-
-
-
-
-
-
-
-
-
-
-
-
-
-
-
-
D. Other transactions
-
-
-
6
-
-
-
6
-
E. Total
-
(25,763)
(9,666)
6
8,287
-
34
(27,102)
1,152
135
Administrative expenses
Caption 180
consolidated
explanatory
notes
11.1 Payroll: breakdown
Type of expense/amounts
30.09.2013
30.09.2012
1) Employees
574,764
585,096
a) wages and salaries
b) social security charges
c) termination indemnities
d) pension expenses
e) provision for termination indemnities
f) provision for post-retirement benefits and similar commitments:
- defined contribution
- defined benefit
g) payments to external supplementary pension funds:
- defined contribution
- defined benefit
h) costs deriving from payment agreements based on own capital
instruments
i) other personnel benefits
2) Other active employees
3) Directors and auditors
4) Retired personnel
412,486
105,941
22,848
3,495
941
941
11,439
11,439
-
409,540
104,760
16,519
5,307
10,494
9,641
853
6,978
6,978
-
17,614
7,365
8,200
1,451
31,498
4,708
8,940
Total
591,780
600,671
1,927
CR Bra's total contribution is € 10.2 million.
On 31 December 2012, following an agreement reached with the Trade Unions, the Parent Company transferred
the Staff Pension Fund with defined contribution and its related assets to the Arca Previdenza Open-ended
Pension Fund. This is the reason for the increase in "payments to external supplementary pension funds" and the
related elimination of the defined contribution component of the "provision for post-retirement benefits and similar
commitments".
The increase in "other personnel benefits" refers to provisions for extraordinary voluntary redundancies and the
Solidarity Fund for € 9 million (€ 22.5 million as at 30 September 2012), provisions for risks and charges for further
assessments following the verification periods with the Trade Unions (9 April 2013), as provided for in the
agreements signed on 15 September 2012, which also involved extending the time period for another four months.
136
11.2 Average number of employees, by level
Employees:
a) Managers
b) Middle managers
c) Other employees
Other personnel
30.09.2013
30.09.2012
11,528
233
3,410
7,885
157
11,531
228
consolidated
explanatory
notes
3,323
7,980
106
CR Bra's total contribution is 184 people, including 3 managers.
11.2.1 Number of employees, by level: banking group
Employees:
a) Managers
b) Total 3rd and 4th level middle managers
c) Total 1st and 2nd level middle managers
d) Other employees
Other personnel
30.09.2013
30.09.2012
11,723
11,865
231
1,401
2,026
8,065
146
239
1,411
1,980
8,235
97
CR Bra has 198 employees.
137
11.5 Other administrative expenses: breakdown
consolidated
explanatory
notes
30.09.2013
30.09.2012
Taxation
99,488
86,909
Stamp duty
Municipal property tax
Other
82,258
6,640
10,590
67,746
5,755
284,493
26,773
44,175
18,850
24,144
8,277
35,255
16,851
7,197
9,204
7,472
14,524
11,057
10,212
10,236
8,463
4,758
3,995
2,311
20,739
278,515
24,613
37,626
23,537
27,823
8,197
35,007
14,028
7,851
8,857
7,059
13,952
10,309
8,780
11,349
8,733
7,232
4,152
2,199
17,211
383,981
365,424
Other costs
Maintenance and repairs
Rental expense
Post office, telephone and telegraph
Data transmission fees and use of databases
Advertising
Consulting and other professional services
Lease of IT hardware and software
Insurance
Cleaning of office premises
Printing and stationery
Energy and fuel
Transport
Staff training and expense refunds
Information and surveys
Security
Use of external data gathering and processing services
Membership fees
Condominium expenses
Sundry other
Total
13,408
“Consulting and other professional services” expenses are attributable to two different categories of legal and
consulting services, which were needed to provide support for in-house professionals in highly specialised activities
or projects, as well as to assist in adjusting to changes in regulations, developments in the internal control system
or in connection with the 2012-2014 Business Plan. The details are as follows:
- professional services of a legal or tax nature, particularly in connection with the various types of disputes for €
18.6 million, including legal fees for the management of non-performing loans. In this context, note that some of
them, estimated at around € 6.5 million and referring to various Group entities, were previously charged directly to
the debtor;
- professional services from various parties, needed for the completion of multiple funding transactions during the
period (issue of covered bonds, updates and issues as part of the Euro Medium Term Note programme), for the
audit of the financial statements, for ratings, as well as support provided for specific property and financial
valuations for financial statement purposes, for a total of € 2.4 million;
- other sundry professional services (for example, appraisals and other technical support) for € 4.1 million;
- interdisciplinary consulting support to ensure compliance with continuous regulatory changes, for strengthening
the System of Internal Control and with respect to projects developed in connection with the 2012-2014 Business
Plan. These can therefore be considered more appropriately as medium term investments, as is the case, for
example, with activities carried out for developments in the overall management processes attributable to Basel 2
regulations, with a view to the validation of methodologies developed for credit assessment and the consequent
capital benefits obtainable. The total of this type of expense came to € 10.2 million. Other administrative expenses
relating to CR Bra amounted to € 6.9 million.
138
Other operating charges/income
Caption 220
consolidated
explanatory
notes
15.1 Other operating charges: breakdown
Description/Amounts
Loss on disposal of leased assets
Reimbursement of interest for collections and payments settled through the clearing house
Amortisation of leasehold improvement expenditure
Out-of-period expense
Other
Total
30.09.2013
4,120
8
5,126
2,217
19,751
31,222
15.2 Other operating income: breakdown
Description/Amounts
Rental income
Recovery of taxes
Recovery of interest for collections and payments settled through the clearing house
Gains on disposal of fixed assets given under finance leases
Other income
Total
30.09.2013
6,433
87,336
8
1,727
98,693
194,197
139
Earnings per share
consolidated
explanatory
notes
IAS 33 requires disclosure of basic and diluted earnings per share (EPS), specifying how each is
calculated.
Basic earnings per share reflect the relationship between:
a) the earnings attributable to ordinary shareholders,
b) and the weighted average number of shares outstanding during the period.
Diluted earnings per share reflect the relationship between:
a) the earnings used to calculate basic EPS, as adjusted by the economic effects of
converting all outstanding convertible bonds into shares at period end,
b) and the number of shares used to calculate basic EPS, as adjusted by the weighted
average of the potential ordinary shares with a diluting effect deriving from the conversion
of bonds outstanding at period end.
30.09.2013
Attributable
earnings
140
Weighted
average
ordinary
shares
30.09.2012
Earnings
per share
(Euro)
Attributable
earnings
Weighted
average
ordinary
shares
Earnings
per share
(Euro)
Basic EPS
13,741
333,373,447
0.041
139,886
332,267,697
0.421
Diluted EPS
15,386
336,550,374
0.046
143,997
338,764,013
0.425
INFORMATION ON RISKS AND RELATED HEDGING
POLICY
consolidated
explanatory
notes
141
A. Credit Quality
consolidated
explanatory
notes
A.1 Doubtful and performing loans: amounts, adjustments, trends, economic and
territorial distribution
A.1.1 Distribution of credit exposure by portfolio and quality of lending (book values)
Doubtful loans
Other assets
Restructured
loans
Past due loans
Other businesses
Total
1. Financial assets held
for trading
5
2,406
1,741
-
1,103,786
-
-
1,107,938
2. Financial assets
available for sale
-
-
-
-
5,416,097
-
-
5,416,097
1,203,539
3. Financial assets held
to maturity
4. Due from banks
5. Loans to customers
6. Financial assets
designated at fair
value through profit
and loss
7. Financial assets being
sold
8. Hedging derivatives
142
Watchlist loans
Non-Performing
loans
Banking Group
Others
Portfolio/Quality
-
-
-
-
1,203,539
-
-
152
-
-
-
1,702,027
-
-
1,702,179
2,389,707
3,236,542
317,713
605,011
40,658,503
-
-
47,207,476
-
-
3,058
-
71,524
-
-
74,582
-
-
-
-
-
-
-
-
-
-
-
-
2,381
-
-
2,381
Total
30.09.2013
2,389,864
3,238,948
322,512
605,011
50,157,857
-
-
56,714,192
Total
31.12.2012
1,884,688
2,511,094
383,786
421,046
51,737,160
-
7,100
56,944,874
A.1.2 Distribution of credit exposures by portfolio and quality of lending (gross and net
values)
Net exposure
Gross exposure
consolidated
explanatory
notes
Total
(Net exposure)
Performing loans
Net exposure
Specific
provisions
Gross exposure
Doubtful loans
General portfolio
provisions
Portfolio/quality
A. Banking Group
1. Financial assets held for
trading
2. Financial assets available
for sale
3. Financial assets held to
maturity
4,153
1
4,152
1,103,786
#
1,103,786
1,107,938
500
500
-
5,416,185
88
5,416,097
5,416,097
-
-
-
1,203,539
-
1,203,539
1,203,539
2,233
2,081
152
1,702,028
1
1,702,027
1,702,179
10,177,188
3,628,215
6,548,973
40,901,050
242,547
40,658,503
47,207,476
3,058
-
3,058
71,524
#
71,524
74,582
7. Financial assets being
sold
-
-
-
-
-
-
-
8. Hedging derivatives
-
-
-
2,381
#
2,381
2,381
10,187,132
3,630,797
6,556,335
50,400,493
242,636
50,157,857
56,714,192
1. Financial assets held for
trading
-
-
-
#
#
-
-
2. Financial assets available
for sale
-
-
-
-
-
-
-
3. Financial assets held to
maturity
-
-
-
-
-
-
-
4. Due from banks
-
-
-
-
-
-
-
5. Loans to customers
6. Financial assets
designated at fair value
through profit and loss
-
-
-
-
-
-
-
-
-
-
#
#
-
-
7. Financial assets being
sold
-
-
-
-
-
-
-
8. Hedging derivatives
-
-
-
#
#
-
-
Total B
-
-
-
-
-
-
-
4. Due from banks
5. Loans to customers
6. Financial assets
designated at fair value
through profit and loss
Total A
B. Other consolidated
companies
Total
30.09.2013
10,187,132
3,630,797
6,556,335
50,400,493
242,636
50,157,857
56,714,192
Total
31.12.2012
8,226,528
3,025,914
5,200,614
52,028,845
284,585
51,744,260
56,944,874
143
A.1.3 Banking Group - Cash and off-balance sheet exposures to banks: gross and net
values
consolidated
explanatory
notes
Type of exposure/Amounts
Gross
exposure
Specific
provisions
General
portfolio
provisions
Net
exposure
A. Cash exposures
a) Non-performing loans
b) Watchlist loans
2,233
-
2,081
-
#
#
152
-
-
-
#
#
-
2,916,549
#
1
2,916,548
2,918,782
2,081
1
2,916,700
418,533
#
#
-
418,533
c) Restructured loans
d) Past due loans
e) Other assets
Total A
B. Off-balance sheet exposures
a) Doubtful loans
b) Others
Total B
Total (A+B)
418,533
-
-
418,533
3,337,315
2,081
1
3,335,233
A.1.6 Banking Group - Cash and off-balance sheet credit exposures to customers: gross
and net values
Type of exposure/Amounts
Specific
provisions
General
Portfolio
provisions
Net
exposure
A. Cash exposures
a) Non-performing loans
5,264,299
2,874,591
#
2,389,708
b) Watchlist loans
c) Restructured loans
3,894,416
367,148
657,874
46,377
#
#
3,236,542
320,771
654,885
47,306,520
49,874
#
#
242,635
605,011
47,063,885
57,487,268
3,628,716
242,635
53,615,917
267,024
4,470,004
42,732
#
#
16,750
224,292
4,453,254
d) Past due loans
e) Other assets
Total A
B. Off-Balance Sheet exposure
a) Doubtful loans
b) Others
Total B
Total (A+B)
144
Gross
exposure
4,737,028
42,732
16,750
4,677,546
62,224,296
3,671,448
259,385
58,293,463
INFORMATION ON CONSOLIDATED
SHAREHOLDERS’ EQUITY
consolidated
explanatory
notes
145
Consolidated shareholders' equity
consolidated
explanatory
notes
QUALITATIVE INFORMATION
Group shareholders' equity comprises share capital and all types of reserve, together with the net
profit for the period.
In accordance with current supervisory regulations, the Group is required to maintain a minimum
capital adequacy ratio of 8%, which is the normal limit for banking groups.
Compliance with this limit is monitored constantly by the appropriate departments within the
Parent Company, partly with a view to maintaining the regulatory "free capital" needed at a
consolidated level to sustain the Group's growth strategies.
146
QUANTITATIVE INFORMATION
B.1 Consolidated shareholders' equity: breakdown by business type
Captions
Banking
Group
Insurance
companies
Other
businesses
Consolidation
adjustments
and
eliminations
30.09.2013
Share capital
1,749,352
-
1,010
(652,116)
1,098,246
Share premium
1,363,819
-
-
(678,051)
685,768
Reserves
3,794,066
-
(4)
(1,059,737)
2,734,325
Interim dividends
-
-
-
-
-
Equity instruments
-
-
-
-
-
(Treasury shares)
(7,272)
-
-
(2)
(7,274)
Valuation reserves
155,923
-
-
6,162
162,085
111,154
-
-
441
111,595
-
-
-
-
-
-
-
-
-
-
-
-
-
-
-
(8,636)
-
-
-
(8,636)
-
-
-
-
-
-
-
-
-
-
(84,184)
-
-
-
(84,184)
- Financial assets
available for sale
- Property, plant and
equipment
- Intangible assets
- Foreign investments
hedges
- Cash-flow hedges
- Exchange differences
- Non-current assets and
disposal groups held for
sale
- Actuarial gains (losses)
on defined-benefit
pension plans
- Portion of valuation
reserves relating to
investments carried at
equity
-
-
-
5,722
5,722
- Special revaluation laws
144,818
-
-
-
144,818
- Other
Profit (loss) of the year
pertaining to the Group and
minority interests
Consolidated
shareholders' equity
(7,229)
-
-
(1)
(7,230)
48,227
-
353
(25,360)
23,220
7,104,115
-
1,359
(2,409,104)
4,696,370
consolidated
explanatory
notes
147
B.2 Valuation reserves for financial assets available for sale: breakdown
Assets/Amount
Banking Group
Insurance
companies
consolidated
explanatory
notes
Other
businesses
Consolidation
adjustments
and eliminations
30.09.2013
Positive Negative Positive Negative Positive Negative Positive Negative Positive Negative
reserve reserve reserve reserve reserve reserve reserve reserve reserve reserve
1. Debt securities
2. Equity
instruments
3. UCITS units
41,591
22,643
-
-
-
-
-
105,032
1,943
11,196
3,573
-
-
-
-
(600)
-
(25)
41,591
22,618
(182) 104,432
(834)
1,943
11,014
2,739
-
-
-
-
-
-
-
-
-
Total 2013
148,566
37,412
-
-
-
-
(600)
(1,041) 147,966
36,371
Total 2012
223,177
18,730
-
-
-
-
(1,145)
(73) 222,032
18,657
4. Loans
-
The valuation reserve for financial assets available for sale at 30 September 2013 has a positive balance of € 111,595
thousand; at 31 December 2012 it had a positive balance of € 203,375 thousand.
B.3 Valuation reserves for financial assets available for sale: change in the period
Captions/Amounts
Equity
instruments
UCITS units
Loans
1. Opening balance
87,656
116,112
(393)
-
2. Positive changes
70,420
5,618
4,081
-
25,171
2,532
847
-
296
979
2,881
-
-
894
2,881
-
296
85
-
-
44,953
2,107
353
-
1,434
-
-
-
139,103
28,312
4,484
-
38,514
27,752
2,576
-
-
-
-
-
91,624
56
769
-
8,965
504
1,139
-
2.1 Increases in fair value
2.2 Release to the income statement of
negative reserves:
- from impairment
- from disposal
2.3 Other changes
- of which business combinations
3. Negative changes
3.1 Reductions in fair value
3.2 Impairment write-downs
3.3 Releases to the income statement of positive
reserves:
- da realizzo
3.4 Other changes
- of which business combinations
4. Closing balance
148
Debt
securities
-
-
37
-
18,973
93,418
(796)
-
Capital and capital adequacy ratios
Scope of application and regulations
The Group's capital for supervisory purposes and capital adequacy ratios have been determined
in accordance with the Bank of Italy’s
Circular 263 "New regulations for the prudent supervision of banks" of 27 December 2006
and subsequent amendments and updates, and with
Circular 155/91 "Instructions for the reporting of capital adequacy and prudent
coefficients" and subsequent amendments and updates.
As envisaged in these regulations, in order to calculate consolidated capital for supervisory
purposes, the equity method is used to measure "the businesses - other than banking, financial
and banking-related companies - that are directly or jointly controlled by the banking group (or a
sub-holding group or the lead company or the individual bank) or over which significant influence
is exercised".
The "New instructions for the prudent supervision of banks" allow banks and banking groups to
adopt internal systems for calculating the capital requirement for credit risk, once authorisation
has been obtained from the Bank of Italy.
consolidated
explanatory
notes
At present, the BPER Group uses the standardised approach to calculate the capital
requirements for credit risk.
Capital for supervisory purposes
QUALITATIVE INFORMATION
1 Tier 1 capital
Tier 1 capital includes among its positive elements the share capital, the share premium reserve
and revenue reserves. It also includes a Tier 1 non-innovative capital instrument issued on 30
March 2012 by Cassa di Risparmio di Bra s.p.a.. The instrument has the following features: it
amounts to Euro 10 million, is perpetual, floating rate and non-convertible. Tier 1 capital also
includes Euro 12.4 million attributable to savings shares and preferred shares, currently subject to
transitional provisions (known as "grandfathering). The core element amounts to Euro 3,683.9
million.
Among the negative elements, Tier 1 capital is shown net of the treasury shares held in portfolio,
the prudential filters, such as the fair value option, and intangible assets including goodwill.
2 Tier 2 capital
Tier 2 capital includes the valuation reserves, to the extent permitted, having regard for the related
precautionary filters, and the eligible portion of outstanding subordinated bonds, up to a maximum
of 50% of Tier 1 capital, gross of the elements to be deducted. At 30 September 2013 the eligible
portion amounted to Euro 1,596.7 million. The subordinated loans included in Tier 2 capital are
listed below:
149
consolidated
explanatory
notes
150
Characteristics of
subordinated instruments
Interest
Step up
rate
Maturity
date
Currency
Original
amount (in
Euro)
Contribution
to capital for
supervisory
purposes (in
thousands
of Euro)
B.P.E.R. subordinated
convertible bond 2.75%, 20012013
2.75%
NO
31-12-2013
Eur
124,999,991
31,233
EMTN B.P.E.R. subordinated
non-convertible bond floating
rate 3-month Euribor +100 bp,
2006-2016
floating
rate
YES
23-03-2016
Eur
400,000,000
75,646
EMTN B.P.E.R. subordinated
non-convertible bond floating
rate 3-month Euribor +95 bp,
2007-2017
floating
rate
YES
15-05-2017
Eur
400,000,000
179,292
Lower Tier II B.P.E.R.
subordinated non-convertible
bond floating rate 3-month
Euribor +130 bp, 2008-2014
floating
rate
NO
31-12-2014
Eur
100,000,000
40,001
Lower Tier II B.P.E.R.
subordinated non-convertible
bond 5.20%, 2008-2014
5.20%
NO
31-12-2014
Eur
350,000,000
139,980
Lower Tier II B.P.E.R.
subordinated non-convertible
bond 5.90%, 2008-2014
5.90%
NO
31-12-2014
Eur
100,000,000
40,000
Lower Tier II B.P.E.R.
subordinated non-convertible
bond, amortising 5.12%, 20092015
5.12%
NO
31-03-2015
Eur
25,000,000
10,000
Lower Tier II B.P.E.R.
subordinated non-convertible
bond 4.35%, 2010-2017
4.35%
NO
31-12-2017
Eur
18,000,000
18,000
Lower Tier II B.P.E.R.
subordinated non-convertible
bond 4.94%, 2010-2017
4.94%
NO
31-12-2017
Eur
51,000,000
51,000
Lower Tier II B.P.E.R.
subordinated non-convertible
bond 4.75%, 2011-2017
4.75%
NO
15-03-2017
Eur
700,000,000
559,006
Lower Tier II B.P.E.R.
subordinated non-convertible
bond 4.75%, 2012-2018
4.75%
NO
31-12-2018
Eur
400,000,000
400,000
Lower Tier II B.P.E.R.
subordinated non-convertible
bond 5.81%, 2013-2020
5.81%
NO
07-02-2020
Eur
11,945,000
11,945
Characteristics of
subordinated instruments
Interest
Step up
rate
Maturity
date
Currency
Original
amount (in
Euro)
Contribution
to capital for
supervisory
purposes (in
thousands
of Euro)
Cassa di Risparmio di Bra
s.p.a. floating-rate
subordinated bond 2008-2015
nom. 10,000,000
floating
rate
NO
21-03-2015
Eur
10,000,000
4,000
Cassa di Risparmio di Bra
s.p.a. fixed-rate Lower Tier II
subordinated bond 2010-2017
amortising 4%
4.00%
NO
18-08-2017
Eur
10,000,000
8,000
Cassa di Risparmio di Bra
s.p.a. fixed-rate Lower Tier II
subordinated bond 2011-2021
amortising nom. 7,000,000
4.50%
NO
01-04-2021
Eur
7,000,000
7,000
Cassa di Risparmio di Bra
s.p.a. subordinated bond 20122020 amortising 5.25%
5.25%
NO
15-02-2020
Eur
5,000,000
5,000
Banca Popolare di Ravenna
subordinated convertible bond
3.50%, 2008-2013
3.50%
NO
31-12-2013
Eur
30,235,890
6,047
Banca popolare di Lanciano e
Sulmona subordinated
convertible bond 4.50%, 20082013
4.50%
NO
31-12-2013
Eur
26,771,430
5,354
Lower Tier II CARISPAQ
subordinated non-convertible
bond floating rate, 2010-2020
floating
rate
NO
30-09-2020
Eur
25,000,000
4,250
Emil-Ro Factor s.p.a. 20062014 floating-rate subordinated
liability
floating
rate
NO
20-04-2014
Eur
7,000,000
900
2,801,952,311
1,596,654
Total
Amount not considered, having
exceeded the threshold of 50%
of Tier1 capital
Total
consolidated
explanatory
notes
1,596,654
151
3 Tier 3 capital
consolidated
explanatory
notes
Tier 3 capital comprises that part of subordinated loans outstanding not already considered, for an
amount that does not exceed 71.4% of the capital required to cover market risks, excluding the
requirement to cover the counterpart and settlement risks relating to the "trading portfolio for
supervisory purposes".
There have been no issues of subordinated loans with characteristics for inclusion in Tier 3 capital
and neither are there any subordinated loans in excess of the portion to be computed for
supplementary capital purposes.
152
INFORMAZIONE DI NATURA QUANTITATIVA
30.09.2013
31.12.2012
3,913,724
3,930,869
(40,730)
(40,730)
(51,808)
(51,808)
3,872,994
3,879,061
166,764
164,220
E. Total Tier 1 capital (C-D)
3,706,230
3,714,841
F. Supplementary capital (Tier 2 capital before the application of
prudential filters)
1,754,714
1,884,311
(6,622)
(6,622)
(7,433)
(7,433)
1,748,092
1,876,878
166,764
164,220
1,581,328
1,712,658
A. Core capital (Tier 1 capital before the application of prudential filters)
B. Prudential filters of Tier 1 capital
- B.1 positive IFRS prudential filters
- B.2 negative IFRS prudential filters
C. Tier 1 capital gross of items to be deducted (A+B)
D. Items to be deducted from Tier 1 capital
G. Prudential filters for Tier 2 capital
- G.1 positive IFRS prudential filters
- G.2 negative IFRS prudential filters
H. Tier 2 capital gross of items to be deducted (F+G)
I. Items to be deducted from Tier 2 capital
L. Total Tier 2 capital (H-I)
M. Items to be deducted from Tier 1 and Tier 2 capital
N. Capital for supervisory purposes (E+L-M)
-
-
5,287,558
5,427,499
O. Tier 3 capital
P. Capital for supervisory purposes including Tier 3 (N+O)
-
-
5,287,558
5,427,499
consolidated
explanatory
notes
At 30 September 2013, Core Tier 1 capital amounts to € 3,683,865 thousand. It differs from Tier 1 capital for the
component represented by savings shares and preference shares issued by Banco di Sardegna s.p.a. for a total of
€ 12,365 thousand and by the Tier 1 non-innovative capital instrument of € 10,000 thousand. With reference to the
prudential filters for AFS reserves, it should be noted that:
a)
electing for the option provided in the Bank of Italy’s instructions of 18 May 2010, pertaining to European
Union debt securities, has led to a positive impact of € 2.4 million, net of the tax effect;
b)
to permit a reconciliation with Table B.2 "Valuation reserves for financial assets available for sale:
breakdown" between debt securities and the information reported in capital for supervisory purposes, it
should be noted that in adopting the Bank of Italy's instructions of 18 May 2010, debt securities issued by
the central governments of EU countries were excluded for a total of € 15.6 million, net of the tax effect. In
accordance with the Bank of Italy's Circular 155/91 and subsequent amendments and updates, debt
securities related to banking, financial and insurance companies were also excluded for a total of € 0.3
million, net of the tax effect. The valuation reserves on bonds that EMRO Finance Ireland Limited
reclassified from "Available For Sale" (AFS) to "Loans and Receivables" (L&R) with effect from 1 July
2008 pursuant to the amendment to IAS 39 on 13 October 2008 (negative for € 0.8 million, net of tax),
continue to be accounted for in the calculation of the prudential filter;
c)
to permit a reconciliation with Table B.2 "Valuation reserves for financial assets available for sale:
breakdown" between equity instruments and the information reported in capital for supervisory purposes,
it should be noted that in accordance with the Bank of Italy's Circular 155/91 and subsequent
amendments and updates, equity instruments related to banking, financial and insurance companies
were excluded for a total of € 81.6 million, net of the tax effect.
153
Capital adequacy
QUALITATIVE INFORMATION
consolidated
explanatory
notes
154
Particular importance is attached to checking compliance with the capital adequacy requirements,
both at Core Tier 1 level and in total. The responsible functions at the Parent Company perform
this work on an ongoing basis, with the various departments involved (Capital Management, Risk
Management and Group Financial Reporting) issuing regular reports as part of the broader
process of verifying consolidated capital adequacy. The guidelines for this activity are stated in
BPER Group's annual report on the verification of capital adequacy (ICAAP). This report identifies
the functions, methodology and approach for measuring and assessing accepted risk on an
ongoing basis, with a view to guiding operations and quantifying the capital required by the Group
to cover the various risks accepted.
QUANTITATIVE INFORMATION
Description/Amounts
Unweighted amounts
Weighted
amounts/Requirements
30.09.2013
31.12.2012
30.09.2013
31.12.2012
A.1 Credit and counterparty risk
61,548,144
61,561,918
39,162,017
39,645,922
1. Standardised methodology
61,434,946
61,445,864
38,754,431
39,337,821
-
-
-
-
2.1 Basic
-
-
-
-
2.2 Advanced
-
-
-
-
113,198
116,054
407,586
308,101
consolidated
explanatory
notes
A. Assets at risk
2. Methodology based on internal ratings
3. Securitisations
B. Capital adequacy requirements
3,132,961
3,171,674
B.2 Market risk
31,098
30,399
1. Standard methodology
31,098
30,399
2. Internal models
-
-
3. Concentration risk
-
-
B.3 Operational risk
320,981
315,835
1. Basic method
B.1 Credit and counterparty risk
320,981
315,835
2. Standardised method
-
-
3. Advanced method
-
-
B.4 Other precautionary requirements
-
-
B.5 Other elements for the calculation
60,055
62,757
B.6 Total precautionary requirements
3,545,095
3,580,665
44,313,688
44,758,313
8.36%
8.30%
11.93%
12.13%
C. Risk assets and capital ratios
C.1 Risk-weighted assets
C.2 Tier 1 capital/Risk-weighted assets (Tier 1
capital ratio)
C.3 Capital for supervisory purposes including
Tier 3/Risk-weighted assets (Total capital ratio)
The amount indicated in item B.5 consists of specific capital requirements required by the Bank of Italy for assets
at risk relating to credit risk, pertaining to Banco di Sardegna, Banca di Sassari and Sardaleasing.
The Core Tier 1 ratio comes to 8.31% versus 8.27% at 31 December 2012.
Taking account of the capital figures shown in the above table in relation to total risk assets gives the following
capital ratios:
Core Tier 1 ratio: 8.43% (8.27% in December 2012);
Tier 1 capital ratio: 8.48% (8.30% in December 2012);
Total capital ratio: 12.05% (12.13% in December 2012);
with committed capital of Euro 3,545.1 million (Euro 3,580.7 million at 31 December 2012).
The inclusion of CR Bra in the Group's scope of consolidation has had a negative effect that can be quantified at
around -13 bps and -11 bps on the Core Tier 1 and Tier 1 ratios respectively.
155
INFORMATION ON BUSINESS COMBINATION
consolidated
explanatory
notes
157
Transactions carried out at 30 September 2013
1.1
consolidated
explanatory
notes
Acquisition of CR Bra
Description of the transaction
The acquisition of the investment in Cassa di Risparmio di Bra ("CR Bra") from Fondazione Cassa
di Risparmio di Bra took place on 7 February 2013. As a result of this transaction, BPER's
investment in CR Bra increased from 31.02% to 67%, which allows it to be included in the
Banking Group.
The following table shows the figures involved in the business combination (in thousands of Euro).
Date of the
transaction
(a)
Name
Cassa di Risparmio di
Bra s.p.a.
7 February
2013
Cost of the
transaction
52,073
Interest
acquired (b)
Total revenues
(c)
Net
profit/(loss) of
the Company
(d)
67.00%
37,823
3,218
Key:
(a) Date of acquisition of control
(b) Percentage interest acquired with voting rights at ordinary shareholders' meeting
(c) Net interest and other banking income (caption 120 of the income statement) at 31 December 2012
(d) Net profit (loss) recorded by the subsidiary at 31 December 2012
For the accounting treatment of CR Bra in BPER's consolidated financial statements, reference
has been made to IFRS 3 - Business Combinations. This standard defines:
a business combination as a transaction or other event in which a purchaser obtains
control of one or more businesses and provides for the consolidation of the assets,
liabilities and contingent liabilities of the acquired company at their fair value at the date of
acquisition, including any identifiable intangible assets not recognised in the acquiree's
financial statements;
goodwill as the difference between the cost of the business combination and the fair value
of the assets, liabilities and contingent liabilities identified (purchase method).
Under international accounting standards, the cost of the combination, Euro 52,073 thousand, has
to be allocated by measuring the identifiable assets acquired and liabilities assumed at their fair
values, including any identifiable intangible assets not recognised in the acquiree's financial
statements. What remains after this allocation must be recorded as goodwill, which represents a
payment made by the acquirer in anticipation of future economic benefits arising from assets that
cannot be individually identified and recognised separately.
158
Allocation of the cost of the transaction
As explained above, at the date of acquisition, the cost of the combination has to be allocated by
recognising the assets, liabilities and contingent liabilities of the acquired entity at their fair values
at the date of acquisition, including any identifiable intangible assets not recognised in the
acquiree's financial statements. The amount remaining after this allocation has to be recorded as
goodwill.
However, paragraph 45 of IFRS 3 provides that in the event that "the initial accounting for a
business combination is incomplete, the acquirer shall recognise in its financial statements
provisional amounts for the items for which the accounting is incomplete. During the assessment
period, the acquirer shall adjust retrospectively the provisional amounts recognised at the
acquisition date, so as to reflect new information obtained about facts and circumstances that
existed as of the acquisition date that, if known, would have affected the measurement of
amounts recognised as of that date. During the assessment period, the acquirer also has to
recognise additional assets or liabilities if new information is obtained about facts and
circumstances that existed as of the acquisition date that, if known, would have resulted in the
recognition of those assets and liabilities as of that date. The assessment period ends as soon as
the acquirer receives the information it was seeking about facts and circumstances that existed as
of the acquisition date or establishes that it will not be possible to obtain further information.
However, the assessment period must not exceed one year from the date of acquisition."
consolidated
explanatory
notes
We have therefore followed IFRS 3 by making a provisional allocation of the cost of the business
combination; we will have to complete the purchase price allocation on a definitive basis within a
maximum of 12 months from the date of acquisition.
The provisional allocation resulted in goodwill of Euro 7,109 thousand, equal to the difference
between the purchase price and the book value. The assessment period will only be concluded
once the assets acquired and liabilities assumed can be recognised at their fair value in
accordance with IFRS 3, in compliance with the 12 month time period.
To date, the purchase price allocation (PPA) has been started and will end no later than 31
December 2013.
1.2
Acquisition of control of property companies
As already mentioned in the interim report on operations, with a view to streamlining and
reorganising its real estate assets, on 30 January 2013 Nadia s.p.a. signed an agreement to
become the sole shareholder of Immobiliare Reiter s.p.a., already 34% owned at 31 December
2012, and to take over 100% control of another property company, Galilei Immobiliare s.r.l..
For the accounting treatment of these two companies, reference has been made to the same
standard as explained in the previous chapter. The purchase cost of the two companies is in line
with the fair value of their assets, liabilities and contingent liabilities, so there was no goodwill.
1.3
Banking business acquisition
As already mentioned in the interim report on operations at 30 June, on 15 July 2013 the Parent
Company BPER signed an agreement to purchase the banking business of Serfina Banca s.p.a..
The transaction was completed on 30 September 2013, when the assets and liabilities that form
part of the banking business were acquired and the winding-up of the company took effect for
legal purposes as it was impossible to achieve its corporate purpose, resulting in its liquidation.
159
consolidated
explanatory
notes
BPER paid the counterparty a provisional price of Euro 6.2 million, based on the difference
between the assets and the liabilities transferred at 31 December 2012: that price will then be
subject to adjustment depending on the actual amount of the items transferred at 30 September
2013.
To cover any future obligations to pay indemnities because of violations of contractual guarantees
given by Serfina, it set up an escrow account in the name of BPER for an amount of Euro 3
million: this guarantee will remain in force for the next 24 months.
In this case we again made use of the provisions of IFRS 3 § 45 by making a provisional
allocation of the cost of the combination and we will have to carry out final allocation of the
purchase price within a maximum of 12 months from the date of acquisition, but in any event no
later than 31 December 2013.
1.4
Combinations under common control
As already explained in detail in the interim report, CARISPAQ, Banca Popolare di Lanciano e
Sulmona and Banca Popolare di Aprilia were absorbed by the Parent Company BPER on 27 May,
with effect for accounting purposes from 1 January 2013.
These transactions form part of the activities designed to simplify and streamline the
organisational structure and governance of the Group, as well as to optimise and enhance
resources and reduce operating costs.
They have been considered "internal" business combinations between entities under common
control, which are outwith the scope of IFRS 3 and therefore recorded without any change in their
carrying value.
160
Transactions arranged subsequent to the period end
No business combinations have been carried out after 30 September 2013.
consolidated
explanatory
notes
161
ATTACHMENTS
Banca popolare dell’Emilia Romagna s.c.
163
Financial statements of the Parent Company
Balance sheet as at 30 September 2013
Income statement as at 30 September 2013
Income statement by quarter
Statement of changes in shareholders' equity
attachments
Pro-forma financial statements of the Parent Company
Balance sheet as at 31 December 2012
Income statement as at 30 September 2012
165
Balance sheet as at 30 September 2013
(in thousands of Euro)
0
Assets
10. Cash and balances with central banks
20. Financial assets held for trading
30. Financial assets designated at fair value
through profit and loss
40. Financial assets available for sale
50. Financial assets held to maturity
60. Due from banks
70. Loans to customers
80. Hedging derivatives
90. Remeasurement of financial assets backed by
general hedges (+/-)
100. Equity investments
110. Property, plant and equipment
120. Intangible assets
of which: goodwill
130. Tax assets
a) current
b) deferred
b1) of which L. 214/2011
140. Non-current assets and disposal groups classified
as held for sale
150. Other assets
Total assets
30.09.2013
31.12.2012
Change
Change %
188,136
150,988
995,026
1,243,352
37,148
(248,326)
24.60
-19.97
(9,943)
1,009,519
385,489
(964,072)
4,356,168
232
-9.44
28.99
47.12
-30.77
17.52
n.s.
(1,060)
(410,718)
-100.00
-15.28
95,407
105,350
4,491,703
3,482,184
1,203,539
818,050
2,168,642
3,132,714
29,216,594
24,860,426
232
-
-
1,060
2,276,846
2,687,564
295,835
203,216
198,629
172,432
92,619
26,197
45.58
15.19
185,358
160,075
25,283
15.79
669,709
544,714
124,995
22.95
48,853
57,619
(8,766)
-15.21
620,856
487,095
133,761
27.46
550,409
435,637
114,772
26.35
-
6,550
550,026
317,950
(6,550)
232,076
-100.00
72.99
42,350,324
37,726,550
4,623,774
12.26
30.09.2013
31.12.2012
Change
Change %
9,491,420
9,041,971
17,081,432
13,067,800
7,344,534
7,356,927
210,337
236,988
449,449
4,013,632
(12,393)
(26,651)
4.97
30.71
-0.17
-11.25
2,847,929
3,507,210
(659,281)
-18.80
37,600
34,783
80,847
98,993
2,817
(18,146)
8.10
-18.33
43,633
35,912
37,214
63,081
1,476,312
702,842
81,563
attachments
(in thousands of Euro)
Liabilities and shareholders' equity
10. Due to banks
20. Due to customers
30. Debt securities in issue
40. Financial liabilities held for trading
50. Financial liabilities designated at fair value
through profit and loss
60. Hedging derivatives
80. Tax liabilities
a) current
b) deferred
100.Other liabilities
110. Provision for termination indemnities
120. Provisions for risks and charges
a) pensions and similar commitments
b) other provisions
130. Valuation reserves
160. Reserves
170. Share premium reserve
180. Share capital
190. Treasury shares
200. Net profit (loss) (+/-)
Total liabilities and Shareholders' Equity
65,833
7,721
(25,867)
773,470
15,730
110.05
23.89
176,575
144,175
32,400
22.47
106,691
98,667
8,024
8.13
21.50
-41.01
69,884
45,508
24,376
53.56
12,701
107,745
(95,044)
-88.21
1,910,778
1,750,136
624,154
619,462
160,642
4,692
9.18
0.76
1,001,482
998,165
(7,270)
(7,264)
3,317
(6)
0.33
0.08
(20,070)
784
(20,854)
--
42,350,324
37,726,550
4,623,774
12.26
167
Income statement as at 30 September 2013
Captions
10. Interest and similar income
20. Interest and similar expense
30.09.2013 30.09.2012
958,493
797,429
(466,743)
(456,031)
341,398
30. Net interest income
491,750
40. Commission income
314,835
258,064
50. Commission expense
(31,840)
(28,660)
60. Net commission income
282,995
229,404
70. Dividends and similar income
41,006
34,160
80. Net trading income
25,766
41,034
90. Net hedging gains (losses)
100. Gains/losses on disposal or repurchase of:
a) loans
b) financial assets available for sale
c) financial assets held to maturity
(171)
-
91,341
48,898
Change
Change
%
161,064
(10,712)
150,352
56,771
(3,180)
53,591
6,846
(15,268)
(171)
42,443
20.20
2.35
44.04
22.00
11.10
23.36
20.04
-37.21
n.s.
86.80
(241)
(766)
525
-68.54
88,200
25,463
62,737
246.38
-
(179)
179
-100.00
d) financial liabilities
110. Net results on financial assets and liabilities designated
at fair value
3,382
24,380
(20,998)
-86.13
(43,949)
(48,982)
120. Net interest and other banking income
888,738
645,912
(461,814)
(180,967)
5,033
242,826
(280,847)
-10.28
37.59
155.19
(437,607)
(181,343)
(256,264)
141.31
(2,974)
(1,075)
(1,899)
176.65
(21,233)
1,451
(22,684)
--
426,924
464,945
(495,038)
(360,151)
(38,021)
(134,887)
-8.18
37.45
(260,113)
(197,231)
(62,882)
31.88
(234,925)
(162,920)
(72,005)
44.20
(5,377)
(11,324)
(956)
90,910
(421,785)
336
42
5,517
(25,587)
(20,070)
(20,070)
(859)
(7,860)
(660)
56,167
(313,363)
(1,446)
113
150,249
(60,230)
90,019
90,019
(4,518)
(3,464)
(296)
34,743
(108,422)
1,782
(71)
(144,732)
34,643
(110,089)
(110,089)
525.96
44.07
44.85
61.86
34.60
-123.24
-62.83
-96.33
-57.52
-122.30
-122.30
130. Net impairment adjustments to:
a) loans
b) financial assets available for sale
d) other financial assets
140. Net profit from financial activities
150. Administrative costs:
a) payroll
b) other administrative costs
160. Net provisions for risks and charges
170. Net adjustments to property, plant and equipment
180. Net adjustments to intangible assets
190. Other operating charges/income
200. Operating costs
210. Profit (loss) from equity investments
240. Gains (losses) on disposal of investments
250. Profit (loss) from current operations before tax
260. Income taxes on current operations
270. Profit (loss) from current operations aftere tax
290. Net profit (loss)
168
(in thousands of Euro)
0
attachments
50. Commission expense
67
(244,199)
(268)
25,133
(350)
35,950
(30,553)
(1,526)
(1,526)
290. Net profit (loss)
(30,553)
6,056
(36,609)
8,930
(10,456)
40
(1,090)
(181,771)
(2)
1,618
(104,833)
(4,965)
260. Income taxes on current operations
270. Profit (loss) from current operations after tax
240. Gains (losses) on disposal of investments
250. Profit (loss) from current operations before tax
210. Profit (loss) of equity investments
200. Operating costs
190. Other operating charges/income
180. Net adjustments to intangible assets
(2,655)
170. Net adjustments to property, plant and equipment(
(98,998)
(3,165)
(110,243)
(59,513)
(1,642)
(65,888)
146,212
(209,241)
112,147
(2,974)
(13,787)
(125,401)
160. Net provisions for risks and charges
b) other administrative costs
a) payroll
150. Administrative costs:
140. Net profit from financial activities
(5,157)
-
(88,811)
d) other financial assets
b) financial assets available for sale
a) loans
130. Net impairment adjustments to:
407,172
(260,960)
206,115
(93,968)
120. Net interest and other banking income
(17,127)
(52)
-
59,211
(559)
(16,297)
1,288
-
17,761
440
58,600
(175)
19,489
9,073
39,861
114,175
(11,029)
125,204
202,523
6,187
498
382,554
(180,031)
110. Net results on financial assets and liabilities designated at fair value
d) financial liabilities
c) financial assets held to maturity
b) financial assets available for sale
a) loans
100. Gains/losses on disposal or repurchase of:
90. Net hedging gains (losses)
80. Net trading income
70. Dividends and similar income
75,884
86,132
(10,248)
40. Commission income
60. Net commission income
120,529
30. Net interest income
261,983
(141,454)
20. Interest and similar expense
12,009
12,009
(21,187)
33,196
4
(192)
(135,181)
29,827
(338)
(3,704)
(570)
(76,414)
(83,982)
(160,396)
168,565
(2,289)
-
(104,597)
(106,886)
275,451
(10,525)
2,146
-
11,228
(122)
13,252
(63)
10,506
647
92,936
(10,563)
103,499
168,698
(145,258)
313,956
1st quarter 2013 2nd quarter 2013 3rd quarter 2013
10. Interest and similar income
Captions
Income statement by quarter as at 30 September 2013
(20,070)
(20,070)
(25,587)
5,517
42
336
(421,785)
90,910
(956)
(11,324)
(5,377)
(234,925)
(260,113)
(495,038)
426,924
(21,233)
(2,974)
(437,607)
(461,814)
888,738
(43,949)
3,382
-
88,200
(241)
91,341
(171)
25,766
41,006
282,995
(31,840)
314,835
491,750
(466,743)
958,493
30.09.2013
36,559
36,559
(25,386)
61,945
83
-
(106,540)
15,185
(218)
(2,654)
(167)
(54,880)
(63,806)
(118,686)
168,402
(241)
-
(36,960)
(37,201)
205,603
(33,553)
674
(179)
10,834
269
11,598
-
35,895
556
75,587
(8,032)
83,619
115,520
(157,275)
272,795
29,162
29,162
(12,928)
42,090
-
(944)
(115,637)
11,947
(215)
(2,609)
(321)
(56,523)
(67,916)
(124,439)
158,671
(167)
(1,076)
(83,696)
(84,939)
243,610
14,433
21,771
-
(429)
-
21,342
-
(10,581)
32,376
77,419
(10,251)
87,670
108,621
(151,602)
260,223
24,298
24,298
(21,916)
46,214
30
(502)
(91,186)
29,035
(227)
(2,597)
(371)
(51,517)
(65,509)
(117,026)
137,872
1,859
1
(60,687)
(58,827)
196,699
(29,862)
1,935
-
15,058
(1,035)
15,958
-
15,720
1,228
76,398
(10,377)
86,775
117,257
(147,154)
264,411
1st quarter 2012 2nd quarter 2012 3rd quarter 2012
90,019
90,019
(60,230)
150,249
113
(1,446)
(313,363)
56,167
(660)
(7,860)
(859)
(162,920)
(197,231)
(360,151)
464,945
1,451
(1,075)
(181,343)
(180,967)
645,912
(48,982)
24,380
(179)
25,463
(766)
48,898
-
41,034
34,160
229,404
(28,660)
258,064
341,398
(456,031)
797,429
(89,235)
(89,235)
68,559
(157,794)
14
14,599
(110,073)
22,476
(300)
(3,406)
(3,193)
(69,811)
(55,839)
(125,650)
(62,334)
(5,151)
(6,415)
(324,249)
(335,815)
273,481
(16,396)
337
-
39,689
(248)
39,778
(1,184)
8,032
1,143
86,264
(10,441)
96,705
155,844
(149,795)
305,639
30.09.2012 4th quarter 2012
attachments
169
784
784
8,329
(7,545)
127
13,153
(423,436)
78,643
(960)
(11,266)
(4,052)
(232,731)
(253,070)
(485,801)
402,611
(3,700)
(7,490)
(505,592)
(516,782)
919,393
(65,378)
24,717
(179)
65,152
(1,014)
88,676
(1,184)
49,066
35,303
315,668
(39,101)
354,769
497,242
(605,826)
1,103,068
31.12.2012
170
S ha re pre m ium re s e rv e
6 19 ,4 6 2
6 7 5 ,3 6 9
N e t pro f it ( lo s s )
-
16 0 ,4 0 1
3 ,2 5 4 ,4 5 7
3 ,2 5 4 ,4 5 7
16 0 ,4 0 1
( 8 3 ,3 11)
-
( 7 2 ,3 8 2 )
68,018
1,509,936
1,5 7 7 ,9 5 4
6 7 5 ,3 6 9
-
996,426
9 9 6 ,4 2 6
B a la nc e a s
a t 1.1.12
3 ,4 6 9 ,0 2 8
784
( 7 ,2 6 4 )
-
10 7 ,7 4 5
89,638
1,660,498
1,7 5 0 ,13 6
6 19 ,4 6 2
-
998,165
9 9 8 ,16 5
B a la nc e a s
a t 1.1.13
-
( 13 2 ,2 9 8 )
-
-
-
-
132,298
13 2 ,2 9 8
-
-
-
-
R e s e rv e s
( 2 8 ,10 3 )
( 2 8 ,10 3 )
-
-
-
-
-
-
-
-
-
-
D iv ide nds
a nd o t he r
a llo c a t io ns
-
-
-
-
-
-
-
-
-
-
-
-
D iv ide nds
a nd o t he r
a llo c a t io ns
A llo c a t io n o f prio r
ye a r re s ult s
-
(784)
-
-
-
-
784
784
-
-
-
-
R e s e rv e s
A llo c a t io n o f prio r
ye a r re s ult s
-
-
-
-
-
-
-
-
8 3 ,7 0 4
-
-
-
17 ,7 3 9
65,965
-
6 5 ,9 6 5
C ha nge s
in
re s e rv e s
15 9 ,9 12
-
-
-
54
155,353
4,505
15 9 ,8 5 8
C ha nge s
in
re s e rv e s
2 1,8 7 9
-
76 ,0 4 7
-
-
-
-
-
( 5 5 ,9 0 7 )
-
1,739
1,73 9
Is s ue o f
ne w s ha re s
8 ,0 13
-
4
-
-
-
-
-
4 ,6 9 2
-
3,317
3,3 17
Is s ue o f
ne w s ha re s
-
-
-
-
-
-
-
-
-
-
-
-
C ha nge s during t he pe rio d
-
-
-
-
-
-
-
-
-
-
-
-
E xt ra o rdina ry C ha nge s in
dis t ribut io n
e quit y
o f div ide nds ins t rum e nt s
D e riv a t ives o n
t re a s ury
s ha re s
-
-
-
-
-
-
-
-
-
-
-
-
-
-
-
-
-
-
-
-
-
-
-
-
-
-
-
-
-
-
-
-
-
P urc ha s e E xt ra o rdina ry C ha nge s in
e quit y
of
dis t ribut io n
t re a s ury
o f div ide nds ins t rum e nt s
h
-
D e riv a t ives o n
t re a s ury
h
T ra ns a c t io ns o n s ha re ho lde rs ' e quit y
( 10 )
-
( 10 )
-
-
-
-
-
-
-
-
-
P urc ha s e
of
t re a s ury
s ha re s
T ra ns a c t io ns o n s ha re ho lde rs ' e quit y
C ha nge s during t he pe rio d
-
-
-
-
-
-
-
-
-
-
-
-
-
-
-
-
-
-
-
-
-
-
-
-
Sto ck
o pt io ns
Sto ck
o pt io ns
-
-
-
-
-
-
-
-
-
-
-
-
-
-
-
-
-
-
-
-
-
-
-
-
2 0 ,0 7 0
( 115 ,16 8 )
2 6 1,2 2 5
9 0 ,0 19
-
-
17 1,2 0 6
-
-
-
-
-
-
-
C o m pre he n
s iv e
inc o m e a s
at
3 0 .0 9 .2 0 12
-
-
-
( 9 5 ,0 9 8 )
-
-
-
-
-
-
-
C o m pre he ns iv e
inc o m e a s
at
3 0 .0 9 .2 0 13
3 ,5 9 3 ,16 2
9 0 ,0 19
( 7 ,2 6 4 )
-
116 ,5 6 3
133,983
1,642,234
1,7 7 6 ,2 17
6 19 ,4 6 2
-
998,165
9 9 8 ,16 5
S ha re ho lde rs '
e quit y a s a t
3 0 .0 9 .2 0 12
3 ,5 2 1,7 7 5
(2 0 ,0 7 0 )
( 7 ,2 7 0 )
-
12 ,7 0 1
244,991
1,665,787
1,9 10 ,7 7 8
6 2 4 ,15 4
-
1,001,482
1,0 01,4 8 2
S ha re ho lde rs ’
e quit y a s a t
3 0 .0 9 .2 0 13
(in thousands of Euro)
(*) The change in the opening balances of reserves from profits and valuation reserves is in line with the approach adopted by the National Association of Actuaries (Circular no. 35 of 21 December 2012), as
detailed in Part A of the Explanatory Notes to the 2012 financial statements.
S ha re ho lde rs ’ e quit y
-
-
9 ,0 4 2
-
(9,042)
( 9 ,0 4 2 )
-
-
-
-
C ha nge s
in o pe ning
ba la nc e s
( *)
-
-
-
-
-
-
-
-
-
-
-
-
C ha nge s
in o pe ning
ba la nc e s
( 8 3 ,3 11)
E quit y ins t rum e nt s
T re a s ury s ha re s
( 8 1,4 2 4 )
68,018
1,518,978
1,5 8 6 ,9 9 6
V a lua t io n re s e rv e s
b) o ther
a) fro m pro fits
R e s e rv e s :
S ha re pre m ium re s e rv e
-
996,426
a) o rdinary shares
b) o ther shares
9 9 6 ,4 2 6
S ha re c a pit a l:
B a la nc e a s
a t 3 1.12 .11
3 ,4 6 9 ,0 2 8
784
S ha re ho lde rs ’ e quit y
N e t pro f it ( lo s s )
( 7 ,2 6 4 )
E quit y ins t rum e nt s
T re a s ury s ha re s
10 7 ,7 4 5
89,638
1,660,498
1,7 5 0 ,13 6
V a lua t io n re s e rv e s
b) o ther
a) fro m pro fits
R e s e rv e s :
-
998,165
a) o rdinary shares
b) o ther shares
9 9 8 ,16 5
S ha re c a pit a l:
B a la nc e a s
a t 3 1.12 .12
Statement of changes in shareholders' equity
attachments
818,050
50. Financial assets held to maturity
160,075
of which: goodwill
26,821
3,226,329
317,950
TOTAL ASSETS
-
37,726,550
6,550
37,463
43,162
1,722
44,884
-
6
30,105
2,565
-
-
2,549,848
446,365
-
92,223
150. Other assets
140. Non-current assets and disposal
groups held for sale
435,637
487,095
b) deferred
b1) of which L. 214/2011
57,619
a) current
544,714
172,432
120. Intangible assets
130. Tax assets:
203,216
2,687,564
110. Property, plant and equipment
100. Equity investments
1,060
-
90. Remeasurement of financial assets
backed by general hedges
24,860,426
70. Loans to customers
80. Hedging derivatives
3,132,714
3,482,184
40. Financial assets available for sale
60. Due from banks
105,350
88
1,442
1,243,352
20. Financial assets held for trading
30. Financial assets designated at
fair value through profit and loss
BPLS
31,982
BPER
150,988
10. Cash and balances with Central Banks
Assets
4,038,713
12,246
-
23,781
29,672
42,155
71,827
-
138
56,697
-
-
-
2,626,064
1,122,355
-
102,816
553
22,571
23,446
CARISPAQ
Balance sheet as at 31 December 2012
Parent Company
Pro-forma financial statements of the
782,600
4,772
-
2,151
3,054
399
3,453
-
-
13,753
-
-
-
481,014
242,020
-
15,112
-
9,812
12,664
BPA
364,969
43,233,615
3,180
499,031
(2,540,577)
562,983
(1)
6,550
101,895
-
-
185,358
664,878
-
197,859
25,283
25,283
303,771
-
-
2,208,692
30,517,352
-
-
2,895,469
(2,047,985)
(481,437)
818,050
-
1,060
3,692,095
(240)
-
88,186
1,255,603
(21,574)
(17,805)
219,081
Total
1
Merger adjustments
(in thousands of Euro)
attachments
171
172
35,912
63,081
b) deferred
6,728
4,997
(7,264)
784
190. Treasury shares
200. Net profit (loss)
TOTAL LIABILITIES AND SHAREHOLDERS’
EQUITY
37,726,550
4,038,713
80,001
57,378
998,165
180. Share capital
3,226,329
60,770
619,462
1,750,136
170. Share premium reserve
160. Reserves
51,374
(2,070)
(2,075)
84,427
7,453
6,166
13,619
12,910
65,805
3,053
534
3,587
17,649
-
17,649
6,670
66,833
634
412
1,046
-
1,090
948
-
714,462
1,088,870
-
2,928,791
1,699,020
-
101,646
CARISPAQ
20,741
BPLS
179,825
107,745
45,508
b) other provisions
130. Valuation reserves
98,667
144,175
65,833
a) pensions and similar commitments
120. Provisions for risks and charges:
110. Provision for termination
indemnities
702,842
98,993
80. Tax liabilities:
a) current
100. Other liabilities
34,783
3,507,210
50. Financial liabilities designated at
fair value through profit and loss
60. Hedging derivatives
236,988
7,356,927
40. Financial liabilities held for trading
30. Debt securities in issue
13,067,800
9,041,971
10. Due to banks
20. Due to customers
BPER
Liabilities and shareholders’ equity
782,600
9,191
-
15,011
27,654
71,767
(265)
1,701
-
1,701
3,286
15,319
390
108
498
-
4,913
19
150,397
471,738
11,371
BPA
72,311
(159,789)
(2,540,577)
(12,963)
-
(149,073)
(158,761)
43,233,615
8,737
(7,264)
1,001,482
624,156
1,902,709
103,335
104,833
-
177,144
845,229
(5,570)
-
72,030
4,872
-
36,966
-
88,699
108,996
4,872
-
34,783
3,491,728
236,819
8,279,167
18,095,830
8,242,065
Total
-
(20,395)
(2,226)
(1,031,489)
(71,519)
(933,664)
Merger adjustments
(in thousands of Euro)
attachments
50,960
29,490
8,027
(144)
7,883
341,398
258,064
(28,660)
229,404
30. Net interest income
40. Commission income
50. Commission expense
1,676
1,669
7
48,898
(766)
25,463
(179)
24,380
100. Gains/losses on disposal
or repurchase of:
a) loans
b) financial assets available for sale
c) financial assets held to maturity
(384)
(51)
1,265
(859)
(7,860)
(660)
56,167
160. Net provisions for risks and charges
170. Net adjustments to property,
plant and equipment
180. Net adjustments to intangible assets
270. Profit (loss) from
current operations after tax
280. Profit (loss) after tax on
non-current assets held for sale
290. Net profit (loss)
240. Gains (losses) on disposal of
investments
250. Profit (loss) from current
operations before tax
260. Income taxes on current operations
230. Adjustments to goodwill
210. Profit (loss) from equity investments
200. Operating costs
4,278
4,278
90,019
(3,499)
(60,230)
90,019
7,777
113
-
-
(19,140)
150,249
-
(1,446)
(313,363)
157
(162,920)
b) other administrative costs
190. Other operating charges/income
(10,750)
(197,231)
a) payroll costs
(9,377)
26,917
(20,127)
464,945
(360,151)
(30)
(3,118)
(1,075)
1,451
(15,380)
(181,343)
-
(18,528)
(180,967)
-
45,445
645,912
150. Administrative costs:
140. Net profit from financial activities
d) other financial assets
c) financial assets held to maturity
120. Net interest and other banking
income
130. Net impairment adjustments
to:
a) loans
b) financial assets available for sale
110. Net results on financial assets and
liabilities designated at fair value
-
(1,074)
-
90. Net hedging gains (losses)
(48,982)
6,787
41,034
80. Net trading income
d) financial liabilities
683
34,160
70. Dividends and similar income
60. Net commission income
10. Interest and similar income
20. Interest and similar expense
(21,470)
MELIORBANCA
797,429
BPER
(456,031)
Income Statement
8,966
-
8,966
(7,298)
16,264
-
-
-
(52,736)
4,787
(4)
(1,359)
(2,740)
(23,818)
(29,602)
(53,420)
69,000
32
-
-
(22,375)
(22,343)
91,343
(17)
42
-
3,382
-
3,424
-
402
78
27,371
(2,078)
29,449
60,085
(46,587)
106,672
BPLS
Income statement as at 30 September 2012
9,026
-
9,026
(5,451)
14,477
4
-
-
(39,770)
5,371
(16)
(1,513)
(136)
(17,971)
(25,505)
(43,476)
54,243
229
-
-
(14,039)
(13,810)
68,053
244
111
-
3,218
-
3,329
-
1,231
168
19,871
(671)
20,542
43,210
(50,595)
93,805
CARISPAQ
7,145
-
7,145
(3,261)
10,406
(8)
-
-
(16,696)
1,461
-
(820)
(5)
(7,663)
(9,669)
(17,332)
27,110
(20)
-
-
(1,919)
(1,939)
29,049
(5)
-
-
2,137
-
2,137
-
586
49
11,157
(375)
11,532
15,125
(8,431)
23,556
BPA
295,687
1
5,505
527
125,466
6,032
125,466
6,032
(79,212)
110
204,678
-
(1,446)
(441,523)
1
-
-
182
(732)
68,210
(11,936)
-
(3,582)
(222,100)
(271,383)
(493,483)
647,537
1,662
-
(2,033)
(1)
(841)
1,022
1
1
5,322
1,023
-
(235,428)
2,159
(1)
2,160
(235,057)
882,965
(47,224)
24,540
(179)
43,474
(766)
67,069
(1,074)
49,930
29,088
327,489
3,163
1,536
7,605
7,605
-
(6,050)
(110)
-
(31,802)
489,489
(537,894)
1,027,383
(45,039)
45,220
181
(125)
126
Total
(in thousands of Euro)
Merger
adjustments
attachments
173
Banca popolare dell’Emilia Romagna
Cooperative Bank with head office in Modena (Italy)
Via San Carlo, 8/20
Tel. 0039 059 2021111 – Fax 0039 059 2022033 - Telex 510031/511204 emipop
Bank Registration n° 4932 – ABI code 5387-6
Parent Company of Banca popolare dell’Emilia Romagna Banking Group
Registered in the Register of Banking Group with code 5387.6, since 7 August 1992
http://www.bper.it - E-mail: [email protected]
Tax code, VAT number and Business Register n° 01153230360
Modena Chamber of Commerce n° 222528 Share capital as at 31/12/2012 € 998,164,965
Member of the Interbank Deposit Guarantee Fund
Ordinary shares listed on the MTA market
Scaricare