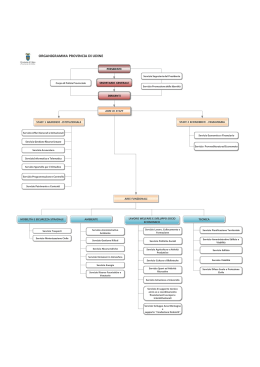
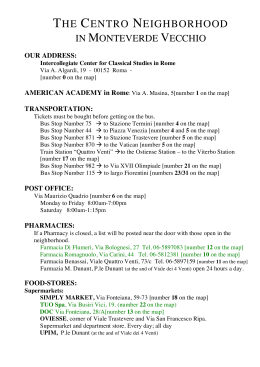
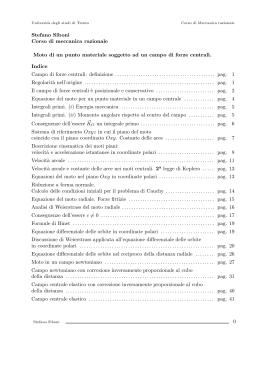
A HIGH-DENSITY, SNP-BASED CONSENSUS MAP OF TETRAPLOID WHEAT AS A BRIDGE TO INTEGRATE
DURUM AND BREAD WHEAT GENOMICS AND BREEDING
Marco Maccaferri1§, Andrea Ricci1, Silvio Salvi1, Sara Giulia Milner1, Enrico Noli1, Pier Luigi Martelli2, Rita Casadio2,
Eduard Akhunov3, Simone Scalabrin4, Vera Vendramin4, Karim Ammar5, Antonio Blanco6, Francesca Desiderio7, Assaf
Distelfeld8, Jorge Dubcovsky9, Tzion Fahima10, Justin Faris11, Abraham Korol10, Andrea Massi12, Anna Mastrangelo13,
Michele Morgante4, Curtis Pozniak14, Steven Xu11, Roberto Tuberosa1
1Department
of Agricultural Science (DipSA), Viale Fanin 44, University of Bologna, 40127 Bologna, Italy
Group, Via Selmi 3, University of Bologna, 40126 Bologna, Italy
3Department of Plant Pathology, Kansas State University, Manhattan, Kansas 66506
4Istituto di Genomica Applicata, c/o Parco Scientifico e Tecnologico L. Danieli, 33100 Udine, Italy and University of Udine, Dipartimento di Scienze
Agrarie e Ambientali, 33100 Udine, Italy
5CIMMYT Carretera Mexico-Veracruz km 45, 56130 Texcoco, Mexico
6Dipartimento di Biologia e Chimica Agro-forestale ed ambientale, Università di Bari, Aldo Moro, Via Amendola 165/A, 70126 Bari, Italy
7Consiglio per la ricerca e la sperimentazione in agricoltura, Genomics Research Centre, Via San Protaso 302, 29017 Fiorenzuola d'Arda, Italy
8Faculty of Life Sciences, Dept. of Molecular Biology and Ecology of Plants, Tel Aviv University, 69978 Tel Aviv, Israel
9Department of Plant Sciences, University of California, Davis, CA 95616, USA, and Howard Hughes Medical Institute, Chevy Chase, MD 20815
10Department of Evolutionary and Environmental Biology, Institute of Evolution, Faculty of Science and Science Education, University of Haifa, Mt.
Carmel, 31905 Haifa, Israel
11USDA-ARS Cereal Crops Research Unit, NCSL 1605 Albrecht Blvd. N., Fargo, 58102-2765 ND, USA
12Società Produttori Sementi Bologna (PSB), Via Macero 1, 40050 Argelato, Italy
13Consiglio per la ricerca e la sperimentazione in agricoltura, Cereal Research Centre, SS16 km 675, 71122 Foggia, Italy
14Crop Development Centre and Department of Plant Sciences, University of Saskatchewan, 51 Campus Drive, Saskatoon, SK S7N 5A8, Canada
2Biocomputing
Supplemental Figure S1. Relationship between marker order and genetic
distances of the 13 component maps to the tetraploid consensus map.
Component maps are reported as projection plots (Y values) on the consensus
map (X values) for all chromosomes. Spearman rank correlations are reported as
ro (r) values for each linkage group.
Chromosome
Mr x Cd
Cl x Ld
Kf x UC1113
Kf x Sv
1A
1B
2A
2B
3A
3B
4A
4B
5A
5B
6A
6B
7A
7B
Chromosome
G9586
Sv x Cc
Mh x Cr
Sm x Lv
1A
1B
2A
2B
3A
3B
4A
4B
5A
5B
6A
6B
7A
7B
Sv x Zv
Ln x G16-18
Lt x MG_5323
Sm x Ml
Bn x PI_40125
Chromosome
1A
1B
2A
2B
3A
3B
4A
4B
5A
5B
6A
6B
7A
7B
Spearman rank correlations of marker order between linkage groups of single maps
and the consensus map
Chr.
Kf x Sv
Kf X UC
Cl X Ld
Mr X Cd
Sm X Lv
Mh X Co
Cc X Sv
G9586
Bn X PI
Sm X Ml
Lt X MG
Ln X
G18-16
Sv X Zv
1A
0.906
0.973
0.954
0.984
0.923
0.919
0.959
0.958
0.977
0.993
0.994
0.432
0.996
1B
0.993
0.985
0.997
0.958
0.971
0.949
0.946
0.968
0.993
0.994
0.995
0.970
0.998
2A
0.707
-
0.994
0.886
0.990
0.898
0.945
0.977
0.988
0.988
0.988
0.958
0.994
2B
0.912
0.737
0.989
0.985
0.976
0.969
0.966
0.935
0.941
0.998
0.988
0.979
0.999
3A
1.000
0.931
0.990
0.990
0.979
0.961
0.984
0.874
0.981
0.997
0.996
0.955
0.999
3B
0.845
0.953
0.960
0.993
0.960
0.995
0.958
0.958
0.977
0.997
0.997
0.981
0.994
4A
0.972
0.976
0.930
0.978
0.963
0.933
0.983
0.931
0.921
0.990
0.991
0.974
0.985
4B
0.799
0.942
0.991
0.995
0.971
0.967
0.977
0.972
0.967
0.994
0.999
0.986
0.998
5A
0.945
0.607
0.971
0.984
0.985
0.983
0.993
0.874
0.989
0.978
0.998
0.962
0.998
5B
0.887
0.965
0.979
0.974
0.985
0.986
0.992
0.962
0.990
0.981
0.985
0.983
0.996
6A
0.988
0.971
0.979
0.971
0.936
0.975
0.966
0.650
0.946
0.996
0.990
1
0.988
6B
0.976
0.985
0.998
0.984
0.994
0.987
0.958
0.982
0.991
0.987
0.992
0.978
0.997
7A
0.970
1
0.945
0.980
0.994
0.972
0.996
0.719
0.980
0.990
0.996
0.820
0.995
7B
0.980
0.983
0.997
0.971
0.995
0.954
0.971
0.974
0.986
0.991
0.998
0.714
0.994
Scaricare