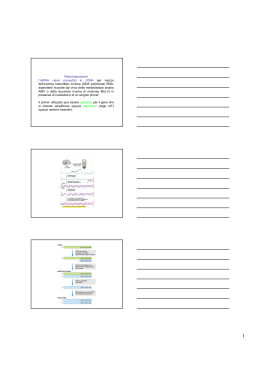
PCR regione di interesse I°stepp 5’ 3’ 3’ 5’ III°step i filamenti vengono separati ed i primers si appaiano i filamenti vengono separati ed i primers si appaiano 5’ complementarietà al primer 1 3’ primer 1 primer 2 3’ 5’ 3’ 3’ 5’ 5’ i primers si estendono 5’ 3’ complementarietà al primer 1 complementarietà al primer 2 3’ 5’ II°step i filamenti vengono separati ed i primers si appaiano 3’ 5’ 5’ 3’ complementarietà al primer 2 5’ 3’ 3’ 5’ 5’ 3’ 3’ 5’ Frammenti desiderati (quelli di lunghezza variabile non sono mostrati) i primers si estendono 3’ 5’ filamenti di lunghezza variabile 5’ filamenti di lunghezza omogenea 3’ i primers si estendono E così via 5’-ATGGCTCAGTGGAACCAGCTGCAGCAGCTGGACACACGCTACCTGAAGCAGCTGCACCAGCTGTACAGCGA- 5’-ATGGCTCAGTGGAACCAG-3’ 3’-TACCGAGTCACCTTGGTCGACGTCGTCGACCTGTGTGCGATGGACTTCGTCGACGTGGTCGACATGTCGCT- -CACGTTCCCCATGGAGCTGCGGCAGTTCCTGGCACCTTGGATTGAGAGTCAAGACTGGGCATATGCAGCCA-3’ 3’-TGACCCGTATACGTCGGT-5’ -GTGCAAGGGGTACCTCGACGCCGTCAAGGACCGTGGAACCTAACTCTCAGTTCTGACCCGTATACGTCGGT-5’ 5’-ATGGCTCAGTGGAACCAG-3’ Tm=(No G+C)x4 + (No A+T)x2 = (10)x4 + (8)x2=56OC 5’-TGGCTGCATATGCCCAGT-3’ Tm=(No G+C)x4 + (No A+T)x2 = (10)x4 + (8)x2=56OC PCR: amplificazione n.ro cicli n.ro sequenze bersaglio 1 0 3 2 10 256 15 8192 20 262.144 25 8.388.608 30 268.435.456 La sequenza bersaglio è la sequenza di DNA sintetizzata tra i due primers Occorre ~1g di DNA per l’analisi di una sequenza o una digestione con enzimi di restrizione tali da poter essere visibili in elettroforesi. Se vi sono ~5 pg di DNA/cellula umana (5x10-12g) allora ~1 g of DNA potrebbe essere isolato da 200.000 cellule ma avremmo un miscuglio di tutti i geni. In 1 g di DNA genomico, una copia singola di un gene (300 bp) equivarrebbe a ~0.1 pg di DNA. Questo 0.1 pg di DNA potrebbe essere amplificato mediante PCR producendo 0.8 g in 25 cicli e 27 g in 30 cicli. PCR VANTAGGI: • Sensibilita’ • Rapidita’ • Si presta all’analisi simultanea di molti campioni (high throughput) • Si presta all’analisi simultanea di diverse sequenze sullo stesso campione • Si presta all’analisi di DNA degradato o incluso in mezzi strani, o fissato • • • • • • SVANTAGGI: Sensibilita’ (rischio di contaminazioni-falsi positivi) Variabile efficienza di amplificazione a seconda della sequenza Richiede conoscenza di base delle sequenze da amplificare e messa a punto per coppie di oligonucleotidi di innesco (primers) Può sintetizzare frammenti relativamente corti La sintesi è imprecisa e introduce errori nella sequenza (la Taq pol non possiede attività 3’->5’ esonucleasica) Diagnostica molecolare In genere i metodi classici sono basati su tecniche immunochimiche Gli Ab si formano dopo diverse settimane La PCR permette di verificare la presenza di poche copie del virus prima ancora che si siano formati gli anticorpi. Medicina legale regione a lunghezza ipervariabile (VNTR) individuo A individuo B VNTR 1 cromosomi omologhi VNTR 2 • To save time, money, and materials, much work has gone into developing procedures whereby test DNA can be "incubated" with a combination of PCR primers for several different markers at one time. Primers are designed to bind at only one spot in the genome so that during the PCR each primer should be busily dissecting out and amplifying its own marker exclusively. • The task of sorting out the results at the end is facilitated by adding various colored fluorescent tags to the fragments. Fluorescent labeling of DNA fragments may be performed in several ways. The most common method is to incorporate a fluorescent dye on the 5'end of a PCR primer so that during PCR amplification either the forward or the reverse strand of DNA will be labeled. • At the end of the PCR, the mixture will be run through a gel electrophoresis slab or an array of microtubules each filled with a gel. Since each amplified fragment has a discrete length that depends on the number of repeat motifs, it will move through the gel at a different rate. The colors of the fluorescent labels are coordinated with the size ranges of the markers so that several markers in the same size range can be run together, each labeled with a different color • • • By comparing with the mobility rates of fragments of known lengths, it is possible to determine the length in base pairs for each marker and thus by calculation, the number of repeats which is the number that you will receive in your report. In the tracing above, four different fluorescent labels have been used--green, blue, red, and black (which was probably actually yellow which does not show up very well.) Two different sets of markers are shown. The upper tracing represents the results of multiplexing 19 different markers--each labeled by its DYS identification number. The bottom tracing shows the results of nine of the markers in the upper trace. Notice, for example, how the markers DYS389I and DYS388 are only distinguishable as two separate markers because of their different colored fluorescence. • Also note that the height of the fluorescence peak for each marker is not an important value as only primers are labeled--one per fragment no matter how long or short the fragment. The location of the peak on the x axis represents the number of base pairs in the fragment which is a function of the number of repeats. Basically, once the number of base pairs in the fragment is determined, it is a matter of subtracting the number of base pairs in the primer from the total length then dividing that number by the number of bps that make up on marker motif. This is a bit of an oversimplification because some markers may be made of more than one repeating pattern and some primers may actually be part of the actual STR region. Nevertheless, the concept is the same. All measurements and calculations are done by computer. • In most large labs, an instrument called an automated DNA sequencer is used to run the gels and record the different colors. There's an ultraviolet laser built into the machine that shoots through the gel near the bottom and scans side to side, checking for bands of fluorescent colors to pass through its beam. It is possible to run as many as 96 samples through the gel at one time! The ABI PRISM® 3700 DNA Analyzer shown at the right is, according to the Applied Biosystems website, "a fully automated, multi-capillary electrophoresis instrument designed for use in production-scale DNA analysis. It can automatically analyze multiple runs of 96 samples, which enables 24-hour unattended operation." Applicazioni nella ricerca per clonare nuovi geni (in alternativa allo screening) • ATVALDLHILNANLDPDQTGATSAVTAEG • PROBE • PRIMER FORWARD • V A L D L H I • GTG GCG CTG GAC CTG CAC AT • A A A T A T • T T T T • C C C C • TTA TTA • G G DEGENERAZIONE 2304 Ingegnerizzazione di proteine PROTEINE CHIMERICHE Proteina B Proteina A Proteina chimerica Si parte dai geni (cDNA) delle proteine Designare i primers Fare 2 PCR separate Identificazione del sesso • Amplificazione specifica di un segmento del cromosoma Y • Sesso di un bambino non ancora nato • Analisi di reperti archeologici (spesso le differenze anatomiche sono indistinguibili) • Attenzione alle contaminazioni!!! Mutagenesi: metodo basato su M13 Mutagenesi:metodo basato su PCR Step 1 G C T A G PCR G C Step 2 PCR C Step 3 G C PCR G C PCR con + Identificazione di una sequenza codificante • Metodi informatici – – – – Uso dei codoni Giunzioni esoni/introni Identificazione regioni di regolazione Analisi per omologia • Metodi sperimentali – – – – Northern blot Southern blot (zooblot) Exon-trapping ……………… Figura 54 Giunzioniesono/introni branch site intron exon intron A AG GU AAGU C G A C CUGA U C/U-rich NCAG G 20-50 bases exon exon A AG G C exon Northern blot Southern blot – STUDIO DELL’ATTIVITA’ DEL GENOMA • Una visione globale del genoma e della sua attività deve comprendere non solo l’analisi della sequenza, l’identificazione dei geni, ma anche comprendere come esso opera all’interno delle cellula specificando e coordinando i geni che devono essere espressi in risposta alle condizioni fisiologiche. Questo aspetto molto importante comprende lo studio del – TRASCRITTOMA – PROTEOMA • TRASCRITTOMA • Il trascrittoma comprende il pool di mRNA presente nella cellula in un dato momento. Si comprende quindi che il tracrittoma può essere formato da migliaia di mRNA. • • • • • I metodi più utilizzati per caratterizzare un trascrittoma sono: -RT-PCR -SAGE (analisi seriale dell’espressione genica) -Microarray -Differential dispaly Differential display PROTEOMICA • Il proteoma comprende tutte le proteine espresse nello stesso momento in una cellula allo stesso tempo, incluse tutte le isoforme e le modificazioni posttraduzionali. • La proteomica si può dividere in: – proteomica classica – proteomica funzionale. • • • • • • • L’identificazione di tutte le proteine è importante per: •Identificazione di nuovi bersagli proteici per farmaci • Validazione dei bersagli • Profilo d’azione dei farmaci • “Farmaco-proteomica” (tossicologia in vivo) • Comparazione tra tessuti malati e normali • Comparazione tra tessuti malati e trattati farmacologicamente • • Studio delle modificazioni post-trascrizionali • • Strategie integrate con la genomica • I principali metodi che permettono lo studio e l’identificazione di molte proteine contemporaneamente sono: • elettroforesi bidimensionale • spettrometria di massa • protein microarray Sorgente di ioni, Analizzatore di massa che misura il rapporto carica/massa (m/z) detector che registra il numero di ioni a ogni valore di m/z Electrospray ionisation (ESI) matrix-assisted laser desortion/ionisation (MALDI) MALDI-MS – miscela di peptide semplice ESI-MS - per campioni complessi
Scaricare