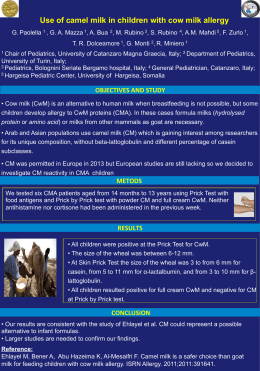
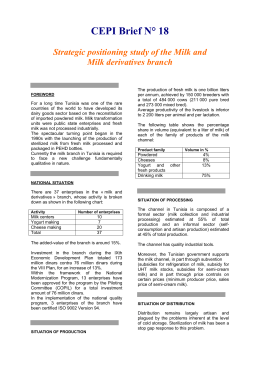
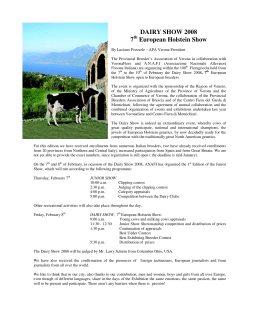
SEDE AMMINISTRATIVA: UNIVERSITÀ DEGLI STUDI DI PADOVA
DIPARTIMENTO DI AGRONOMIA ANIMALI ALIMENTI RISORSE NATURALI E
AMBIENTE
SCUOLA DI DOTTORATO DI RICERCA IN SCIENZE ANIMALI E AGROALIMENTARI
INDIRIZZO: PRODUZIONI AGROALIMENTARI
CICLO XXVII
PHENOTYPIC AND GENETIC ASPECTS
OF BOVINE MILK TECHNOLOGICAL TRAITS
PREDICTED BY MID-INFRARED SPECTROSCOPY
Direttore della Scuola: Ch.ma Prof.ssa Viviana Corich
Supervisore: Ch.mo Prof. Martino Cassandro
Dottoranda: Valentina Toffanin
CONTENTS
RIASSUNTO
p. 5
ABSTRACT
p. 7
GENERAL INTRODUCTION
p. 9
AIMS OF THE THESIS
p. 15
CHAPTER 1.
p. 17
De Marchi M, Toffanin V, Cassandro M and Penasa M 2014. Invited review:
Mid-infrared spectroscopy as phenotyping tool for milk traits. Journal of Dairy
Science 97:1171-1186.
CHAPTER 2.
p. 53
De Marchi M, Toffanin V, Cassandro M and Penasa M 2013. Prediction of
coagulating
and
noncoagulating
milk
samples
using
mid-infrared
spectroscopy. Journal of Dairy Science 96:4707–4715.
CHAPTER 3.
p. 75
Toffanin V, De Marchi M, Lopez-Villalobos N and Cassandro M 2015.
Effectiveness of mid-infrared spectroscopy for prediction of the contents of
calcium and phosphorus, and titratable acidity of milk and their relationship
with milk quality and coagulation properties. International Dairy Journal
41:68-73.
CHAPTER 4.
p. 95
Toffanin V, Penasa M, McParland S, Berry DP, Cassandro M and De Marchi
M. Genetic parameters for milk mineral content and acidity predicted by midinfrared spectroscopy in Holstein-Friesian cows. Accepted for publication to
Animal.
GENERAL CONCLUSIONS AND PERSPECTIVES
p. 115
LIST OF PUBLICATIONS
p.117
RIASSUNTO
Tra i Paesi dell’Europa-28, l’Italia è il primo produttore di formaggi a Denominazione
di Origine Protetta (DOP); di conseguenza, l’industria casearia riveste un ruolo centrale nei
settori agricolo e alimentare italiani. Circa il 70% del latte disponibile in Italia viene utilizzato
per la produzione di formaggio e il 35% è trasformato in prodotto DOP.
Negli ultimi anni, vi è stata una crescita dell’interesse per il latte e i suoi derivati,
specialmente per le loro caratteristiche tecnologiche e nutrizionali. Le proprietà coagulative
del latte, la sua acidità titolabile e il suo contenuto minerale sono al momento gli argomenti
maggiormente discussi e studiati a livello d’industria casearia e di ricerca. L’attitudine
casearia, che comprende il tempo di coagulazione (RCT, min), il tempo di rassodamento (k20,
min) e la consistenza del coagulo (a30, mm), influenza l’efficienza dell’intero processo
produttivo. L’acidità titolabile gioca un ruolo fondamentale sulla velocità di aggregazione
delle micelle para-caseiniche e sineresi e sulla reattività del caglio. Infine, la composizione
minerale del latte riveste importanza sia a livello tecnologico, influenzando il processo di
produzione casearia, sia sulla salute umana.
L’obiettivo generale della presente tesi di dottorato è stato quello di studiare gli aspetti
fenotipici e genetici delle proprietà coagulative del latte, della sua acidità titolabile e del suo
contenuto minerale, predicendo questi parametri attraverso la spettroscopia del medio
infrarosso (MIRS).
Nel primo capitolo si è analizzata la bibliografia inerente alla tecnologia MIRS applicata
all’analisi del latte ed è stata riscontrata la capacità del MIRS nel predire, con differenze a
livello di accuratezza, gli acidi grassi del latte, la sua composizione proteica e minerale, le
MCP, la sua acidità, i corpi chetonici e lo stato energetico della vacca e le emissioni di
metano. In generale, gli articoli analizzati hanno evidenziato come la variabilità dei dati, i
metodi di riferimento e le unità di misura influenzino notevolmente la robustezza dei modelli
di predizione. Un punto cruciale a favore dell’applicazione del MIRS è il possibile scambio di
dati tra diversi Paesi al fine di sviluppare equazioni che tengano conto della variabilità
biologica dei parametri in base alle differenti condizioni. Data la grande variabilità dei metodi
di analisi di riferimento utilizzati per le calibrazioni MIRS, sembra essenziale una
standardizzazione di questi tra i diversi Paesi.
Nel secondo capitolo si è studiata la capacità del MIRS di predire i latti che non
coagulano e i risultati ottenuti hanno dimostrato che a livello spettrale non vi è una specifica
informazione che permetta una distinzione a priori tra questo tipo di campioni e quelli che
5
coagulano. Il modello di predizione più accurato si è ottenuto per il tempo di coagulazione del
latte, seguito da quelli per il tempo di rassodamento e coesistenza del coagulo a 30 minuti.
Nel terzo capitolo si sono sviluppati i modelli di predizione MIRS per il contenuto di
calcio (Ca) e fosforo (P) del latte e per la sua acidità titolabile (TA), ottenendo risultati
soddisfacenti: per tutti e tre i parametri è stato ottenuto un coefficiente di correlazione in
cross-validazione maggiore di 0.73. Inoltre, sono state rilevate delle correlazioni favorevoli tra
questi caratteri e le proprietà coagulative del latte.
Infine, nel quarto e ultimo contributo, è stata dimostrata l’esistenza di una varianza
genetica additiva per Ca, P e TA predetti col MIRS, per i quali si sono stimate ereditabilità
pari a 0.10, 0.12 e 0.26, rispettivamente. Inoltre, tra i tre suddetti caratteri sono state stimate
correlazioni fenotipiche da moderate a forti, mentre da deboli a moderate tra essi e la
composizione qualitativa e quantità del latte.
La presente tesi di dottorato ha dimostrato come la tecnologia MIRS possa essere
un utile strumento per predire le proprietà coagulative, l’acidità titolabile e il contenuto
minerale del latte. La possibilità di sfruttare il MIRS su vasta scala e l’esistenza di una
base genetica per i caratteri precedentemente menzionati, rappresentano un punto di
partenza per definire specifici programmi genetici per il miglioramento delle
caratteristiche tecnologiche e nutrizionali del latte.
6
ABSTRACT
Italy is the first producer of Protected Designation of Origin (PDO) cheeses in Europe-28,
and thus the dairy industry plays a central role in the agriculture and food sectors. About 70%
of available milk in Italy is used for cheese production and 35% is transformed into PDO
products.
In the last few years, the interest for milk and dairy products has grown, especially in
relation to their technological and healthy features. Coagulation properties, titratable acidity
(TA) and mineral content of milk are among the main topics discussed at research and dairy
industry level. Milk coagulation properties (MCP), namely rennet coagulation time (RCT),
curd firming time (k20) and curd firmness (a30), influence the efficiency of cheese-making
process. TA plays a fundamental role in the aggregation rate of para-casein micelles, reactivity
of rennet, and rate of syneresis. Finally, mineral composition of milk has an impact on human
bone health and on milk technological properties, which affects cheese-making process.
The overall aim of the present work was to study the phenotypic and genetic aspects of
coagulation traits, mineral content and acidity of bovine milk predicted by mid-infrared
spectroscopy (MIRS).
The analysis of the literature (Chapter 1) demonstrated the feasibility of MIRS to predict
milk fatty acid, protein and mineral composition, MCP, acidity, ketone bodies, body energy
status, and methane emissions, with different accuracies and improvement of prediction
equations. In general, the reviewed papers underlined the influence of data variability,
reference method, and unit of measurement on the development of robust models. A crucial
point in favour of the application of MIRS is to stimulate the exchange of data among
countries to develop equations that take into account the biological variability of the traits
under different conditions. Due to the large variability of reference methods used for MIRS
calibration, it is essential to standardize the methods within and between countries.
Chapter 2 investigated the ability of MIRS to predict not coagulating (NC) from
coagulating milks. Results showed that there is no specific spectral information that
distinguishes NC from coagulating samples. The most accurate prediction model was
developed for RCT followed by k20 and a30.
Mid-infrared models to predict calcium (Ca), phosphorus (P) and TA were developed in
Chapter 3 and results were satisfactory: coefficients of correlation of cross-validation for CA,
P and TA were greater than 0.73. Moreover, favourable relationships of these traits with MCP
were estimated.
7
Exploitable additive genetic variation for predicted Ca, P, and TA exists (Chapter 4) and
heritability estimates were 0.10, 0.12, and 0.26 for Ca, P and TA, respectively. Positive
moderate to strong phenotypic correlations were estimated between Ca, P and TA, while
phenotypic weak to moderate correlations were assessed between these traits with both milk
quality and yield. Moderate to strong genetic correlations existed between Ca, P, and TA, and
between these predicted traits with both milk fat and protein percentage.
The present thesis demonstrated that MIRS might be used as phenotyping tool to predict
MCP, mineral content and acidity of milk. The feasibility of using MIRS on a large scale
coupled with the existence of a genetic basis for the aforementioned predicted features,
represent the starting point to set up specific genetic programs to improve these nutritional
and technological characteristics of milk.
8
GENERAL INTRODUCTION
Milk production is growing worldwide and the most productive countries are the
European Union (EU-28), United States of America (USA), New Zealand and Australia,
which have increased their production of about 5% during the last year (Ismea, 2014). Within
the EU-28, a global trend of increase (2%) was registered between April 2013 and February
2014, with differences across European countries: the highest increase was shown in Belgium
and the Netherlands, while Sweden and France exhibited the lowest (Ismea, 2014). Moreover,
the major producers of European milk remain Germany, France, United Kingdom, Poland, the
Netherlands and Italy (Eurostat, 2014).
The EU-28 is the main exporter of cheese worldwide, with about 790 tonnes in 2013
(Ismea, 2014). Within EU-28, the Italian dairy industry is very important; about 70% of
available milk is used for cheese production and 35% is transformed into Protected
Designation of Origin (PDO) products (Pieri, 2011). Italy is the first producer of PDO cheeses
in EU-28 (Ismea, 2014). Therefore, in the last years, milk and dairy products have been widely
studied for their technological and healthy features.
Milk technological traits
The technological ability of milk for cheese production can be established by milk
coagulation properties (MCP) measurements. Milk coagulation properties are defined as
rennet coagulation time (RCT), curd-firming time (k20) and curd firmness (a30) (Summer et
al., 2002). The RCT measures the time in minutes between the rennet addition to milk and the
occurrence of the first coagulum, the k20 the time in minutes to achieve 20 millimetres of curd
and a30 the thickness millimetres of curd obtained 30 minutes after the rennet addition. These
characteristics are the result of interactions between different milk features as acidity, mineral
contents, protein polymorphisms and breed, stage of lactation and parity of cows (Summer et
al., 2002; Malacarne et al., 2013; De Marchi et al., 2007). Moreover, the MCP are also
influenced by laboratory conditions like instrument setup, type, reproducibility and
repeatability and pre-treatments of milk samples (Pretto et al. 2011). In several studies a
heritable additive genetic variance of MCP was reported (Ikonen et al., 1997, 1999; Cassandro
et al., 2008), therefore an improving of cheese yield seems to be possible through the genetic
selection of cows which show better MCP (Ikonen et al., 2000).
As previous explained the cheese-making process is also highly influenced by the
acidity of milk: pH and titratable acidity (TA) affect the starting enzymatic phases and the
9
following aggregation rate of para-casein micelles, reactivity of rennet, and rate of syneresis
(Formaggioni et al., 2001). In literature, different authors investigated the effect of acidity
changes on milk rheological properties of milk, reporting strong relationships between milk
acidity and optimal or late-non-coagulating samples of milk. Malacarne and colleagues (2013)
declared that non-coagulating samples are characterised by high values of pH and low of TA,
while the opposite behaviour of acidity traits represent good coagulating milks. Moreover,
Ikonen et al. (2004) and Cassandro et al. (2008) reported positive correlations between pH and
RCT. In this studies moderate heritability estimates for pH and TA of milk were reported,
suggesting an achievable genetic improvement of them.
Another technological aspect of milk is represented by its mineral composition. Fossa et
al. (1994) reported that the milk ability to coagulate and the final consistency of the coagulum
are strongly influenced by calcium (Ca) and phosphorus (P) content. In particular, the
colloidal Ca phosphate affects the paracaseinate particles’ aggregation speed and the casein
reticulum’s properties (Mariani et al., 1996). Milk minerals play a key role on the human
health. Calcium provides rigidity to the skeleton by virtue of its phosphate salts and takes part
in neuromuscular function, enzyme-mediated processes and blood clotting. Moreover, during
skeletal growth the increase of bone mineral density is affected by an adequate Ca intake,
while during old age this element prevents bone loss and osteoporotic fractures. The principal
disease referred to a Ca (and vitamin D) deficiency is osteoporosis (Caroli et al., 2011), which
has been defined by the Consensus Development Conference (1993) as “a systemic skeletal
disease characterized by low bone mass and micro-architectural deterioration of bone tissue,
with a consequent increase in bone fragility and susceptibility to fracture”. Cashman et al.
(2006) summarized results on the effects of phosphorus on human health: in particular, the Ca
to P ratio is very important as a high concentration of P combined to a low amount of Ca
seems to be responsible of a stimulation of parathyroid hormone (PTH) with an eventual
reduction of bone mass and density, especially in young people.
Mid-infrared spectroscopy
Over the years, the need of cheap, fast and high-throughput chemical analysis methods
widely increased in dairy sector, therefore a powerful technique as mid-infrared spectroscopy
(MIRS) has become more and more relevant. Several studies were conducted on the
application of MIRS to milk analyses (De Marchi et al., 2014), investigating this technology
as alternative method of milk analysis and attaining promising and satisfactory results. Midinfrared spectroscopy is an indirect method of analysis given its functioning: it’s based on the
10
study of the interaction between matter and electromagnetic waves in mid-infrared region
(2500 - 25000 nm), and it includes statistical and mathematical treatments for each specific
traits calibration and validation procedure. Recently, mid-infrared spectroscopy (MIRS) has
been proposed as a valid tool for the prediction of innovative milk phenotypes as MCP, TA
(Dal Zotto et al., 2008; De Marchi et al., 2009) and minerals (Soyeurt et al., 2009). The MIRS
technology is used in routine milk recording programs of different countries for determining
traditional milk quality traits such as milk fat, protein, casein and lactose content. Therefore,
the developments of robust MIRS prediction models for innovative milk phenotypes could
permit their implementation on MIRS instruments present in milk laboratories, allowing the
rapid and simultaneous recording of large amount of different data. The use of MIRS to
predict milk phenotypes has relevant genetic implications. Berry et al. (2012) reported that a
phenotype should be easily, routinely and cheaply measured, and they endorsed MIRS
technique given its possible optimal accuracy of prediction, exhibition of genetic variation and
high genetic correlations with traits of interest. The genetic implications of applying MIRS at
population level were also inferred by Cecchinato et al. (2009) who concluded that for their
studied traits (RCT and a30) the selection using MIRS predictions as indicator traits can ensure
a genetic response equal to or slightly lower than to those achievable through actual analysis
of the traits.
11
REFERENCES
Berry, D. P., A. R. Cromie, N. McHugh, M. Burke, T. Pabiou, J. MacCarthy, J. F. Kearney, F.
Buckley, R. D. Evans, D. Purfield, J. M. Coyne, B. W. Wickham, J. J. Crowley, and S.
McParland. 2012. New traits for dairy cattle breeding. In 38th International Committee
for Animal Recording (ICAR) Meeting, Cork, Ireland, 28th May – 1st June 2012.
http://www.icar.org/Cork_2012/Manuscripts/Published/Berry.pdf
Caroli, A., A. Poli, D. Ricotta, G. Banfi, and D. Cocchi. 2011. Invited review: Dairy intake
and bone health: A viewpoint from the state of the art. J. Dairy Sci. 94:5249–5262.
Cashman, K. D. 2006. Milk minerals (including trace elements) and bone health. Int. Dairy J.
16:1389–1398.
Cassandro, M., A. Comin, M. Ojala, R. Dal Zotto, M. De Marchi, L. Gallo, P. Carnier, and G.
Bittante. 2008. Genetic parameters of milk coagulation properties and their relationships
with milk yield and quality traits in Italian Holstein cows. J. Dairy Sci. 91:371–376.
Cecchinato, A., M. De Marchi, L. Gallo, G. Bittante, and P. Carnier. 2009. Mid-infrared
spectroscopy predictions as indicator traits in breeding programs for enhanced
coagulation properties of milk. J. Dairy Sci. 92:5304–5313.
Consensus Development Conference. 1993. Consensus Development Conference: Diagnosis,
prophylaxis and treatment of osteoporosis. Am. J. Med. 94:646-650.
Dal Zotto, R., M. De Marchi, A. Cecchinato, M. Penasa, M. Cassandro, P. Carnier, L. Gallo,
and G. Bittante. 2008. Reproducibility and repeatability of measures of milk coagulation
properties and predictive ability of mid-infrared reflectance spectroscopy. J. Dairy Sci.
91:4103–4112.
De Marchi, M., C. C. Fagan, C. P. O’Donnell, A. Cecchinato, R. Dal Zotto, M. Cassandro, M.
Penasa, and G. Bittante. 2009. Prediction of coagulation properties, titratable acidity,
and pH of bovine milk using mid-infrared spectroscopy. J. Dairy Sci. 92:423–432.
De Marchi, M., R. Dal Zotto, M. Cassandro, and G. Bittante. 2007. Milk coagulation ability of
five dairy cattle breeds. J. Dairy Sci. 90:3986–3992.
De Marchi, M., V. Toffanin, M. Cassandro and M. Penasa. 2014. Invited review: Mid-infrared
spectroscopy as phenotyping tool for milk traits. J. Dairy Sci. 97:1171-1186.
Eurostat,
2014.
Accessed
Nov.
25,
2014.
http://epp.eurostat.ec.europa.eu/tgm/refreshTableAction.do?tab=table&plugin=0&pcode
=tag00037&language=en.
12
Formaggioni, P., M. Malacarne, A. Summer, E. Fossa, and P. Mariani. 2001. Milk with
abnormal acidity. VI. The role of phosphorus content and the rennet-coagulation
properties of Italian Friesian herd milks. Ann. Fac. Med. Vet. Univ. Parma 21:261–268.
Fossa, E., M. Pecorari, S. Sandri, F. Tosi, and P. Mariani. 1994. Il ruolo del contenuto in
caseina del latte nella produzione del Parmigiano-Reggiano: Composizione chimica,
caratteristiche di coagulazione e comportamento tecnologico-caseario del latte. Sci.
Tecn. Latt. Cas. 45:519–535.
Ikonen, T. 2000. Possibilities of genetic improvement of milk coagulation properties of dairy
cows.
PhD
Diss.
Univ.
Helsinki,
Finland.
http://ethesis.helsinki.fi/julkaisut/
maa/kotie/vk/ikonen.
Ikonen, T., K. Ahlfors, R. Kempe, M. Ojala, and O. Ruottinen. 1999. Genetic parameters for
the milk coagulation properties and prevalence of noncoagulating milk in Finnish dairy
cows. J. Dairy Sci. 82:205-214.
Ikonen, T., M. Ojala, and E.L. Syvaoja. 1997. Effects of composite casein and betalactoglobulin genotypes on renneting properties and composition of bovine milk by
assuming an animal model. Agric. Food Sci. Finland 6:283– 294.
Ikonen, T., S. Morri, A.M. Tyrisevä, O. Ruottinen, and M. Ojala. 2004. Genetic and
phenotypic correlations between milk coagulation properties, milk production traits,
somatic cell count, casein content, and pH of milk. J. Dairy Sci. 87:458-467.
ISMEA. 2014. Tendenze Lattiero Caseario. Trimestrale Ismea di analisi e previsioni per i
settori
agroalimentari.
I
Trimestre
2014.
n.2/2014.
http://www.ismeaservizi.it/flex/cm/pages/ServeBLOB.php/L/IT/IDPagina/3635 .
Malacarne, M., P. Franceschi, P. Formaggioni, S. Sandri, P. Mariani, and A. Summer. 2013.
Influence of micellar calcium and phosphorus on rennet coagulation properties of cows
milk. J. Dairy Res. 81:1-8.
Mariani, P., G. Zanzucchi, and A. Summer. 1996. Contenuto di fosfato di calcio colloidale e
grado di “mineralizzazione” della caseina in campioni di latte di massa di allevamenti
bovini di razza Frisona. L’Industria del Latte 32:3–16.
O’Callaghan, D. J., C. P. O’Donnell, and F. A. Payne. 2002. Review of systems for
monitoring curd setting during cheesemaking. Int. J. Dairy Technol. 55:65–74.
Pieri, R. 2011. Il Mercato del Latte. Rapporto 2011. Milano. Franco Angeli, 232-234.
13
Pretto, D., T. Kaart, M. Vallas, I. Jõudu, M. Henno, L. Ancilotto, M. Cassandro, and E. Pärna.
2011. Relationships between milk coagulation property traits analyzed with different
methodologies. J. Dairy Sci. 94:4336–4346.
Soyeurt, H., D. Bruwier, J.-M. Romnee, N. Gengler, C. Bertozzi, D. Veselko, and P.
Dardenne. 2009. Potential estimation of major mineral contents in cow milk using midinfrared spectrometry. J. Dairy Sci. 92:2444–2454.
Summer, A., M. Malacarne, F. Martuzzi, and P. Mariani. 2002. Structural and functional
characteristics of Modenese cow milk in Parmigiano-Reggiano cheese production. Ann.
Fac. Med. Vet. Univ. Parma 22:163–174.
14
AIMS OF THE THESIS
The possibility to reduce time and cost of milk analyses is increasingly required by the
dairy industry and MIRS seems to reply to this need. The general aim of the present thesis
was to investigate the phenotypic and genetic aspects of coagulation traits, mineral
content and acidity of bovine milk predicting these features by MIRS. The four chapters
aimed to:
1.
review papers which have investigated the use of MIRS to predict milk quality,
nutritional and technological traits, and other features of economic relevance;
2.
investigate the capability of MIRS to predict coagulating and not-coagulating milk in
dairy cows;
3.
investigate the effectiveness of MIRS in predicting milk Ca, P and TA using different
statistical approaches and to study variation of Ca, P, and TA in individual milk of
Italian Holstein-Friesian cows and their relationship with milk quality and
coagulation properties;
4.
estimate genetic parameters for milk Ca, P and TA predicted by MIRS and genetic
correlations of these traits with milk production and quality in Italian HolsteinFriesian cows.
15
16
CHAPTER 1
Invited review: Mid-infrared spectroscopy as phenotyping tool for milk traits
De Marchi M, Toffanin V, Cassandro M and Penasa M
Journal of Dairy Science (2014) 97:1171-1186
17
18
ABSTRACT
Interest in methods that routinely and accurately measure and predict animal
characteristics is growing in importance, both for quality characterization of livestock
products and for genetic purposes. Mid-infrared spectroscopy (MIRS) is a rapid and costeffective tool for recording phenotypes at the population level. Mid-infrared spectroscopy is
based on crossing matter by electromagnetic radiation and on the subsequent measure of
energy absorption, and it is commonly used to determine traditional milk quality traits in
official milk laboratories. The aim of this review was to focus on the use of MIRS to predict
new milk phenotypes of economic relevance such as fatty acid and protein composition,
coagulation properties, acidity, mineral composition, ketone bodies, body energy status, and
methane emissions. Analysis of the literature demonstrated the feasibility of MIRS to predict
these traits, with different accuracies and with margins of improvement of prediction
equations. In general, the reviewed papers underlined the influence of data variability,
reference method, and unit of measurement on the development of robust models. A crucial
point in favour of the application of MIRS is to stimulate the exchange of data among
countries to develop equations that take into account the biological variability of the studied
traits under different conditions. Due to the large variability of reference methods used for
MIRS calibration, it is essential to standardize the methods used within and across countries.
Key words: mid-infrared spectroscopy, phenotyping, quality trait, dairy cattle.
INTRODUCTION
In the genomic era, phenomics is becoming a compulsory research field. This new
science is concerned with the acquisition of phenotypic data on a large scale (Houle et al.,
2010) and the phenotype can be described as the outcome of the interacting development
between the genotype of an individual and its specific environment throughout life (Bowman,
1974). The interest in methods that routinely and accurately measure and predict animal
characteristics (i.e., phenotypes) is rapidly growing. Accurate phenotypes and efficient
phenotyping tools are the key ingredients, especially for genomic selection of livestock
animals, which is expected to increase the genetic gain of the selected traits (Pryce et al.,
2010; Lillehammer et al., 2011; Mc Hugh et al., 2011).
Furthermore, in recent years, consumers and the dairy industry have shifted the
concept of quality in relation to market requirements: for example, milk coagulation traits
have been studied to improve cheese production and FA composition to enrich the nutritional
19
value of milk for human health. Breeding goals have followed these changes: if phenotypes
are accurately and cheaply measured at the population level and integrated in the national milk
recording systems, it may be possible to enhance the traits using genetic or genomic tools.
The need for fast, cheap, and high-throughput methods of chemical analysis has also
led to the application of infrared spectroscopy in both the livestock and food sectors. The
spectroscopic technique is based on the study of the interaction between matter and
electromagnetic waves. Electromagnetic radiation comprises different regions according to the
following wavelengths: the xray region (0.5–10 nm), UV region (10–350 nm), visible region
(350–800 nm), near-infrared region (800–2,500 nm), mid-infrared region (2,500–25,000 nm),
microwave region (100 μm–1 cm), and radio frequency region (1 cm–1 m).
One of the most important historical events for the spectroscopic technique was the
development of the Fourier transform in the 1700s; in later years, this mathematical transform
was improved with the use of the interferometer. In 1969, Digilab Inc. (Marlborough, MA)
put the first Fourier-transform infrared spectro-photometer with a dedicated minicomputer on
the market, which was later refined in 1983 by the same company (Spectra-Tech Inc., Oak
Ridge, TN). From the 1980s, Fourier-transform infrared spectrophotometers were combined
with personal computers and this method of analysis became widely used due to its versatility
and cost effectiveness. Since then, many studies have investigated the relationships between
spectra wavelengths and several quality traits through the explanation of chemical bond
variations.
Mid-infrared spectroscopy (MIRS) has been evaluated as a potential tool to collect
data at the population level for phenotypic and genetic purposes, and it is becoming one of the
major topics in dairy science. In the mid-infrared region, when matter is crossed by
electromagnetic radiation, the bonds of the molecules make movements (e.g., vibration and
rotation), which involve a more or less marked absorption of the provided energy. On the
basis of supplied energy and the amount absorbed by the irradiated sample, and using spectra
mathematical pretreatments, it is possible to determine the sample’s chemical composition
and correlated compounds (Figure 1).
The present review summarizes papers that have investigated the use of MIRS to
predict milk quality traits. Furthermore, studies that adopted this technique to predict
nutritional, technological, and other traits of economic relevance are also reviewed.
20
PHENOTYPING OF MILK BY MIRS
Studies that aimed at investigating the effectiveness of MIRS to predict phenotypes for
dairy industry applications or for genetic purposes have markedly increased over the years.
Figure 2 depicts the trend in the number of papers published from 2001 to 2013 on the
application of MIRS to milk, highlighting a growing interest for the topic, particularly in the
last 3 yr. This is confirmed also by large international research projects that aimed at
predicting new traits in the dairy industry (e.g., OptiMIR, 2012; RobustMilk, 2012). In animal
science, phenomics is mainly related to the study of phenotypes of an individual. A phenotype
should be routinely, cheaply, and easily measurable, should show good to optimal accuracy of
prediction, depending on its use, and should exhibit genetic variation or, if it is a predictor of
the real phenotype of interest, high genetic correlation with the trait of interest (Berry et al.,
2012).
Currently, MIRS is used to determine quality traits in bulk and individual milk
samples. In particular, most countries use MIRS in official milk-recording schemes to predict
protein, casein, fat, lactose, and urea contents. Besides these traditional traits, MIRS has been
used to predict other milk characteristics: FA composition (Soyeurt et al., 2006, 2008, 2011;
Rutten et al., 2009; De Marchi et al., 2011; Ferrand et al., 2011; Maurice-Van Eijndhoven et
al., 2013), milk protein composition (Luginbuhl, 2002; Sorensen et al., 2003; Etzion et al.,
2004; De Marchi et al., 2009a; Bonfatti et al., 2011; Rutten et al., 2011), milk coagulation
properties (MCP; Dal Zotto et al., 2008; De Marchi et al., 2009b, 2013), milk acidity (De
Marchi et al., 2009b), mineral composition (Soyeurt et al., 2009), melamine content (Balabin
and Smirnov, 2011), ketone bodies (Heuer et al., 2001; de Roos et al., 2007; van Knegsel et
al., 2010; van der Drift et al., 2012), body energy status (McParland et al., 2011), and methane
emissions (Dehareng et al., 2012).
In addition, several laboratories involved in routine milk-recording systems have been
storing spectral data to predict a posteriori several phenotypes; this approach is very
interesting for genetic purposes.
SPECTRA PRETREATMENTS
Pretreatments of MIRS spectral data are very common and often of great importance to
obtain robust prediction models (Rinnan et al., 2009). The main goal of using statistical
procedures for preprocessing spectral data is to improve the linear relationship between the
spectra and the gold reference. As reported by Rinnan et al. (2009), several phenomena can
21
cause a deviation from the aforementioned linear relation: scatter from particulates, molecular
interactions, and changes in sample size. The most common preprocessing techniques for
MIRS data are those that directly use available reference values, such as scatter correction and
derivation methods. The scatter correction methods include multiplicative scatter correction,
standard normal variate, and normalization. Regarding the derivation methods, the most
commonly used is the Savitzky-Golay derivative.
Briefly, multiplicative scatter correction aims at removing nonlinearities in the spectral
data caused by scatter from particulates in the samples (Martens et al., 1983) and this is very
similar in result to standard normal variate (Rinnan et al., 2009). Figure 1 depicts the variation
of spectra peaks moving from untreated data to first and second derivatives. The main benefits
of the use of derivative spectra pretreatments are to improve the resolution of the spectra (first
derivative) and to give a negative peak for each band and shoulder (second derivative); the
most common derivatives used for these purposes were developed by Savitzky and Golay
(1964). Generally, the sharp bands are enhanced at the expense of broad ones (Figure 1) and
this may allow for the selection of suitable peaks (Stuart, 2004).
Despite mathematical pretreatments being widely used in the building of MIRS
prediction models, the authors usually report only the best model with the related
mathematical method and, hence, the comparison among different mathematical pretreatments
is not possible. Only Soyeurt et al. (2011) and De Marchi et al. (2011) investigated the
variation in the accuracy of MIRS prediction models for FA composition using different
mathematical pretreatments; they found quite similar results, showing better accuracies using
derivative pretreatment than untreated spectral data. In a similar manner, De Marchi et al.
(2009b) investigated the effect of different spectra pretreatments for the prediction of MCP
and they found better accuracies using untreated spectral data; this has been recently
confirmed by De Marchi et al. (2013).
FITTING STATISTICS OF CHEMOMETRIC ANALYSIS
Partial least squares (PLS) modelling is a powerful multivariate statistical tool that has
been widely applied to the quantitative spectral analyses of MIRS and near-infrared data (De
Marchi et al., 2012; Riovanto et al., 2012). Because several software packages using the PLS
technique are available, it is important to understand how chemometric results can be
compared. Several statistic parameters exist that can be used to assess the goodness of PLS
models both in calibration and validation (Nas et al., 2002). Reference statistics are the
22
validation ones, which are calculated after the development of the calibration equation; they
are essential in determining the ability of calibration models to predict unknown values. The
most important parameters are the coefficient of determination and standard error of
calibration and validation, the relative ability of prediction, ratio to performance deviation
(RPD), range error ratio (RER), relative prediction error (RPE), and concordance correlation
coefficient (CCC; Williams and Norris, 2001; Williams, 2003).
The coefficient of determination in calibration (R2C) and validation (1 − VR, where
VR = variance ratio) are calculated as the square of the correlation coefficient between the
reference values and their corresponding predicted values obtained using calibration and
validation sets. The coefficient of determination in validation depends on the validation
technique: (1) use of an external data respect to calibration set or (2) cross-validation on
calibration data according to Stone (1974).
The standard error is essential to determine the ability of the calibration equation to
predict unknown values as good calibration equations have small standard errors. Three types
of standard error exist: (1) standard error of calibration, which is obtained by testing the
calibration equation directly on calibration data and it is usually a highly over-optimistic
estimate of the prediction ability; (2) standard error of external validation (SEP), which is
based on splitting the data set into 2 subsets, one for calibration and the other for validation;
and (3) standard error of cross-validation, based on the previously described cross-validation
technique (Williams and Norris, 2001; Sivakesava and Irudayaraj, 2002; Williams, 2003).
During the development of calibration models, the SEP is used for determining the optical
number of components (#L); usually the SEP is large when #L is low and decreases as #L
increases. Partial least squares models allow the selection of appropriate #L to model as much
of the complexity of the system without overfitting the data (Haaland and Thomas, 1988; Nas
et al., 2002). The relative ability of prediction is defined as a variant of the correlation
coefficient and it aims at correcting the standard correlation for the variance of error in the
calibration set (Hildrum et al., 1983).
The RPD, RER, RPE, and CCC provide information on the practical utility of
prediction models and allow the comparison of models among different studies. The RER is
calculated by dividing the range of a given parameter by the standard error in validation;
models with RER values lower than 3 have little practical utility, values between 3 and 10
have limited to good practical utility, and values greater than 10 have high utility (Williams,
1987). The RPD is calculated by dividing the standard deviation and standard error in
23
validation of a given trait; values of RPD greater than 10 are considered equivalent to
reference methods, whereas values larger than 2 are considered adequate for analytical
purposes (Karoui et al., 2006). As reported by Fuentes-Pila et al. (1996) and Lopez-Villalobos
et al. (2009), RPE values lower than 10% indicate satisfactory predictions, from 10 to 20%
indicate relatively acceptable predictions, and larger than 20% indicate poor predictions.
Regarding the CCC, values from 0.81 to 1.00 indicate perfect prediction ability, from 0.61 to
0.80 substantial prediction ability, from 0.41 to 0.60 moderate prediction ability, and from
0.21 to 0.40 fair prediction ability (Lin, 1989; Lopez-Villalobos et al., 2009).
FA COMPOSITION OF MILK
Milk fat and FA composition are important quality traits, as they influence the sensory
attributes, technological properties, and nutritional value of milk, and are related to human
health. Bovine milk contains 70% SFA, 25% MUFA, and 5% PUFA (Grummer, 1991). The
daily intake of SFA from dairy products has great relevance for the consumer (Chilliard et al.,
2001) and the effects of variation of SFA, MUFA, and PUFA content in the diet on human
health have been widely described (Mensink and Katan, 1992; German et al., 2009), along
with the role of conjugated linoleic acid. Furthermore, FA composition influences the
technological traits of butter, such as the spreadability (MacGibbon and McLennan, 1987).
Therefore, feeding and breeding strategies to favourably alter the FA composition of bovine
milk could be very beneficial. Recently, Lopez-Villalobos (2012) reviewed the genetic basis
of FA and reported moderate heritability for FA, suggesting that the improvement of these
traits through selection is feasible.
In recent years, several authors have attempted to predict FA and groups of FA (GFA)
using MIRS (Table 1). Studies were conducted using (1) different numbers of samples, (2)
different spectra pretreatments, (3) different reference methods, and (4) different units of
measures of FA and GFA. The number of milk samples used to build prediction models for
FA and GFA ranged from 49 to 3,622 (Table 1) and influenced the PLS analysis, in particular
the validation procedures (cross-validation vs. independent validation). The cross-validation
procedure has been used for a limited number of samples, as reported by Soyeurt et al. (2006,
2008) and De Marchi et al. (2011); however, independent validation is more commonly used
(Rutten et al., 2009; Ferrand et al., 2011; Soyeurt et al., 2011; Maurice-Van Eijndhoven et al.,
2013). These studies were conducted on individual milk samples, mostly collected on
different cow breeds; only De Marchi et al. (2011) used milk samples from a single breed and
24
reported difficulties in developing MIRS prediction models for several FA due to the limited
range of variation of these compounds.
Concerning the methods of spectra preprocessing, most studies have been conducted
on untreated spectral data or, to a less extent, using first-derivative spectra pretreatment.
Soyeurt et al. (2011) and De Marchi et al. (2011) investigated the variation in the accuracy of
MIRS prediction models using different mathematical pretreatments; they reported quite
similar results, with better accuracies of prediction models using derivative pretreatment with
respect to untreated spectral data.
The reference method for the assessment of FA composition is based on 2 major
phases: fat extraction and gas chromatography analysis. The extraction procedure has been
conducted using 3 methods and gas chromatography using very different columns and
analytical conditions (Table 1). Because calibration models were carried out using different
spectral data, statistical procedures, and gold standard methods, the effect of reference method
on the accuracy of MIRS prediction models is not determinable.
The unit of measure of FA and GFA is another crucial point in the development of
accurate MIRS prediction models. Most studies expressed FA and GFA as the quantity per
unit of milk, and only Soyeurt et al. (2006) and Rutten et al. (2009) predicted FA composition
for FA expressed as quantity of total fat (Tables 2, 3, and 4). Both studies reported that, on
average, the accuracy of MIRS prediction models were better when FA and GFA were
expressed as quantity per unit of milk. This was also confirmed by De Marchi et al. (2011),
who reported that the prediction of FA using MIRS is the combined effect of predicting fat
content and fat composition. The prediction of FA is performed on milk samples, whereas
reference methods for FA determination are performed on fat extracted from milk, which
means that their relationship is affected also by the variation in fat percentage. Therefore, we
will hereafter focus on prediction models developed on FA and GFA expressed per unit of
milk. The difficulty of MIRS to predict FA when they are expressed on a fat basis represents a
limitation in the application of this technique; in fact, this information is essential when the
interest is to change only the fat composition (e.g., through selection). This situation
represents a critical point also in the case of protein, as described in the following section and
as previously reported by Rutten et al. (2011).
The accuracies of prediction models for SFA from different studies are reported in
Table 2. Overall, prediction models for C4:0, C6:0, C8:0, C10:0, C12:0, C14:0, and C16:0
showed high accuracy. Stearic acid (C18:0) had quite good predictability by MIRS, with 1 –
25
VR from 0.09 to 0.88. Only De Marchi et al. (2011) have attempted to predict C20:0, but with
unsatisfactory results (1 − VR of 0.29). Prediction models achieved better results for SFA than
unsaturated FA. Mid-infrared spectroscopy showed quite good potential to predict cis-9 C14:1
(1 − VR from 0.07 to 0.53), cis-9 C16:1 (1 − VR from 0.28 to 0.65), trans-11 C18:1 (1 – VR
from 0.31 to 0.63), and cis-9,cis-12,cis-15 C18:3 (1 − VR from 0.14 to 0.60; Table 3). Very
good results were obtained for C18:1 (1 − VR from 0.53 to 0.91) and cis-9 C18:1 (1 − VR
from 0.53 to 0.95). Only 3 studies have attempted to predict linolenic acid (cis-9,cis- 12,cis-15
C18:3), obtaining low to medium accuracy of prediction. Mid-infrared spectroscopy showed
medium potential to predict the 2 isomers of conjugated linoleic acid (cis-9,trans-11 C18:2
and cis-9,cis-12 C18:2; Table 3), with 1 − VR from 0.07 to 0.71 and a wide variability of
accuracy of prediction models.
Regarding the GFA, MIRS prediction models highlighted very good accuracies; SFA
and MUFA achieved 1 − VR up to 0.85 (Soyeurt et al., 2006, 2011; Ferrand et al., 2011;
Maurice-Van Eijndhoven et al., 2013), with the exception of De Marchi et al. (2011), who
reported 1 − VR of 0.52 and 0.55 for SFA and MUFA, respectively. Polyunsaturated FA were
not very well predicted by MIRS (1 − VR from 0.10 to 0.41); only Soyeurt et al. (2011) found
high 1 − VR for PUFA (0.81). Regarding the short-chain, medium-chain, and long-chain FA,
results were often very satisfactory, with 1 − VR up to 0.90 (Table 4). The notably better
results obtained by Soyeurt et al. (2011) could be related to (1) huge biological variability of
calibration data (milk samples were collected from different breeds, countries, and production
systems) and (2) statistical procedures that used several different mathematical pretreatments
of spectral data.
The accuracies of MIRS prediction models for major FA were better than for minor
FA; the relationship between FA content in milk and accuracy of prediction was discussed by
Soyeurt et al. (2006), Rutten et al. (2009), De Marchi et al. (2011), and Maurice-Van
Eijndhoven et al. (2013). In particular, Rutten et al. (2009) and De Marchi et al. (2011)
reported a strong relationship of FA concentration with 1 − VR and the RPD (which is the
ratio of the standard deviation to standard error of validation of the trait; Williams, 2001).
The accuracy of prediction models can be affected by the characteristics of the data set;
in particular, breed of cows, stage of lactation, and season of sampling are the main aspects to
take into consideration during sample collection (Rutten et al., 2009; Maurice- Van
Eijndhoven et al., 2013). Moreover, as reported by Soyeurt et al. (2011), the variation of
MIRS prediction accuracy is not only related to FA concentration but also to spectra
26
variability, the maximization of which is an effective way to improve the accuracy of
prediction.
In general, MIRS has widely demonstrated its potential to predict FA and GFA.
Nevertheless, milk composition of calibration data set plays a fundamental role in building
good prediction models. The development of MIRS prediction equations using milk selected
from different breeds, countries, and seasons, and the use of the same reference method seem
the best way to improve the accuracy and robustness of MIRS calibrations.
MILK COAGULATION PROPERTIES AND ACIDITY
The volume of milk destined for cheese manufacturing is growing worldwide and,
thus, the characteristics of milk related to cheese making, and cheese yield and quality are
relevant for the dairy industry. Milk coagulation properties, acidity, and protein composition
are important actors in cheese production (Aleandri et al., 1989; Wedholm et al., 2006; De
Marchi et al., 2009a; Pretto et al., 2013).
Milk clotting characteristics affect the efficiency of the cheese-making process. Milk
with good aptitude to coagulate after rennet addition and to form a firm curd has been
associated with increased cheese yield compared with milk that poorly reacts to the presence
of the enzyme (Bynum and Olson, 1982; Riddell-Lawrence and Hicks, 1989). Common
measures of MCP are rennet coagulation time (RCT; min), curd-firming time (k20; min), and
curd firmness (a30; mm). Several studies reported across-breed (Auldist et al., 2002, 2004; De
Marchi et al., 2007, 2008) and genetic variation of MCP, measured by reference mechanical
methods (Ikonen et al., 2004; Tyrisevä et al., 2004; Cassandro et al., 2008) and predicted by
MIRS (Cecchinato et al., 2009).
Prediction of MCP by MIRS has been investigated by Dal Zotto et al. (2008) and De
Marchi et al. (2009b, 2013; Table 5). Dal Zotto et al. (2008) and De Marchi et al. (2009b)
analysed individual cow milk samples using the computerized renneting meter (Polo Trade,
Monselice, Italy) as reference method, and they developed MIRS prediction models for RCT
and a30, and De Marchi et al. (2013) developed MIRS prediction models for MCP (including
k20) of samples that coagulated beyond 30 min from rennet addition, using the Formagraph
(Foss Electric A/S, Hillerod, Denmark) as a reference instrument. The best calibration models
were developed by De Marchi et al. (2013); according to Table 5, 1 − VR were 0.76, 0.72, and
0.76; the root mean square error of cross-validation (RMSEcv) were 7.05 min, 3.54 min, and
7.68 mm; and the RPD were 2.03, 1.86, and 1.80 for RCT, k20, and a30, respectively.
27
Results of De Marchi et al. (2013) on an extended testing time of analysis (60 min
instead of the typical 30 min) showed notably better prediction models for RCT and a30 than
those reported by Dal Zotto et al. (2008) and De Marchi et al. (2009b; Table 5). Moreover, De
Marchi et al. (2013) highlighted the potential of MIRS to predict k20, which is considered a
trait of great practical importance in the dairy industry, as it suggests the optimal time at
which curd-cutting should commence and, thus, it is related to product yield and quality
(Bynum and Olson, 1982). Nevertheless, the comparison of papers in the literature is difficult
because of different reference methods and the different types and concentrations of rennet
used. The role of different methodologies in the assessment of MCP was investigated by
Pretto et al. (2011), who proposed a method for the transformation of MCP obtained from
various methodologies, and by Cipolat-Gotet et al. (2012), who compared MCP determined
by Formagraph and by an optical instrument.
The prediction model for curd firmness 60 min after rennet addition was not
completely satisfactory, as 1 −VR, RMSEcv, and RPD for this trait were 0.40, 7.26 mm, and
1.26, respectively (De Marchi et al., 2013). The low accuracy of prediction might be related to
low accuracy of reference analysis for late-coagulating milk samples. This was previously
reported by Cipolat-Gotet et al. (2012), who found large variability for curd firmness
measured 45 min after rennet addition.
Finally, in most studies MIRS prediction models were developed using untreated
spectral data. This consisted with the results reported by De Marchi et al. (2009b) who
investigated the effect of different spectra pretreatments for the prediction of MCP, showing
better accuracies using untreated spectral data with respect to first- or second-derivative
pretreatments.
Concerning milk acidity, 2 main measures could be identified: pH and titratable acidity
(TA). Both traits are very important in cheese production. Titratable acidity is related to the
aggregation rate of paracaseinate micelles, the reactivity of rennet, and the rate of syneresis;
usually, milk with low values of TA (hypoacid milk) is considered unsuitable for cheese
making (Formaggioni et al., 2001). The pH of milk affects enzymatic and aggregation
reactions. De Marchi et al. (2009b) evaluated the potential of MIRS to predict TA and pH
(Table 5); results were quite satisfactory, as 1 − VR were 0.59 and 0.66, and RMSEcv were
0.07 and 0.25 Soxhlet-Henkel degrees (°SH)/50 mL for pH and TA, respectively. Quite
similar results were found by Colinet et al. (2010), who predicted TA with 1 – VR greater
than 0.90 and RPD of 3.13.
28
Overall, MIRS is a valid tool for predicting MCP and milk acidity of bovine milk and,
thus, it might be adopted in payment systems to reward or penalize producers of milk,
according to its clotting characteristics, as well as for breeding purposes (Tiezzi et al., 2013;
Penasa et al., 2014).
MILK PROTEIN COMPOSITION
Milk proteins have gained interest in dairy organizations worldwide mainly for their
role in cheese production. Several studies have dealt with the effects of milk protein
polymorphisms, in particular those of casein, on MCP (Comin et al., 2008; Heck et al., 2009;
Penasa et al., 2010) and cheese yield (Wedholm et al., 2006; Bonfatti et al., 2011).
Furthermore, milk proteins are relevant for some aspects related to human nutrition, such as
the release of peptides with biological function (Caroli et al., 2009). Lactoferrin is one of these
proteins and it can be found in most biological fluids (e.g., colostrum, milk, and blood).
Lactoferrin is important for immune system maintenance, as it has antibacterial, antifungal,
and antiviral properties (Farnaud and Evans, 2003; Baker and Baker, 2005).
Heritability estimates of individual milk proteins are moderate to high, suggesting
wide opportunity to alter the composition in cow milk using breeding if individual
measurements of milk protein fractions are available on a large scale (Lopez-Villalobos,
2012).
Mid-infrared prediction models for protein, casein, and casein fractions are shown in
Table 6. Only De Marchi et al. (2009a), Bonfatti et al. (2011), and Rutten et al. (2011)
developed prediction models for casein fractions, whereas Luginbuhl (2002), Sorensen et al.
(2003), and Etzion et al. (2004) reported predictions only for casein and protein contents. As
in the case of FA composition, reference methods play a basic role in the development of
prediction models for milk protein composition. Studies that dealt with the use of MIRS to
predict protein and casein contents referred to the Kjeldahl analytical method (Sorensen et al.,
2003), and they reported excellent 1 − VR and RMSEcv of 0.94 to 0.97, and 0.08 to 0.05
g/100 g of milk, respectively (Table 6). On the other hand, MIRS models for casein and whey
fractions measured using capillary zone electrophoresis or reversed-phase HPLC as reference
methods showed moderate predictive ability (De Marchi et al., 2009a; Bonfatti et al., 2011;
Rutten et al., 2011). On average, casein fractions were better predicted when the reference
method was HPLC than capillary zone electrophoresis. We can hypothesize that the
accuracies of gold standard methods play a key role in the development of infrared prediction
29
models. Moreover, in this specific case and as reviewed by Recio et al. (1997), HPLC
methods showed better accuracies with respect to capillary zone electrophoresis in the
determination of protein composition.
The best prediction models were described by Bonfatti et al. (2011), with 1 − VR of
0.66, 0.49, 0.53, 0.63, and 0.40 for αS1-CN, αS2-CN, β-CN, κ-CN, and γ-CN, respectively,
whereas no satisfactory results were obtained by Rutten et al. (2011), who reported 1 – VR of
0.18 and 0.28 for αS1-CN and κ-CN, respectively. De Marchi et al. (2009a) showed slightly
lower accuracies compared with Bonfatti et al. (2011), analysing similar data and using the
same reference methods. Bonfatti et al. (2011) tried to predict casein fractions changing the
unit of measurement of the traits (percentage of protein or casein); results were not
satisfactory compared with those obtained from traits expressed per unit of milk and this
confirms previous findings for FA.
Regarding the total whey protein and whey protein fractions, very similar results were
obtained by De Marchi et al. (2009a), Bonfatti et al. (2011), and Rutten et al. (2011), with 1 −
VR, on average, of 0.55, 0.35, and 0.55 for total whey protein, α-LA, and β-LG, respectively
(Table 7). As with casein fractions, MIRS predictions of whey fractions were better when
traits were expressed per unit of milk. Concerning the spectra pretreatments, the scientific
literature reported contradictory results; in fact, De Marchi et al. (2009a) and Rutten et al.
(2011) used untreated spectral data, whereas Bonfatti et al. (2011) used several preprocessed
spectra methods.
According to Table 7, 1 − VR values for predicted lactoferrin would be 0.66, 0.73, and
0.75 in Lopez-Villalobos et al. (2009), Soyeurt et al. (2012), and Soyeurt et al. (2007),
respectively. The prediction models were developed using 2 gold standard methods: (1) a
commercial ELISA kit in the case of Soyeurt et al. (2007, 2012) and (2) HPLC in the case of
Lopez-Villalobos et al. (2009). The large number (n = 2,499) and the origin (3 countries) of
milk samples, combined with first derivative pretreatments, were probably responsible for the
better prediction of lactoferrin from Soyeurt et al. (2012) compared with the other studies.
In general, results of the reviewed studies indicate that MIRS cannot predict milk
protein composition with high accuracy and, hence, the prediction models are not currently
suitable for the dairy industry (e.g., milk payment system).
30
COW HEALTH AND ENERGY STATUS
Mid-infrared spectroscopy has been studied as potential tool to predict several milk
traits related to cow health and robustness, which are closely related to cow fertility and
production. This is the case for ketosis, a metabolic disorder that affects high-producing cows
and causes a loss of production and infertility. Ketosis is related to the abnormal increase of
acetone and BHBA in blood and milk, and the potential to predict the ketone bodies using
MIRS has been tested by several authors. Hansen (1999) obtained 1 – VR and RMSEcv of
0.81 and 0.27 mM, respectively, for acetone content of bovine milk; these results were useful
for screening purposes (healthy vs. potential ketotic cows). Heuer et al. (2001) studied the
ability of MIRS to predict acetone content and found greater 1 – VR compared with Hansen
(1999), a specific relationship between 1,370 and 1,239 cm−1 wavelengths and acetone
prediction, and an advantage in the accuracy of prediction related to second-derivative spectra
pretreatment. The results reported by Hansen (1999) and Heuer et al. (2001), which allowed
the screening of cows with subclinical ketosis, were confirmed by the calibration models
developed by de Roos et al. (2007). de Roos et al. (2007) investigated the potential of MIRS
to predict acetone and BHBA concentrations on 1,080 bovine samples and reported RMSEcv
of 0.184 and 0.064 mM for acetone and BHBA, respectively. The ability of MIRS to predict
acetone and BHBA concentrations was also demonstrated by van Knegsel et al. (2010), who
reported that cow hyperketonemia could be better predicted using models developed for
acetone and BHBA contents than using fat-to-protein ratio.
The negative energy balance, typical of dairy cows, especially in early lactation (Berry
et al., 2006, 2009), is known to be related to animal health and fertility (Beam and Butler,
1999). Several studies estimated genetic association between negative energy balance and
animal health (Collard et al., 2000; Veerkamp et al., 2000), and proposed energy balance
predictors such as change in BCS, milk fat-to-protein ratio, and FA composition of milk (de
Roos et al., 2007; Roche et al., 2009; Stoop et al., 2009).
McParland et al. (2011) investigated the feasibility of using the MIRS spectrum as an
indicator of body energy status in Holstein cows; the authors found quite satisfactory
accuracies for direct energy balance, with 1 − VR from 0.50 to 0.56. However, the prediction
models were developed using data from a single herd and 2 diets that differed only for the
level of concentrates offered, and this might have affected the variability of data. McParland
et al. (2012) went on to evaluate the ability of MIRS to predict body energy status across the
United Kingdom and Ireland in both confinement and grazing systems. The accuracies of
31
prediction models were quite satisfactory, with square root of the coefficients of multiple
determination from 0.47 to 0.69, 0.51 to 0.56, and 0.76 to 0.80 for direct energy balance, body
energy content, and energy intake, respectively. Moreover, in the same study, McParland et al.
(2012) highlighted the importance of limiting the error on the reference measurements to
obtain a satisfactory equation. In conclusion, MIRS prediction models developed by
McParland et al. (2011, 2012) provided useful information on the energy status of cows to
dairy farmers; in fact, through routine recording of these traits, changes in the energy status of
cows could be related to herd management practices or cow individual characteristics (e.g.,
genetic merit).
MINERAL COMPOSITION OF MILK AND OTHER TRAITS
Minerals in milk play a key role for human health and for some technological aspects
(e.g., coagulation process). Recently, Caroli et al. (2011) reviewed the relationships between
the intake of several milk and dairy products and bone health (e.g., osteoporosis), with
particular emphasis to calcium and other macro- and micronutrients. Calcium associated with
phosphorus influenced the ability of milk to coagulate and affected the final consistency of
coagulum (Fossa et al., 1994; Mariani et al., 1996).
As for the previously reviewed traits, the opportunity to predict mineral composition
using MIRS is desirable, as it allows rapid and large-scale data recording. Only Soyeurt et al.
(2009) investigated the potential of MIRS to predict the calcium, phosphorus, magnesium,
sodium, and potassium content of cow milk based on the inductively coupled plasma atomic
emission spectrometry gold method. Results showed the ability of MIRS to predict calcium
and phosphorus (1 − VR of 0.87 and 0.85, respectively), reasonable accuracies for magnesium
and sodium (coefficient of determination in cross-validation of 0.65), and unsatisfactory
results for potassium. Moreover, Soyeurt et al. (2009) reported that inductively coupled
plasma atomic emission spectrometry without mineralization was an inappropriate method to
determine the sodium concentration in milk.
Recently, Toffanin and De Marchi (2013) investigated the effectiveness of MIRS to
predict calcium and phosphorus, and the relations of these traits with MCP. Milk samples of
about 200 Holstein-Friesian cows were collected and MIRS spectra and reference values
obtained by the inductively coupled plasma atomic emission spectroscopy method were
recorded. Statistical analysis using external and cross-validation procedures showed quite
32
satisfactory results, with 1 − VR ranging from 0.50 to 0.60 and from 0.67 to 0.80 for calcium
and phosphorus, respectively.
Mid-infrared spectroscopy has also been used to predict hydrochloride tetracycline
concentration in milk (Sivakesava and Irudayaraj, 2002); those authors reported very high
accuracy of prediction using a limited range of tetracycline concentration (4 to 2,000, 520 to
2,000, and 4 to 520 ppb) and first-derivative spectra pretreatment. More recently, MIRS has
been used to predict methane emission of dairy cows (Dehareng et al., 2012) on a limited
number of animals fed 2 diets to induce large variation in methane emissions, measured using
the sulphur hexafluoride method. Prediction models were developed using the average daily
milk spectrum that was collected at 5 different times over 5 d from each diet to find the best
relationship between methane emissions and spectra information. The best results were
obtained for spectra collected for 1.5 d after methane determination, with 1 − VR of 0.79.
Moreover, an interesting relationship between FA and methane emissions was confirmed.
Dehareng et al. (2012) suggested the use of MIRS models for screening purposes; however,
the application of MIRS to predict methane emission needs to be further studied.
CONCLUSIONS AND PERSPECTIVES
Mid-infrared spectroscopy is a fast, large-scale, and low-cost methodology for
collecting phenotypes. Its potential to predict milk quality traits (e.g., FA composition, MCP,
and mineral content) and other milk characteristics related to cow health and energy status has
been demonstrated. In the near future, MIRS could be used for the prediction of other milk
traits: (1) potassium, magnesium, and zinc content, which are important for transmitting nerve
impulses, for mineral structure of bones, for wound healing, and healthy immune systems; (2)
phospholipids and acidic glycolipids, which are important for infant development; (3)
vitamins A and B, which are important for healthy eyes and skin; (4) sensory features, which
are important for the characterization of milk taste, beyond its nutritional value; (5) cheese
yield; and (6) whey components, such as glutathione, α-tocopherol, and vitamin C.
Several studies on the effect of spectra pretreatment and type of software are needed.
From this point of view, the effect of the use of mathematical pretreatments is not completely
known, especially when prediction models are developed for a new trait for which the success
of calibration models is related to several spectra peaks. Moreover, the potential of different
statistical software packages should be investigated; in fact, no studies have been conducted to
compare the performance of chemometric with general statistics software.
33
Efforts should be made to transfer prediction models for new phenotypes to MIRS
instruments available in milk laboratories to allow routine data recording at the population
level. To facilitate the implementation of MIRS models in field conditions, close collaboration
with companies producing MIRS instruments is recommended.
Another crucial point for improving the use of MIRS is to favor the exchange of
spectra databases among countries to develop across-country MIRS prediction models that
take into account the biological variability of the studied traits in different environmental
conditions. To do this, standardized reference methods within and across country are needed.
As reviewed in this paper, large variability of reference methods used for MIRS calibration
exists, and this does not facilitate the exchange and comparison of predicted phenotypes from
different countries.
Finally, MIRS allows the recording of many new phenotypes that can be used for
breeding purposes. The application of MIRS predictions in breeding programs depends upon
the genetic correlation between the predicted and measured values. If the correlation and the
genetic variance of MIRS phenotypes are sizable with reasonable accuracies, practical utility
exists in the MIRS models.
ACKNOWLEDGMENTS
This research was supported by Regione Veneto with the project “CheeseBull”, n.
2070868, Reg. CE 1698/2005, P.S.R. del Veneto - DGR 1354 del 03/08/2011. The authors
gratefully acknowledge Una Geary (Teagasc, Moorepark, Ireland) for reading and correcting
the manuscript, which has helped to improve this review.
34
Figure 1. Example of untreated, first derivative, and second derivate spectra.
35
Figure 2. Published papers (retrieved from ISI Web Of Science; http://thomsonreuters.com/webof-science/) on mid-infrared spectroscopy (MIRS) and milk. For 2013, papers published up to
October are reported.
15
n of papers
12
9
6
3
0
2001
2002
2003
2004
2005
2006
2007
Year
36
2008
2009
2010
2011
2012
2013
37
Table 1. Number of calibration samples, number of breeds, reference method, and validation procedures used in the studies aimed at developing mid-infrared spectroscopy (MIRS)
prediction models for milk FA
Spectra
Validation
Reference
n1
Dairy breed
Reference method
pre-treatments2
procedure
ISO standard 14156:2001.
Column: length of 50 m, internal diameter of 0.25 mm, film
CrossSoyeurt et al. (2006)
49
Multibreed
thickness of 0.20 µm. Average velocity of 35cm/s, flameUntreated
validation
ionization detector at 265°C, temperature program from 40 to
250°C.
ISO standard 14156:2001.
Column: length of 100 m, internal diameter of 0.25 mm, film
CrossSoyeurt et al. (2008)
78
Multibreed
thickness of 0.20 µm. Average velocity of 19 cm/s, flameUntreated
validation
ionization detector at 255°C, temperature program from 60 to
225°C.
ISO standard 15884.
Column: length of 100 m, internal diameter of 0.25 mm.
Rutten et al. (2009)
3,622
VSS of Hoskuldsson
External
Temperature held at 225°C for 5 min.
De Marchi et al. (2011)
267
Single breed
Ferrand et al. (2011)
250
Multibreed
Soyeurt et al. (2011)
517
Multibreed
Maurice-Van Eijndhoven et al. (2013)
1,236
Multibreed
Mele et al. (2009).
Column: length of 100 m, internal diameter of 0.25 mm, film
thickness of 0.20 µm, injector temperature set at 270°C,
detector temperature set at 300°C, temperature program from
60 to 230°C.
ISO standard 14156, IDF172.
Column: length of 100 m. Splitless injector at 250°C, flame
detector at 250°C, temperature program from 70 to 215 °C.
ISO standard 14156:2001.
Column: length of 50 m, internal diameter of 0.25 mm, film
thickness of 0.20 µm, average velocity of 19 cm/s, cold oncolumn injector, flame-ionization detector at 255°C,
temperature program from 60 to 225°C.
ISO standard 15884.
Column: length of 100 m, internal diameter of 0.25 mm.
1
Number of samples used for calibration models.
2
VSS = variable selection strategy; 1D = first derivative; 2D = second derivative; MSC = multiplicative scatter correction.
37
1D, MSC+1D
Crossvalidation
Untreated
External
1D, 2D
External
1D
External
38
Table 2. Unit of measurement, coefficient of determination, and prediction error (in parentheses) of validation procedures for mid-infrared spectroscopy (MIRS) prediction
models of selected SFA
SFA
Reference
Unit
C4:0
C6:0
C8:0
C10:0
C12:0
C14:0
C16:0
C18:0
C20:0
0.51
0.52
0.59
0.64
0.74
0.82
0.82
0.69
g/dL of milk
(0.08)
(0.04)
(0.02)
(0.04)
(0.02)
(0.05)
(0.17)
(0.13)
Soyeurt et al. (2006)
0.39
0.41
0.46
0.53
0.64
0.67
0.50
0.09
g/100g of fat
(1.60)
(0.98)
(0.50)
(0.90)
(0.53)
(1.14)
(3.50)
(2.77)
0.90
0.84
0.85
Soyeurt et al. (2008)
g/dL of milk
(0.05)
(0.17)
(0.10)
0.91
0.96
0.94
0.92
0.85
0.94
0.94
0.82
g/dL of milk
(0.1)
(0.2)
(0.5)
(0.1)
(0.3)
(0.03)
(0.1)
(0.7)
Rutten et al. (2009)1
0.55
0.73
0.73
0.75
0.68
0.73
0.71
0.51
g/100g of fat
(0.0)
(0.3)
(0.6)
(0.2)
(0.3)
(0.3)
(0.0)
(1.2)
0.55
0.53
0.56
0.59
0.49
0.42
0.29
De Marchi et al. (2011)
g/kg of milk
(0.07)
(0.19)
(0.25)
(0.60)
(1.59)
(0.75)
(0.01)
0.90
0.96
0.96
0.91
0.91
0.93
0.90
0.77
Ferrand et al. (2011)
g/100mL
(0.005)
(0.002)
(0.002)
(0.006)
(0.007)
(0.015)
(0.058)
(0.033)
0.89
0.95
0.93
0.92
0.92
0.95
0.93
0.88
Soyeurt et al. (2011)
g/dL of milk
(0.01)
(0.01)
(0.00)
(0.01)
(0.01)
(0.03)
(0.08)
(0.06)
0.92
0.93
0.92
0.93
0.85
0.95
0.93
0.72
Maurice-Van Eijndhoven et al. (2013)
g/dL of milk
(0.012)
(0.006)
(0.005)
(0.019)
(0.036)
(0.039)
(0.192)
(0.132)
1
Prediction bias within parentheses.
38
39
Table 3. Unit of measurement, coefficient of determination, and prediction error (in parentheses) of validation procedures for mid-infrared spectroscopy (MIRS) prediction
models of selected unsaturated FA
Unsaturated FA
Reference
Unit
cis-9
cis-9
trans-11
cis-9,12
cis-9,12,15
cis-9
cis-9 trans-11
C18:1
C14:1
C16:1
C18:1
C18:2
C18:3
C18:1
C18:2
0.07
0.65
0.88
0.62
0.14
0.07
g/dL of milk
(0.01)
(0.02)
(0.18)
(0.02)
(0.02)
(0.01)
Soyeurt et al. (2006)
0.23
0.37
0.53
0.44
0.20
0.34
g/100g of fat
(0.28)
(0.37)
(3.99)
(0.37)
(0.11)
(0.20)
0.53
0.28
Soyeurt et al. (2008)
g/dL of milk
(0.01)
(0.03)
0.36
0.45
0.92
0.58
g/dL of milk
0.63 (0.4)
(0.3)
(1.0)
(0.9)
(3.3)
Rutten et al. (2009)1
0.28
0.38
0.84
0.56
g/100g of fat
0.57 (0.6)
(0.5)
(1.1)
(0.6)
(2.8)
0.46
0.36
0.53
0.34
De Marchi et al. (2011)
g/kg of milk
0.31 (0.09)
(0.08)
(0.11)
(1.13)
(0.04)
0.91
0.65
0.91
Ferrand et al. (2011)
g/100mL of milk
(0.037)
(0.036)
(0.004)
0.71
0.60
0.95
0.63
Soyeurt et al. (2011)
g/dL of milk
(0.06)
(0.01)
(0.01)
(0.01)
Maurice-Van Eijndhoven et al. (2013)
g/dL of milk
1
Prediction bias within parentheses.
39
40
Table 4. Unit of measurement, coefficient of determination, and prediction error (in parentheses) of validation procedures for mid-infrared spectroscopy
prediction models of selected groups of FA
FA category1
Reference
Unit
SFA
UFA
MUFA
PUFA
SC
MC
0.94
0.66
0.85
0.39
g/dL of milk
(0.20)
(0.34)
(0.22)
(0.04)
Soyeurt et al. (2006)
0.63
0.63
0.52
0.10
g/100g of fat
(3.75)
(3.75)
(4.10)
(0.74)
1
2
g/dL of milk
0.95 (0.0)
0.97 (0.0)
Rutten et al. (2009)2
0.77
g/100g of fat
0.82 (0.3)
(0.1)
0.52
0.50
0.55
0.41
De Marchi et al. (2011)
g/kg of milk
0.53 (2.66)
(2.97)
(1.57)
(1.39)
(0.22)
0.98
0.91
0.973
Ferrand et al. (2011)
g/100mL of milk
0.92 (0.040)
0.38 (0.008)
(0.038)
(0.043)
(0.008)
0.99
0.97
0.97
0.81
Soyeurt et al. (2011)
g/dL of milk
0.95 (0.02)
0.96 (0.12)
(0.08)
(0.07)
(0.06)
(0.02)
0.99
0.95
Maurice-Van Eijndhoven et al. (2013)
g/dL of milk
0.96 (0.190)
(0.078)
(0.028)
1
UFA = unsaturated FA; SC = short-chain FA; MC = medium-chain FA; LC = long-chain FA.
2
Prediction bias within parentheses.
40
(MIRS)
LC
0.58
(1.94)
0.96
(0.12)
-
Table 5. Number of calibration samples, dairy breed, reference method, range, spectra pre-treatments, coefficient of determination (1-VR, where VR = variance ratio), and SE of
cross-validation (SECCV) of validation procedures for mid-infrared prediction models of milk coagulation properties and milk acidity
Reference
Dal Zotto et al. (2008)
Trait1
RCT, min
n
Dairy breed
Reference method2
158
Holstein-Friesian
CRM
41
De Marchi et al. (2013)
Spectra pretreatments3
1-VR
SECCV
9.20-25.8
1D
0.73
1.80
11.00-55.00
1D
0.45
5.49
4.40-29.30
Untreated
0.62
2.36
6.00-64.00
Untreated
0.37
6.86
5.88-7.03
1D, 1D+N
0.59
0.07
TA, °SH/50mL
1.19-4.77
1D
0.66
0.25
RCT, min
7.75-59.00
Untreated
0.76
7.05
2.00-28.45
Untreated
0.72
3.54
0.36-51.30
Untreated
0.70
7.68
0.76-40.96
Untreated
0.40
7.26
a30, mm
RCT, min
De Marchi et al. (2009b)
Range
a30, mm
pH
k20, min
a30, mm
CRM
1,064
350
Brown Swiss
Holstein-Friesian
FOR
a60, mm
1
RCT = rennet coagulation time; a30 = curd firmness 30 min after rennet addition; TA = titratable acidity; °SH = Soxhlet-Henkel degree; k20 = curd-firming time; a60 = curd
firmness 60 min after rennet addition;
2
CRM = computerized renneting meter (Polo Trade, Monselice, Italy); FOR = Formagraph (Foss Electric A/S, Hillerød, Denmark).
3
1D = first-derivative; 1D+N = first derivative and normalization.
41
Table 6. Unit of measurement, coefficient of determination, and prediction error (in parentheses) of validation procedures for mid-infrared spectroscopy (MIRS) prediction models of
total protein, total casein, and protein fractions
Protein
Unit
Protein
Casein
αS1-CN
αS2-CN
β-CN
κ-CN
γ-CN
Luginbühl et al. (2002)
Spectra pretreatments1
-
g/100g of milk
-
0.997 (0.047)
-
-
-
-
-
Sørensen et al. (2003)
-
%
-
0.97 (0.035)
-
-
-
-
-
Etzion et al. (2004)
-
%
0.94 (0.08)
-
-
-
-
-
-
Untreated
g/L of milk
0.58 (3.11)
0.58 (2.76)
0.50 (1.07)
0.35 (0.58)
0.33 (1.77)
0.44 (0.68)
-
g/L of milk
0.78 (2.13)
0.77 (1.91)
0.66 (0.89)
0.49 (0.48)
0.53 (1.37)
0.63 (0.55)
0.40 (0.10)
SNV, De, MSC,
% protein
-
-
0.23 (1.95)
0.17 (1.08)
0.13 (2.42)
0.36 (1.44)
0.08 (1.00)
1D, 2D
% casein
-
-
0.20 (2.34)
0.19 (1.25)
0.16 (2.63)
0.36 (1.62)
0.09 (1.14)
Untreated
g/100g of milk
-
0.25 (1.50)
0.18 (1.52)
0.26 (1.20)
0.19 (1.42)
0.28 (0.49)
-
Reference
De Marchi et al. (2009a)
Bonfatti et al. (2011)
42
Rutten et al. (2011)
1
SNV = standard normal variate; De = detrend; MSC = multiplicative scatter correction; 1D = first derivative; 2D = second derivative.
42
Table 7. Unit of measurement, coefficient of determination, and prediction error (in parentheses) of validation procedures for mid-infrared spectroscopy (MIRS)
prediction models of whey protein and selected whey protein fractions
Protein
Spectra preReference
treatments1
Unit
Whey protein
α-LA
β-LG
Lactoferrin
Soyeurt et al. (2007)
mg/L of milk
-
-
-
0.75 (103.93)
De Marchi et al. (2009a)
Untreated
Untreated
g/L of milk
0.53 (0.51)
0.29 (0.19)
0.55 (0.43)
-
Lopez-Villalobos et al. (2009)
Untreated
mg/L of milk
-
-
-
0.812
g/L of milk
0.61 (0.45)
0.31 (0.18)
0.64 (0.37)
-
SNV, De, MSC,
% protein
-
0.31 (0.42)
0.42 (0.74)
-
1D, 2D
% whey protein
-
-
0.36 (3.02)
-
Untreated
Untreated, rep, 1D, 1D+rep,
g/100g of milk
0.53 (0.84)
0.20 (0.29)
0.56 (0.79)
-
mg/L of milk
-
-
-
0.73 (50.55)
Bonfatti et al. (2011)
43
Rutten et al. (2011)
Soyeurt et al. (2012)
2D, 2D+rep
1
SNV = standard normal variate; De = detrend; MSC = multiplicative scatter correction; 1D = first derivative; 2D = second derivative; rep =
repeatability file.
2
Concordance correlation coefficient calculated according to Lin (1989).
43
REFERENCES
Aleandri, R., J. C. Schneider, and L. G. Buttazzoni. 1989. Evaluation of milk for cheese
production based on milk characteristics and Formagraph measures. J. Dairy Sci.
72:1967–1975.
Auldist, M., C. Mullins, B. O’Brien, B. T. O’Kennedy, and T. Guinee. 2002. Effect of cow
breed on milk coagulation properties. Milchwissenschaft 57:140–143.
Auldist, M. J., K. A. Johnston, N. J. White, W. P. Fitzsimons, and M. J. Boland. 2004. A
comparison of the composition, coagulation characteristics and cheese making capacity
of milk from Friesian and Jersey dairy cows. J. Dairy Res. 71:51–57.
Baker, E. N., and H. M. Baker. 2005. Molecular structure, binding properties and dynamics of
lactoferrin. Cell. Mol. Life Sci. 62:2531–2539.
Balabin, R. M., and S. V. Smirnov. 2011. Melamine detection by mid and near-infrared
(MIR/NIR) spectroscopy: A quick and sensitive method for dairy products analysis
including liquid milk, infant formula, and milk powder. Talanta 85:562–568.
Beam, S. W., and W. R. Butler. 1999. Effects of energy balance on follicular development and
first ovulation in postpartum dairy cows. J. Reprod. Fertil. Suppl. 54:411–424.
Berry, D. P., A. R. Cromie, N. McHugh, M. Burke, T. Pabiou, J. MacCarthy, J. F. Kearney, F.
Buckley, R. D. Evans, D. Purfield, J. M. Coyne, B. W. Wickham, J. J. Crowley, and S.
McParland. 2012. New traits for dairy cattle breeding. In 38th International Committee
for Animal Recording (ICAR) Meeting, Cork, Ireland, 28th May – 1st June 2012.
http://www.icar.org/Cork_2012/Manuscripts/Published/Berry.pdf.
Berry, D. P., M. O’Donovan, and P. Dillon. 2009. Potential to genetically alter intake and
energy balance in grass fed dairy cows. Pages 219–224 in Breeding for Robustness in
Cattle. EAAP Publ. No. 126. Wageningen Academic Publishers, Wageningen, the
Netherlands.
Berry, D. P., R. F. Veerkamp, and P. Dillon. 2006. Phenotypic profiles for body weight, body
condition score, energy intake, and energy balance across different parities and
concentrate feeding levels. Livest. Sci. 104:1–12.
Bonfatti, V., G. Di Martino, and P. Carnier. 2011. Effectiveness of mid-infrared spectroscopy
for the prediction of detailed protein composition and contents of protein genetic
variants of individual milk of Simmental cows. J. Dairy Sci. 94:5776–5785.
Bowman, J. C. 1974. An Introduction to Animal Breeding. Edward Arnold Ltd., London, UK.
44
Bynum, D. G., and N. F. Olson. 1982. Influence of curd firmness at cutting on Cheddar cheese
yield and recovery of milk constituents. J. Dairy Sci. 65:2281–2290.
Caroli, A. M., S. Chessa, and G. J. Erhardt. 2009. Invited review: Milk protein
polymorphisms in cattle: Effect on animal breeding and human nutrition. J. Dairy Sci.
92:5335–5352.
Caroli, A., A. Poli, D. Ricotta, G. Banfi, and D. Cocchi. 2011. Invited review: Dairy intake
and bone health: A viewpoint from the state of the art. J. Dairy Sci. 94:5249–5262.
Cassandro, M., A. Comin, M. Ojala, R. Dal Zotto, M. De Marchi, L. Gallo, P. Carnier, and G.
Bittante. 2008. Genetic parameters of milk coagulation properties and their relationships
with milk yield and quality traits in Italian Holstein cows. J. Dairy Sci. 91:371–376.
Cecchinato, A., M. De Marchi, L. Gallo, G. Bittante, and P. Carnier. 2009. Mid-infrared
spectroscopy predictions as indicator traits in breeding programs for enhanced
coagulation properties of milk. J. Dairy Sci. 92:5304–5313.
Chilliard, Y., A. Ferlay, and M. Doreau. 2001. Effect of different types of forages, animal fat
or marine oils in cow’s diet on milk fat secretion and composition, especially conjugated
linoleic acid (CLA) and polyunsaturated fatty acids. Livest. Prod. Sci. 70:31–48.
Cipolat-Gotet, C., A. Cecchinato, M. De Marchi, M. Penasa, and G. Bittante. 2012.
Comparison between mechanical and near-infrared methods for assessing coagulation
properties of bovine milk. J. Dairy Sci. 95:6806–6819.
Colinet, F. G., H. Soyeurt, C. Anceau, A. Vanlierde, N. Keyen, P. Dardenne, N. Gengler, and
M. Sindic. 2010. Potential estimation of titratable acidity in cow milk using midinfrared spectrometry. In 37th International Committee for Animal Recording (ICAR)
Meeting,
Riga,
Latvia.
Accessed
Jan.
16,
2013.
http://www.icar.org/Documents/Riga_2010/ppt/Colinet.pdf.
Collard, B. L., J. C. M. Dekkers, D. Petitclerc, and L. R. Schaeffer. 2000. Relationships
between energy balance and health traits of dairy cattle in early lactation. J. Dairy Sci.
83:2683–2690.
Comin, A., M. Cassandro, S. Chessa, M. Ojala, R. Dal Zotto, M. De Marchi, P. Carnier, L.
Gallo, G. Pagnacco, and G. Bittante. 2008. Effects of composite β- and κ-casein
genotypes on milk coagulation, quality, and yield traits in Italian Holstein cows. J. Dairy
Sci. 91:4022–4027.
Dal Zotto, R., M. De Marchi, A. Cecchinato, M. Penasa, M. Cassandro, P. Carnier, L. Gallo,
and G. Bittante. 2008. Reproducibility and repeatability of measures of milk coagulation
45
properties and predictive ability of mid-infrared reflectance spectroscopy. J. Dairy Sci.
91:4103–4112.
De Marchi, M., G. Bittante, R. Dal Zotto, C. Dalvit, and M. Cassandro. 2008. Effect of
Holstein-Friesian and Brown Swiss breeds on quality of milk and cheese. J. Dairy Sci.
91:4092–4102.
De Marchi, M., V. Bonfatti, A. Cecchinato, G. Di Martino, and P. Carnier. 2009a. Prediction
of protein composition of individual cow milk using mid-infrared spectroscopy. Ital. J.
Anim. Sci. 8(Suppl. 2):399–401.
De Marchi, M., R. Dal Zotto, M. Cassandro, and G. Bittante. 2007. Milk coagulation ability of
five dairy cattle breeds. J. Dairy Sci. 90:3986–3992.
De Marchi, M., C. C. Fagan, C. P. O’Donnell, A. Cecchinato, R. Dal Zotto, M. Cassandro, M.
Penasa, and G. Bittante. 2009b. Prediction of coagulation properties, titratable acidity,
and pH of bovine milk using mid-infrared spectroscopy. J. Dairy Sci. 92:423–432.
De Marchi, M., M. Penasa, A. Cecchinato, M. Mele, P. Secchiari, and G. Bittante. 2011.
Effectiveness of mid-infrared spectroscopy to predict fatty acid composition of Brown
Swiss bovine milk. Animal 5:1653–1658.
De Marchi, M., M. Penasa, F. Tiezzi, V. Toffanin, and M. Cassandro. 2012. Prediction of
milk coagulation properties by Fourier transform mid-infrared spectroscopy (FTMIR)
for genetic purposes, herd management and dairy profitability. In 38th International
Committee for Animal Recording (ICAR) Meeting, Cork, Ireland. Accessed Nov. 10,
2012. http://www.icar.org/Cork_2012/Manuscripts/Published/Cassandro.pdf.
De Marchi, M., V. Toffanin, M. Cassandro, and M. Penasa. 2013. Prediction of coagulating
and noncoagulating milk samples using mid-infrared spectroscopy. J. Dairy Sci.
96:4707–4715.
de Roos, A. P. W., H. J. C. M. van den Bijgaart, J. Horlyk, and G. de Jong. 2007. Screening
for subclinical ketosis in dairy cattle by Fourier transform infrared spectrometry. J.
Dairy Sci. 90:1761–1766.
Dehareng, F., C. Delfosse, E. Froidmont, H. Soyeurt, C. Martin, N. Gengler, A. Vanlierde,
and P. Dardenne. 2012. Potential use of milk mid-infrared spectra to predict individual
methane emission of dairy cows. Animal 6:1694–1701.
Etzion, Y., R. Linker, U. Cogan, and I. Shmulevich. 2004. Determination of protein
concentration in raw milk by mid-infrared Fourier transform infrared/attenuated total
reflectance spectroscopy. J. Dairy Sci. 87:2779–2788.
46
Farnaud, S., and R. W. Evans. 2003. Lactoferrin—A multifunctional protein with
antimicrobial properties. Mol. Immunol. 40:395–405.
Ferrand, M., B. Huquet, S. Barbey, F. Barillet, F. Faucon, H. Larroque, O. Leray, J. M.
Trommenschlager, and M. Brochard. 2011. Determination of fatty acid profile in cow’s
milk using mid-infrared spectrometry: Interest of applying a variable selection by
genetic algorithms before a PLS regression. Chemom. Intell. Lab. Syst. 106:183–189.
Formaggioni, P., M. Malacarne, A. Summer, E. Fossa, and P. Mariani. 2001. Milk with
abnormal acidity. VI. The role of phosphorus content and the rennet-coagulation
properties of Italian Friesian herd milks. Ann. Fac. Med. Vet. Univ. Parma 21:261–268.
Fossa, E., M. Pecorari, S. Sandri, F. Tosi, and P. Mariani. 1994. Il ruolo del contenuto in
caseina del latte nella produzione del Parmigiano- Reggiano: Composizione chimica,
caratteristiche di coagulazione e comportamento tecnologico-caseario del latte. Sci.
Tecn. Latt. Cas. 45:519–535.
Fuentes-Pila, J., M. A. DeLorenzo, D. K. Beede, C. R. Staples, and J. B. Holter. 1996.
Evaluation of equations based on animal factors to predict intake of lactating Holstein
cows. J. Dairy Sci. 79:1562–1571.
German, J. B., R. A. Gibson, R. M. Krauss, P. Nestel, B. Lamarche, W. A. van Staveren, J. M.
Steijns, L. C. P. G. M. de Groot, A. L. Lock, and F. Destaillats. 2009. A reappraisal of
the impact of dairy foods and milk fat on cardiovascular disease risk. Eur. J. Nutr.
48:191–203.
Grummer, R. R. 1991. Effect of feed on the composition of milk fat. J. Dairy Sci. 74:3244–
3257.
Haaland, D. M., and E. V. Thomas. 1988. Partial least-squares methods for spectral analyses.
1. Relation to other quantitative calibration methods and the extraction of qualitative
information. Anal. Chem. 60:1193–1202.
Hansen, P. W. 1999. Screening of dairy cows for ketosis by use of infrared spectroscopy and
multivariate calibration. J. Dairy Sci. 82:2005–2010.
Heck, J. M. L., A. Schennink, H. J. F. van Valenberg, H. Bovenhuis, M. H. P. W. Visker, J.
A. M. van Arendonk, and A. C. M. van Hooijdonk. 2009. Effects of milk protein
variants on the protein composition of bovine milk. J. Dairy Sci. 92:1192–1202.
Heuer, C., H. J. Luinge, E. T. G. Lutz, Y. H. Schukken, J. H. van der Maas, H. Wilmink, and
J. P. T. M. Noordhuizen. 2001. Determination of acetone in cow milk by Fourier
47
transform infrared spectroscopy for the detection of subclinical ketosis. J. Dairy Sci.
84:575–582.
Hildrum, K. I., M. Martens, and H. Martens. 1983. Research on analysis of food quality. In
Proc. International Symposium on Control of Food Quality and Food Analysis. Reading
University, Reading, UK.
Houle, D., D. R. Govindaraju, and S. Omholt. 2010. Phenomics: The next challenge. Nat.
Rev. Genet. 11:855–866.
Ikonen, T., S. Morri, A.-M. Tyriseva, O. Ruottinen, and M. Ojala. 2004. Genetic and
phenotypic correlations between milk coagulation properties, milk production traits,
somatic cell count, casein content, and pH of milk. J. Dairy Sci. 87:458–467.
ISO-IDF (International Organization for Standardization-International Dairy Federation).
2001. Milk and milk products—Extraction methods for lipids and liposoluble
compounds. ISO 14156-IDF 172. International Dairy Federation, Brussels, Belgium.
ISO-IDF (International Organization for Standardization-International Dairy Federation).
2002. Milk fat—Preparation of fatty acid methyl esters. ISO 15884-IDF 184.
International Dairy Federation, Brussels, Belgium.
Karoui, R., A. M. Mouazen, E. Dufour, L. Pillonel, D. Picque, J. De Baerdemaeker, and J.-O.
Bosset. 2006. Application of the MIR for the determination of some chemical
parameters in European Emmental cheeses produced during summer. Eur. Food Res.
Technol. 222:165–170.
Lillehammer, M., T. H. E. Meuwissen, and A. K. Sonesson. 2011. A comparison of dairy
cattle breeding designs that use genomic selection. J. Dairy Sci. 94:493–500.
Lin, L. I.-K. 1989. A concordance correlation coefficient to evaluate reproducibility.
Biometrics 45:255–268.
Lopez-Villalobos, N. 2012. Analysing the genetic basis of milk production traits. CAB
Reviews 7:1–18.
Lopez-Villalobos, N., S. R. Davis, E. M. Beattie, J. Melis, S. Berry, S. Holroyd, R. J.
Spelman, and R. G. Snell. 2009. Breed effects for lactoferrin concentration determined
by Fourier transform infrared spectroscopy. Proc. N.Z. Soc. Anim. Prod. 69:1–5.
Luginbuhl, W. 2002. Evaluation of designed calibration samples for casein calibration in
Fourier transform infrared analysis of milk. Lebensm. Wiss. Technol. 35:554–558.
MacGibbon, A. K. H., and W. D. McLennan. 1987. Hardness of New Zealand patted butter:
Seasonal and regional variations. N.Z. J. Dairy Sci. Tech. 22:143–156.
48
Mariani, P., G. Zanzucchi, and A. Summer. 1996. Contenuto di fosfato di calcio colloidale e
grado di “mineralizzazione” della caseina in campioni di latte di massa di allevamenti
bovini di razza Frisona. L’Industria del Latte 32:3–16.
Martens, H., S. A. Jensen, and P. Geladi. 1983. Multivariate linearity transformations for near
infrared reflectance spectroscopy. Pages 205–234 in Proc. Nordic Symp. Appl. Stat. O.
H. J. Christie, ed. Stokkland Forlag, Stavanger, Norway.
Maurice-Van Eijndhoven, M. H. T., H. Soyeurt, F. Dehareng, and M. P. L. Calus. 2013.
Validation of fatty acid predictions in milk using mid-infrared spectrometry across cattle
breeds. Animal 7:348–354.
Mc Hugh, N., T. H. E. Meuwissen, A. R. Cromie, and A. K. Sonesson. 2011. Use of female
information in dairy cattle genomic breeding programs. J. Dairy Sci. 94:4109–4118.
McParland, S., G. Banos, B. McCarthy, E. Lewis, M. P. Coffey, B. O’Neill, M. O’Donovan,
E. Wall, and D. P. Berry. 2012. Validation of mid-infrared spectrometry in milk for
predicting body energy status in Holstein-Friesian cows. J. Dairy Sci. 95:7225–7235.
McParland, S., G. Banos, E. Wall, M. P. Coffey, H. Soyeurt, R. F. Veerkamp, and D. P. Berry.
2011. The use of mid-infrared spectrometry to predict body energy status of Holstein
cows. J. Dairy Sci. 94:3651–3661.
Mele, M., R. Dal Zotto, M. Cassandro, G. Conte, A. Serra, A. Buccioni, G. Bittante, and P.
Secchiari. 2009. Genetic parameters for conjugated linoleic acid, selected milk fatty
acids, and milk fatty acid unsaturation of Italian Holstein-Friesian cows. J. Dairy Sci.
92:392–400.
Mensink, R. P., and M. B. Katan. 1992. Effect of dietary fatty acids on serum lipids and
lipoproteins: A meta-analysis of 27 trials. Arterioscler. Thromb. 12:911–919.
Næs, T., T. Isaksson, T. Fearn, and T. Davies. 2002. A User-Friendly Guide to Multivariate
Calibration and Classification. NIR Publications, Chichester, UK.
OptiMIR. 2012. The drop reflecting the health of dairy farms. Accessed Dec. 15, 2012.
http://www.optimir.eu/en/index.php.
Penasa, M., M. Cassandro, D. Pretto, M. De Marchi, A. Comin, S. Chessa, R. Dal Zotto, and
G. Bittante. 2010. Short communication: Influence of composite casein genotypes on
additive genetic variation of milk production traits and coagulation properties in
Holstein-Friesian cows. J. Dairy Sci. 93:3346–3349.
Penasa, M., F. Tiezzi, A. Sturaro, M. Cassandro, and M. De Marchi. 2014. A comparison of
the predicted coagulation characteristics and composition of milk from multi-breed
49
herds of Holstein-Friesian, Brown Swiss and Simmental cows. Int. Dairy J. 35:6–10.
http://dx.doi.org/10.1016/j.idairyj.2013.10.004.
Pretto, D., M. De Marchi, M. Penasa, and M. Cassandro. 2013. Effect of milk composition
and coagulation traits on Grana Padano cheese yield under field conditions. J. Dairy
Res. 80:1–5.
Pretto, D., T. Kaart, M. Vallas, I. Jõudu, M. Henno, L. Ancilotto, M. Cassandro, and E. Pärna.
2011. Relationships between milk coagulation property traits analyzed with different
methodologies. J. Dairy Sci. 94:4336–4346.
Pryce, J. E., M. E. Goddard, H. W. Raadsma, and B. J. Hayes. 2010. Deterministic models of
breeding scheme designs that incorporate genomic selection. J. Dairy Sci. 93:5455–
5466.
Recio, I., L. Amigo, and R. Lopez-Fandino. 1997. Assessment of the quality of dairy products
by capillary electrophoresis of milk proteins. J. Chromatogr. B Analyt. Technol.
Biomed. Life Sci. 697:231–242.
Riddell-Lawrence, S., and C. L. Hicks. 1989. Effect of curd firmness on stirred curd cheese
yield. J. Dairy Sci. 72:313–321.
Rinnan, A., L. Norgaard, F. van den Berg, J. Thygesen, R. Bro, and S. Balling Engelsen. 2009.
Data pre-processing. Chapter 2 in Infrared Spectroscopy for Food Quality Analysis and
Control. Academic Press, London, UK.
Riovanto, R., M. De Marchi, M. Cassandro, and M. Penasa. 2012. Use of near infrared
transmittance spectroscopy to predict fatty acid composition of chicken meat. Food
Chem. 134:2459–2464.
RobustMilk. 2012. Innovative and practical breeding tools for improved dairy products from
more robust dairy cattle. Accessed Dec. 15, 2012. http://www.robustmilk.eu/.
Roche, J. R., N. C. Friggens, J. K. Kay, M. W. Fisher, K. J. Stafford, and D. P. Berry. 2009.
Invited review: Body condition score and its association with dairy cow productivity,
health, and welfare. J. Dairy Sci. 92:5769–5801.
Rutten, M. J. M., H. Bovenhuis, J. M. L. Heck, and J. A. M. van Arendonk. 2011. Predicting
bovine milk protein composition based on Fourier transform infrared spectra. J. Dairy
Sci. 94:5683–5690.
Rutten, M. J. M., H. Bovenhuis, K. A. Hettinga, H. J. F. van Valenberg, and J. A. M. van
Arendonk. 2009. Predicting bovine milk fat composition using infrared spectroscopy
based on milk samples collected in winter and summer. J. Dairy Sci. 92:6202–6209.
50
Savitzky, A., and M. J. E. Golay. 1964. Smoothing and differentiation of data by simplified
least squares procedures. Anal. Chem. 36:1627–1639.
Sivakesava, S., and J. Irudayaraj. 2002. Rapid determination of tetracycline in milk by FTMIR and FT-NIR spectroscopy. J. Dairy Sci. 85:487–493.
Sørensen, L. K., M. Lund, and B. Juul. 2003. Accuracy of Fourier transform infrared
spectrometry in determination of casein in dairy cows’ milk. J. Dairy Res. 70:445–452.
Soyeurt, H., C. Bastin, F. G. Colinet, V. M.-R. Arnould, D. P. Berry, E. Wall, F. Dehareng, H.
N. Nguyen, P. Dardenne, J. Schefers, J. Vandenplas, K. Weigel, M. Coffey, L. Theron,
J. Detilleux, E. Reding, N. Gengler, and S. McParland. 2012. Mid-infrared prediction of
lactoferrin content in bovine milk: Potential indicator of mastitis. Animal 6:1830–1838.
Soyeurt, H., D. Bruwier, J.-M. Romnee, N. Gengler, C. Bertozzi, D. Veselko, and P.
Dardenne. 2009. Potential estimation of major mineral contents in cow milk using midinfrared spectrometry. J. Dairy Sci. 92:2444–2454.
Soyeurt, H., F. G. Colinet, V. M.-R. Arnould, P. Dardenne, C. Bertozzi, R. Renaville, D.
Portetelle, and N. Gengler. 2007. Genetic variability of lactoferrin content estimated by
mid-infrared spectrometry in bovine milk. J. Dairy Sci. 90:4443–4450.
Soyeurt, H., P. Dardenne, F. Dehareng, G. Lognay, D. Veselko, M. Marlier, C. Bertozzi, P.
Mayeres, and N. Gengler. 2006. Estimating fatty acid content in cow milk using midinfrared spectrometry. J. Dairy Sci. 89:3690–3695.
Soyeurt, H., F. Dehareng, N. Gengler, S. McParland, E. Wall, D. P. Berry, M. Coffey, and P.
Dardenne. 2011. Mid-infrared prediction of bovine milk fatty acids across multiple
breeds, production systems, and countries. J. Dairy Sci. 94:1657–1667.
Soyeurt, H., F. Dehareng, P. Mayeres, C. Bertozzi, and N. Gengler. 2008. Variation of Δ9desaturase activity in dairy cattle. J. Dairy Sci. 91:3211–3224.
Stone, M. 1974. Cross-validatory choice and assessment of statistical predictions. J. R. Stat.
Soc., B 36:111–147.
Stoop, W. M., H. Bovenhuis, J. M. L. Heck, and J. A. M. van Arendonk. 2009. Effect of
lactation stage and energy status on milk fat composition of Holstein-Friesian cows. J.
Dairy Sci. 92:1469–1478.
Stuart, B. 2004. Infrared Spectroscopy: Fundamentals and Applications. John Wiley & Sons
Ltd., Chichester, UK.
Tiezzi, F., D. Pretto, M. De Marchi, M. Penasa, and M. Cassandro. 2013. Heritability and
repeatability of milk coagulation properties predicted by mid-infrared spectroscopy
51
during routine data recording, and their relationships with milk yield and quality traits.
Animal 7:1592–1599.
Toffanin, V., and M. De Marchi. 2013. Prediction of calcium, phosphorus and titratable
acidity, and relationships with coagulation traits and chemical composition of bovine
milk. Ital. J. Anim. Sci. 12(Suppl. 1):37. (Abstr.)
Tyriseva, A.-M., T. Vahlsten, O. Ruottinen, and M. Ojala. 2004. Noncoagulation of milk in
Finnish Ayrshire and Holstein-Friesian cows and effect of herds on milk coagulation
ability. J. Dairy Sci. 87:3958–3966.
van der Drift, S. G. A., R. Jorritsma, J. T. Schonewille, H. M. Knijn, and J. A. Stegeman.
2012. Routine detection of hyperketonemia in dairy cows using Fourier transform
infrared spectroscopy analysis of β-hydroxybutyrate and acetone in milk in combination
with test-day information. J. Dairy Sci. 95:4886–4898.
van Knegsel, A. T. M., S. G. A. van der Drift, M. Horneman, A. P. W. de Roos, B. Kemp, and
E. A. M. Graat. 2010. Short communication: Ketone body concentration in milk
determined by Fourier transform infrared spectroscopy: Value for the detection of
hyperketonemia in dairy cows. J. Dairy Sci. 93:3065–3069.
Veerkamp, R. F., J. J. Oldenbroek, H. J. Van Der Gaast, and J. H. J. Van Der Werf. 2000.
Genetic correlation between days until start of luteal activity and milk yield, energy
balance, and live weights. J. Dairy Sci. 83:577–583.
Wedholm, A., L. B. Larsen, H. Lindmark-Mansson, A. H. Karlsson, and A. Andren. 2006.
Effect of protein composition on the cheesemaking properties of milk from individual
dairy cows. J. Dairy Sci. 89:3296–3305.
Williams, P. C. 1987. Implementation of near-infrared technology. Pages 143–167 in NearInfrared Technology in the Agricultural and Food Industries. 2nd ed. P. C. Williams and
K. Norris, ed. American Association of Cereal Chemists, St. Paul, MN.
Williams, P. C. 2001. Implementation of near-infrared technology. Page 143 in Near-Infrared
Technology in the Agricultural and Food Industries. 2nd ed. P. C. Williams and K.
Norris, ed. American Association of Cereal Chemists, St. Paul, MN.
Williams, P. C. 2003. Near-infrared technology getting the best out of light. Page 109 in A
Short Course in the Practical Implementation of Near Infrared Spectroscopy for the
User. 1.1 ed. PDK Projects Inc., Nanaimo, BC, Canada.
Williams, P. C., and K. Norris. 2001. Near-Infrared Technology in the Agricultural and Food
Industries. 2nd ed. American Association of Cereal Chemists, St. Paul, MN.
52
CHAPTER 2
Prediction of coagulating and noncoagulating milk samples using mid-infrared
spectroscopy
De Marchi M, Toffanin V, Cassandro M and Penasa M
Journal of Dairy Science (2013) 96:4707–4715
53
54
ABSTRACT
Over the last years, a general deterioration of milk coagulation properties (MCP) has
been observed in Italy, and thus the prediction of noncoagulating (NC) milk, defined as milk
not forming a curd within 30 min from rennet addition, is of immediate interest in the Italian
cheese industry. The present study investigated the ability of mid-infrared (MIR) spectroscopy
to predict NC milk using individual and bulk samples from Holstein cows. Samples were
selected according to MIR analysis to cover the range of coagulation time between 5 and 60
min. Milks were then analysed for MCP through the reference instrument (Formagraph) over
an extended testing-period of 60 min to identify coagulating and NC samples. Measured traits
were rennet coagulation time, curd-firming time, and curd firmness 30 and 60 min after rennet
addition. Results showed that there is no specific spectral information that distinguishes NC
from coagulating samples. The most accurate prediction model was developed for rennet
coagulation time followed by curd-firming time and curd firmness 30 min after rennet
addition, whereas curd firmness 60 min after enzyme addition could not be accurately
predicted. Based on these findings, MIR spectroscopy might be proposed in payment systems
to reward or penalize milk according to MCP. Moreover, the ability of MIR spectroscopy to
predict MCP of samples that form a curd beyond 30 min from enzyme addition may be of
interest for genetic improvement of coagulation traits in dairy breeds, because until now most
studies have excluded NC information from genetic analysis, leading to possible biases in the
estimation of genetic parameters and in the prediction of sire’s merit for MCP.
Key words: mid-infrared spectroscopy, milk coagulation property, Holstein Friesian,
phenotyping
INTRODUCTION
The Italian dairy industry relies heavily on milk coagulation properties (MCP) as they
influence the efficiency of cheese-making process (Pretto et al., 2013). Milk with good
aptitude to coagulate after rennet addition and to form a firm curd has been associated with
increased cheese yield compared with milk that poorly react to the presence of the enzyme
(Bynum and Olson, 1982; Riddell-Lawrence and Hicks, 1989; De Marchi et al., 2008). During
the last decades, MCP have been deteriorating in Italy (Sandri et al., 2001), with an elongation
of the rennet coagulation time (RCT, min) and an increase of the percentage of
noncoagulating (NC) milk, which has been conventionally defined as milk not forming a curd
within the testing time of 30 min (e.g., Ikonen et al., 1999; Tyrisevä et al., 2003) or 31 min
55
(e.g., Ikonen et al., 2004; Cassandro et al., 2008; Penasa et al., 2010) from rennet addition. As
the proportion of cows producing NC milk is increasing, a negative impact on profitability
and efficiency of the dairy sector is expected. Noncoagulating milk is detrimental for the
cheese industry and thus it is economically penalized in certain dairy chains, such as in
Parmigiano-Reggiano and Trentingrana cheese production, where coagulation traits are
determined by the Formagraph and are considered in milk quality payment system. Also,
blending well-coagulating with NC (Frederiksen et al., 2011) or poorly coagulating (Okigbo et
al., 1985b) milk compromises MCP of the resulting mix.
Several studies on MCP faced the problem of NC samples and investigated causes
underlying their occurrence. Although neither environmental nor genetic factors can
thoroughly explain the phenomenon, associations of NC milk with pH (Okigbo et al., 1985c;
Tyrisevä et al., 2003), SCC and mastitis (Okigbo et al., 1985a), k-CN concentration and
genotypes (Wedholm et al., 2006; Hallén et al., 2010; Frederiksen et al., 2011), and stage of
lactation (Okigbo et al., 1985c; Tyrisevä et al., 2003; Ikonen et al., 2004) have been reported.
Moreover, Harzia et al. (2012) found that the metabolic profile of NC milk was significantly
different from that of well-coagulating milk, and thus a relationship between metabolic profile
and MCP exists. The same authors compared NC and well-coagulating milk, and highlighted
significant differences in terms of pH, SCS, and fat, protein, and urea contents.
Besides environmental factors, also breed and additive genetic effects seem to influence
the occurrence of NC milk. There are marked differences in the proportion of NC samples
among cattle breeds: for example, it was 8 to 13.2% in Finnish Ayrshire (Ikonen et al., 1999
and 2004; Tyrisevä et al., 2003 and 2004), 1.3 to 9.7% in Holstein-Friesian (Tyrisevä et al.,
2004; Cassandro et al., 2008), and 0.3% in Estonian Holstein (Vallas et al., 2010). However,
the comparison of the occurrence of NC samples from different breeds should be made with
caution as the experimental conditions often differ among studies, particularly in terms of
sampling procedures and analytical conditions, such as the use or not of preservative in the
milk, the age of sample, the type of instrument (e.g., mechanical vs. optical), the type and
activity of the coagulant, and the temperature of analysis (Pretto et al., 2011; Cipolat-Gotet et
al., 2012). Evidence exist that additive genetic effects (Ikonen et al., 1999 and 2004; Tyrisevä
et al., 2003 and 2004) and two potential candidate genes (Tyrisevä et al., 2008) are associated
with the noncoagulation of milk and that there are large differences in the proportion of
daughters with NC milk among sires. Although several studies discarded NC samples from
the genetic analysis, the inclusion or not of NC milk information in statistical models aiming
56
at estimating covariance components for MCP has an influence on the assessment of genetic
parameters for coagulation traits (Ikonen et al., 2004; Cecchinato et al., 2011).
Few studies have dealt with measures of MCP beyond the conventional time of 30-31
min from coagulant addition (Mariani et al., 1997; Auldist et al., 2002 and 2004; O’Brien et
al., 2002; Frederiksen et al., 2011; Cipolat-Gotet et al., 2012). Extending the coagulation
analysis beyond this threshold may notably reduce the proportion of NC milks as longer time
is allowed for the sample to coagulate (Cipolat-Gotet et al., 2012). However, the use of
traditional instruments (e.g., the Formagraph) to determine MCP is applicable only to smallscale experiments and not at population level.
Mid-infrared (MIR) spectroscopy has been recently evaluated as potential tool to collect
MCP data at population level for phenotypic and genetic purposes (Dal Zotto et al., 2008;
Cecchinato et al., 2009; De Marchi et al., 2009). De Marchi et al. (2009) discussed the
prediction of RCT and curd firmness 30 min after rennet addition (a30, mm) through MIR
spectroscopy using coagulated samples of Brown Swiss cows, and found that models were
most applicable for RCT. However, MIR spectroscopy predictions of individual samples may
play an important role as indicator traits in selective breeding to enhance MCP. No studies are
currently available in the literature that attempted to predict NC samples. Therefore, the aim
of this work is to investigate the capability of MIR spectroscopy to predict coagulating and
NC milk in dairy cows.
MATERIALS AND METHODS
Milk Samples Collection and Reference Analysis
In September 2011, prediction models for MCP were installed on Milko-Scan FT6000
(Foss Electric A/S, Hillerød, Denmark) in the laboratory of the Breeders Association of
Veneto region (ARAV, Padova, Italy) and were used for routine analysis of MCP on samples
collected during monthly test-day milk recording. Mid-infrared spectroscopy calibration
models were developed by De Marchi et al. (2009, 2012) and exhibited coefficients of
determination in cross-validation of 0.76 and 0.70 for RCT and a30, respectively (De Marchi et
al., 2012). The use of MIR spectroscopy models allowed the prediction of MCP only for
samples that coagulated within 30 min from rennet addition.
To assess the capability of MIR technology to predict also NC samples, individual and
bulk milks from Holstein Friesian cows were collected in the Veneto region from November
2011 to February 2012. Immediately after sampling, milks were treated with preservative
57
(Bronopol, Knoll Pharmaceuticals, Nottingham, UK), transferred to the Regional Laboratory
of Breeder Association (ARAV, Padova, Italy), and selected according to MIR spectroscopy
analysis. The aim of the selection process was to store samples (one time per week) that
covered a wide range of RCT, from very early coagulation (i.e., within 10 min from enzyme
addition) to very late coagulation (i.e., beyond 30 min from enzyme addition). As a result,
spectral information from 200 individual milks from 5 dairy herds and 135 bulk milks were
extracted from the MIR database and analysed for MCP within 2 to 5 d from collection
through the reference method (Formagraph; Foss Electric, Hillerød, Denmark) over an
extended testing-time of 60 min to allow the determination of coagulation characteristics of
NC milks (Ikonen et al., 1999; Cassandro et al., 2008; De Marchi et al., 2009). Samples (10
mL) were heated to 35°C and 200 μL of a rennet solution (Hansen Standard 160; Pacovis
Amrein AG, Bern, Switzerland) diluted to 1.6% (w/v) in distilled water was added at the start
of analysis. Besides RCT and a30, measured traits were curd-firming time (k20, min; the time
interval from the addition of rennet to the time at which the width of the graph attains 20 mm)
and curd firmness 60 min after rennet addition (a60, mm). All samples coagulated within 60
min from enzyme addition.
MIR Spectra Acquisition and Multivariate Data Analysis
Mid-infrared spectra were selected from stored data and were initially collected from
0.25 mL of sample over the spectral range of 4,000 to 900 cm-1 using a Milko-Scan FT6000
(Fourier transform infrared interferometer; Foss Electric A/S, Hillerød, Denmark) within 4 h
from reference analysis.
Prediction models were obtained from The Unscrambler software (version 9.6; Camo
A/S, Oslo, Norway). To optimize the accuracy of the calibration, the data underwent (1)
detection of anomalous spectra in the calibration dataset, accomplished using the Mahalanobis
distance (Global H statistics, GH) to the centre of the population (Williams and Norris, 2001);
samples with GH > 3 were considered outliers and were then removed from the calibration
dataset, so that the final data available for investigation accounted for 319, 147, 224, and 178
samples for RCT, k20, a30, and a60, respectively. (2) Different combination of scattering
corrections and derivative mathematical treatments; normalized and multiplicative scatter
corrected, first derivative (Savitzky-Golay, 3 data points each side), and normalized plus first
derivative according to Williams (2001) and De Marchi et al. (2009). However, no significant
improvement was found compared with the use of untreated spectra, as reported by De Marchi
et al. (2009).
58
Statistical analysis was carried out using principal component analysis (PCA) and
partial least squares (PLS) regression analysis. Spectral data subjected to PCA and PLS
produces a new and smaller set of variables called principal components (PC) and loadings
(#L), respectively. Principal component analysis provides graphical representations of
similarities and differences across spectra, and was employed to investigate sample
distribution (Martens and Naes, 1989), and to discriminate NC milks from samples that
coagulated within 30 min from enzyme addition.
The optimal number of #L was calculated as the number of #L after which the standard
error of cross-validation (SECCV) no longer decreased substantially. Prediction models were
confirmed using cross-validation method by dividing the calibration dataset in 10 subgroups:
9 of them were used to construct the calibration model and 1 to check the results. This
operation was repeated until all groups were treated both as calibration and prediction set. The
effectiveness of calibration and validation models was assessed using the standard error of
calibration, R2, SECCV, and the coefficient of determination of cross-validation (1-VR).
According to Williams (2003) values of 1-VR between 0.50 and 0.65 indicate poor
predictions; values between 0.66 and 0.81 indicate fairly accurate predictions; and values
greater than 0.82 reveal good predictions.
The ratio performance deviation (RPD) and the range error ratio (RER) were calculated
to provide indications on the practical utility of predictive models. The RPD is the ratio of the
SD to SECCV of a given trait and RER is the ratio of the SECCV of the trait relative to the
range of the reference data (Edney et al., 1994; Williams, 2001). High values of RPD are
desirable; in particular RPD greater than 2 enables good predictions (Sinnaeve et al., 1994; De
Marchi et al., 2011). The RER is a method for standardizing the SECCV by relating it to the
range of the reference data. For example, RER values lower than 6 indicate very poor
classification and are not recommended for any application; RER values between 7 and 20
classify the model as poor to fair and indicate that the model could be used for screening
purposes; and RER values between 21 and 30 indicate a good classification suggesting that
the model would be suitable for a role in a quality control application (Williams, 2001).
RESULTS AND DISCUSSION
MCP
Descriptive statistics of MCP are summarized in Table 1. Rennet coagulation time, k20,
a30, and a60 averaged 30.55 min, 9.61 min, 26.97 mm, and 14.76 mm, respectively. The CV
59
ranged from 47 (RCT) to 68% (k20), suggesting a wide degree of variability, which should
facilitate the development of robust prediction models. The comparison with other studies is
difficult because our results originated from selected NC samples. If milks with RCT longer
than 30 min are removed from the dataset (data not shown), RCT and a30 averaged 16.51 min
and 29.36 mm, respectively, which are similar to findings reported by Cassandro et al. (2008)
in Italian Holstein cows. However, RCT of samples that coagulated within 30 min is longer
than results from De Marchi et al. (2009) in Brown Swiss cows and Ikonen et al. (2004) in
Finnish Ayrshire breed.
MIR Spectra and PCA Analysis of NC Milk Samples
Prediction models were obtained using modified spectra according to several authors
(Pillonel et al., 2003; Dal Zotto et al., 2008; De Marchi et al., 2009 and 2011) who suggested
omitting the spectral regions related to low signal-to-noise ratio. In the present study, the
spectral regions 3,040 to 3,470 cm−1 and 1,600 to 1,700 cm−1 were found to have high noise
levels and thus they were discarded prior to the analysis; these regions were related to the
absorption of water as reported by Hewavitharana and Brakel (1997) and Jørgensen and Næs
(2004). The analysed spectra showed specific peaks previously reported by De Marchi et al.
(2009 and 2011): 1,550 to 1,570 cm−1 related to protein absorption (Curley et al., 1998; Etzion
et al., 2004), 2,800 to 3,000 cm−1, 2,855 to 2,928 cm−1, and 1,805 to 1,736 cm–1 related to
lipid absorption (Coates, 2000; Lefèvre and Subirade, 2000), and 900 to 1,500 cm−1 related to
C-H bending (1,493 cm−1) and C-O stretching (1,080 and 1,157 cm−1).
Principal component analysis of the untreated spectra allowed the investigation of the
influence plot and the identification of outliers. Milk samples did not show extreme values of
leverage and residual variance, and thus none of them was classified as outlier. The score plot
of first and second PC provided information on samples distribution; in particular, samples
were classified in 2 categories, namely those with RCT longer than 30 min and those with
RCT shorter than 30 min, with the purpose of investigating spectral information from wellcoagulating and NC milks.
Principal components 1 and 2 explained 86 and 8% of the observed variation in the
spectra, respectively (Figure 1). The plot clearly depicts the mixing of all samples, indicating
that there is no specific spectral information related to well-coagulating and NC milks. This
outcome was somewhat expected as the potential of MIR spectroscopy to predict MCP is
related to specific protein and lipid peaks (De Marchi et al., 2009), and NC samples did not
differ in chemical composition from well-coagulating milks. According to results from PCA,
60
a discriminant analysis (presence or absence of NC samples) is not feasible; the only way to
rapidly predict NC samples is to develop MIR prediction models using milk with a wide range
of RCT (from 30 to 60 min).
Prediction of Rennet Coagulation Time, Curd-firming Time, and Curd Firmness
Fitting statistics of prediction models for MCP using untreated spectra are in Table 2.
Prediction models were developed using three MIR spectral regions: 900 to 1,600 cm−1, 1,700
to 3,040 cm−1, and 3,470 to 4,000 cm−1. The number of modified PLS factors used in the
calibration ranged from 12 (k20) to 17 (a30), which is slightly lower than that reported by De
Marchi et al. (2009). The most accurate prediction model was developed for RCT (1-VR and
SECCV of 0.76 and 7.05 min, respectively), followed by k20 (1-VR and SECCV of 0.72 and
3.54 min, respectively), and a30 (1-VR and SECCV of 0.70 and 7.68 mm, respectively). Models
for the prediction of a60 were not satisfactory (1-VR of 0.40 and SECCV of 7.26 mm).
Regarding the practical utility of the prediction models, RPD and RER ranged from 1.26 (a60)
to 2.03 (RCT) and from 5.53 (a60) to 7.47 (k20), respectively.
Only Dal Zotto et al. (2008) and De Marchi et al. (2009) assessed the ability of MIR
spectroscopy to predict RCT and a30, whereas no studies investigated the potential of MIR
spectroscopy to predict MCP of samples that coagulate beyond 30 min from rennet addition.
Prediction models for RCT and a30 were notably better than those reported by Dal Zotto et al.
(2008) and De Marchi et al. (2009) in milk with preservative; the authors reported 1-VR for
a30 that ranged from 0.55 to 0.73, and from 0.35 to 0.45, respectively. Nevertheless the
reference method (Computerized Renneting Meter) used in these studies was different than
that adopted in the present research (Formagraph). The reference method plays a key role in
determining the accuracy of prediction models as reported by Rutten et al. (2009) and De
Marchi et al. (2011) for milk fatty acids. Also, the rennet used by Dal Zotto et al. (2008) and
De Marchi et al. (2009) was different than that adopted in the present work. The
implementation of different methodologies to assess MCP was investigated by Pretto et al.
(2011), who proposed a method for the transformation of values of MCP obtained from
different methodologies, and by Cipolat-Gotet et al. (2012), who compared MCP determined
with an optical instrument, the Optigraph, with MCP obtained from the Formagraph.
Results of the present study highlighted the potential of MIR spectroscopy to predict
k20. Curd-firming time is considered a trait of great practical importance in the dairy industry
as it suggests the optimal time at which curd-cutting should commence, and thus it is related
to product yield and quality (Bynum and Olson, 1982). However, k20 has not been much
61
studied in the past as it is available only for samples attaining 20 mm of curd firmness and
thus not for NC milks. To our knowledge, this is the first study attempting to predict k20 for
samples that coagulated beyond 30 min from enzyme addition using MIR spectroscopy. The
worst prediction model developed in the present research was for a60. The low accuracy of
prediction might be related to low accuracy of reference analysis for NC samples This was
reported by Cipolat-Gotet et al. (2012) who found large variability for curd firmness measured
45 min after rennet addition.
The scatter plots of predicted vs. measured MCP are shown in Figure 2. A quite high
degree of scatter was observed for a60 indicating that the current model is not enough accurate
to be used in the dairy industry but demonstrates the potential of MIR spectroscopy to predict
a60.
To investigate the molecular basis of MCP, the loadings weight of the first, second, and
third PLS components of prediction models were examined (Figure 3). There was
considerable structure in the loading plots of all studied traits. In general, the pattern of
loadings weight of RCT and k20 was specular to that of a30 and a60. A number of peaks were
observed in the fingerprint region from 900 to 1,500 cm-1 (e.g., 992, 1,138, and 1,184 cm-1) of
the spectra and this might be attributable to C-O or C-C stretchings. Characteristic peaks were
also observed from 1,543 to 1,593 cm-1, which can be attributable to amide II. Peaks
associated with lipids (from 2,828 to 2,970, and from 1,751 to 1,763 cm-1) were also apparent
in loadings 1, 2, and 3, as well as peaks from 1,238 and 1,265 cm-1 and from 1,455 to 1,462
cm-1, which may be attributable to O-C-H, C-C-H, or C-O-H bendings. The peaks associated
with protein were found to be very dominant for RCT and k20, whereas those associated with
lipids seem to be more dominant for curd firmness traits. These results highlighted the role of
protein and lipid regions of the MIR spectra to predict MCP, and coincided with findings of
De Marchi et al. (2009) and of several authors who reported the effect of protein and fat
content on milk coagulation (Bastian et al., 1991; Castillo et al., 2003).
CONCLUSIONS
Mid-infrared spectroscopy combined with PLS regressions has been proposed as
potential tool to predict RCT, k20, a30, and a60 in bovine milk samples. Results indicated that
the prediction performance of MIR technique was satisfactory for RCT measured up to 60 min
from rennet addition, and for k20 and a30, and thus it might be used in payment systems to
reward or penalize milk according to MCP. The prediction of MCP in milk samples that
62
coagulate beyond 30 min from rennet addition (NC samples) may have a great importance in
genetic evaluation of animals for MCP. In fact, until now MCP information from NC samples
has been often discarded from genetic analysis, leading to possible biases in the prediction of
sires merit for coagulation traits.
ACKNOWLEDGMENTS
The authors thank the milk laboratory of the Breeders Association of Veneto region
(ARAV, Padova, Italy) and Lucia Ancilotto (University of Padova, Italy) for technical
support. The authors thank the CheeseBull project PSR124 for financial support.
63
Table 1. Descriptive statistics of milk coagulation properties
Trait1
n2
Mean
SD
CV
Minimum
Maximum
RCT, min
319
30.55
14.30
0.47
7.75
59.00
k20, min
147
9.61
6.58
0.68
2.00
28.45
a30, mm
224
26.97
13.88
0.51
0.36
51.30
a60, mm
178
14.76
9.18
0.62
0.76
40.96
1
RCT = rennet coagulation time of samples that coagulated within 60 min from enzyme
addition; k20 = curd-firming time of samples attaining 20 mm of firmness within 60 min from
enzyme addition; a30 = curd firmness 30 min after enzyme addition; a60 = curd firmness 60 min
after enzyme addition.
2
n = number of samples used in the calibration after removing outliers.
64
Table 2. Fitting statistics1 of prediction models for milk coagulation properties
Trait2
#L
SEC
R2
SECCV
1-VR
RPD
RER
RCT, min
15
6.14
0.82
7.05
0.76
2.03
7.28
k20, min
12
2.94
0.80
3.54
0.72
1.86
7.47
a30, mm
17
5.06
0.87
7.68
0.70
1.80
6.63
a60, mm
12
6.20
0.56
7.26
0.40
1.26
5.53
1
#L = number of modified partial least squares factors used in the calibration; SEC = standard
error of calibration; R2 = coefficient of determination of calibration; SECCV = standard error
of cross-validation; 1-VR = coefficient of determination of cross-validation; RPD = ratio
performance deviation; RER = range error ratio.
2
RCT = rennet coagulation time of samples that coagulated within 60 min from enzyme
addition; k20 = curd-firming time of samples attaining 20 mm of firmness within 60 min from
enzyme addition; a30 = curd firmness 30 min after enzyme addition; a60 = curd firmness 60
min after enzyme addition.
65
Figure 1. Plot of first (PC-1) and second (PC-2) components from principal component
analysis of spectral data. Triangles = samples with rennet coagulation time equal or longer
than 30 min; Circles = samples with rennet coagulation time shorter than 30 min.
66
Figure 2. Scatter plots of predicted (y-axis) versus measured (x-axis) milk coagulation properties. (A) Rennet coagulation time of samples that
coagulated within 60 min from enzyme addition (RCT); (B) curd-firming time of samples attaining 20 mm of firmness within 60 min from
enzyme addition (k20); (C) curd firmness 30 min after enzyme addition (a30); and (D) curd firmness 60 min after enzyme addition (a60).
B
70
30
60
25
Predicted k20, min
Predicted RCT, min
A
50
40
30
20
10
67
0
20
15
10
5
0
0
10
20
30
40
50
60
70
0
5
Measured RCT, min
10
15
20
25
30
40
50
60
Measured k20, min
D
70
60
60
50
Predicted a60, mm
Predicted a30, mm
C
50
40
30
20
10
0
40
30
20
10
0
0
10
20
30
40
Measured a30, mm
50
60
70
0
10
20
30
Measured a60, mm
67
Figure 3. Loadings weight of the first (#L1), second (#L2), and third (#L3) partial least
squares regression component for (A) rennet coagulation time of samples that coagulated
within 60 min from enzyme addition; (B) curd-firming time of samples attaining 20 mm
of firmness within 60 min from enzyme addition; (C) curd firmness 30 min after enzyme
addition; and (D) curd firmness 60 min after enzyme addition.
A
B
C
D
68
REFERENCES
Auldist, M. J., K. A. Johnston, N. J. White, W. P. Fitzsimons, and M. J. Boland. 2004. A
comparison of the composition, coagulation characteristics and cheesemaking capacity
of milk from Friesian and Jersey dairy cows. J. Dairy Res. 71:51-57.
Auldist, M., C. Mullins, B. O’Brien, B. T. O’Kennedy, and T. Guinee. 2002. Effect of cow
breed on milk coagulation properties. Milchwissenschaft 57:140-143.
Bastian, E. D., R. J. Brown, and C. A. Ernstrom. 1991. Plasmin activity and milk coagulation.
J. Dairy Sci. 74:3677–3685.
Bynum, D. G., and N. F. Olson. 1982. Influence of curd firmness at cutting on Cheddar cheese
yield and recovery of milk constituents. J. Dairy Sci. 65:2281-2290.
Cassandro, M., A. Comin, M. Ojala, R. Dal Zotto, M. De Marchi, L. Gallo, P. Carnier, and G.
Bittante. 2008. Genetic parameters of milk coagulation properties and their relationships
with milk yield and quality traits in Italian Holstein cows. J. Dairy Sci. 91:371-376.
Castillo, M., F. A. Payne, C. L. Hicks, J. Laencina, and M. B. Lopez. 2003. Effect of protein
and temperature on cutting time prediction in goats’ milk using an optical reflectance
sensor. J. Dairy Res. 70:205–215.
Cecchinato, A., M. Penasa, M. De Marchi, L. Gallo, G. Bittante, and P. Carnier. 2011.
Genetic parameters of coagulation properties, milk yield, quality, and acidity estimated
using coagulating and noncoagulating milk information in Brown Swiss and HolsteinFriesian cows. J. Dairy Sci. 94:4205-4213.
Cipolat-Gotet, C., A. Cecchinato, M. De Marchi, M. Penasa, and G. Bittante. 2012.
Comparison between mechanical and near-infrared methods for assessing coagulation
properties of bovine milk. J. Dairy Sci. 95:6806–6819.
Coates, J. 2000. Interpretation of infrared spectra, a practical approach. Pages 10815–10837 in
Encyclopedia of Analytical Chemistry. R. A. Meyers, ed. John Wiley & Sons, New
York, NY.
Curley, D. M., T. F. Kumosinski, J. J. Unruh, and H. M. Farrell Jr. 1998. Changes in the
secondary structure of bovine casein by Fourier transform infrared spectroscopy: Effects
of calcium and temperature. J. Dairy Sci. 81:3154–3162.
Dal Zotto, R., M. De Marchi, A. Cecchinato, M. Penasa, M. Cassandro, P. Carnier, L. Gallo,
and G. Bittante. 2008. Reproducibility and repeatability of measures of milk coagulation
properties and predictive ability of mid-infrared reflectance spectroscopy. J. Dairy Sci.
91:4103-4112.
69
De Marchi, M., G. Bittante, R. Dal Zotto, C. Dalvit, and M. Cassandro. 2008. Effect of
Holstein-Friesian and Brown Swiss breeds on quality of milk and cheese. J. Dairy Sci.
91:4092–4102.
De Marchi, M., C. C. Fagan, C. P. O'Donnell, A. Cecchinato, R. Dal Zotto, M. Cassandro, M.
Penasa, and G. Bittante. 2009. Prediction of coagulation properties, titratable acidity,
and pH of bovine milk using mid-infrared spectroscopy. J. Dairy Sci. 92:423-432.
De Marchi, M., M. Penasa, A. Cecchinato, M. Mele, P. Secchiari, and G. Bittante. 2011.
Effectiveness of mid-infrared spectroscopy to predict fatty acid composition of Brown
Swiss bovine milk. Animal 5:1653-1658.
De Marchi, M., M. Penasa, F. Tiezzi, V. Toffanin, and M. Cassandro. 2012. Prediction of
milk coagulation properties by Fourier Transform Mid-Infrared Spectroscopy (FTMIR)
for genetic purposes, herd management and dairy profitability. In: 38th International
Committee for Animal Recording (ICAR) Meeting, 28 May - 1 June, Cork, Ireland.
Edney, M. J., J. E. Morgan, P. C. Williams, and L. D. Campbell. 1994. Analysis of feed barley
by near infrared reflectance technology. J. Near Infrared Spec. 2:33–41.
Etzion, Y., R. Linker, U. Cogan, and I. Shmulevich. 2004. Determination of protein
concentration in raw milk by mid-infrared Fourier transform infrared/attenuated total
reflectance spectroscopy. J. Dairy Sci. 87:2779–2788.
Frederiksen, P. D., K. K. Andersen, M. Hammershøj, H. D. Poulsen, J. Sørensen, M. Bakman,
K. B. Qvist, and L. B. Larsen. 2011. Composition and effect of blending of
noncoagulating, poorly coagulating, and well-coagulating bovine milk from individual
Danish Holstein cows. J. Dairy Sci. 94:4787-4799.
Hallén, E., A. Lundén, A.-M. Tyrisevä, M. Westerlind, and A. Andrén. 2010. Composition of
poorly and non-coagulating bovine milk and effect of calcium addition. J. Dairy Res.
77:398-403.
Harzia, H., K. Kilk, I. Jõudu, M. Henno, O. Kärt, and U. Soomets. 2012. Comparison of the
metabolic profiles of noncoagulating and coagulating bovine milk. J. Dairy Sci. 95:533540.
Hewavitharana, A. K., and B. V. Brakel. 1997. Fourier transform infrared spectrometric
method for rapid determination of casein in raw milk. Analyst (Lond.) 122:701–704.
Ikonen, T., K. Ahlfors, R. Kempe, M. Ojala, and O. Ruottinen. 1999. Genetic parameters for
the milk coagulation properties and prevalence of noncoagulating milk in Finnish dairy
cows. J. Dairy Sci. 82:205-214.
70
Ikonen, T., S. Morri, A.-M. Tyrisevä, O. Ruottinen, and M. Ojala. 2004. Genetic and
phenotypic correlations between milk coagulation properties, milk production traits,
somatic cell count, casein content, and pH of milk. J. Dairy Sci. 87:458-467.
Jørgensen, K., and T. Næs. 2004. A design and analysis strategy for situations with
uncontrolled raw material variation. J. Chem. (Kyoto) 18:45–52.
Lefèvre, T., and M. Subirade. 2000. Interaction of β-lactoglobulin with phospholipids
bilayers: A molecular level elucidation as revealed by infrared spectroscopy. Int. J. Biol.
Macromol. 28:59–67.
Mariani, P., A. Summer, G. Zanzucchi, and S. Fieni. 1997. Relazione tra la consistenza del
coagulo – valutata con differenti criteri mediante Formagraph – e il contenuto in caseina
del latte. Ann. Fac. Med. Vet. University of Parma 17:195-204.
Martens, H., and T. Naes. 1989. Models for calibration. Chapter 3 in Multivariate Calibration.
H. Martens and T. Naes, ed. John Wiley & Sons Ltd., London, UK.
O’Brien, B., G. Ryan, W. J. Meaney, D. McDonagh, and A. Kelly. 2002. Effect of frequency
of milking on yield, composition and processing quality of milk. J. Dairy Res. 69:367374.
Okigbo, L. M., G. H. Richardson, R. J. Brown, and C. A. Ernstrom. 1985a. Coagulation
properties of abnormal and normal milk from individual cow quarters. J. Dairy Sci.
68:1893-1896.
Okigbo, L. M., G. H. Richardson, R. J. Brown, and C. A. Ernstrom. 1985b. Effects of pH,
calcium chloride, and chymosin concentration on coagulation properties of abnormal
and normal milk. J. Dairy Sci. 68:2527-2533.
Okigbo, L. M., G. H. Richardson, R. J. Brown, and C. A. Ernstrom. 1985c. Variation in
coagulation properties of milk from individual cows. J. Dairy Sci. 68:822-828.
Penasa, M., M. Cassandro, D. Pretto, M. De Marchi, A. Comin, S. Chessa, R. Dal Zotto, and
G. Bittante. 2010. Short communication: Influence of composite casein genotypes on
additive genetic variation of milk production traits and coagulation properties in
Holstein-Friesian cows. J. Dairy Sci. 93:3346–3349.
Pillonel, L., W. Luginbühl, D. Picque, E. Schaller, R. Tabacchi, and J. O. Bosset. 2003.
Analytical methods for the determination of the geographic origin of Emmental cheese:
Mid- and near-infrared spectroscopy. Eur. Food Res. Technol. 216:174–178.
71
Pretto, D., M. De Marchi, M. Penasa, and M. Cassandro. 2013. Effect of milk composition
and coagulation traits on Grana Padano cheese yield under field conditions. J. Dairy Res.
80:1-5.
Pretto, D., T. Kaart, M. Vallas, I. Jõudu, M. Henno, L. Ancilotto, M. Cassandro, and E. Pärna.
2011. Relationships between milk coagulation property traits analyzed with different
methodologies. J. Dairy Sci. 94:4336-4346.
Riddell-Lawrence, S., and C. L. Hicks. 1989. Effect of curd firmness on stirred curd cheese
yield. J. Dairy Sci. 72:313-321.
Rutten, M. J. M., H. Bovenhuis, K. A. Hettinga, H. J. F. van Valenberg, and J. A. M. van
Arendonk. 2009. Predicting bovine milk fat composition using infrared spectroscopy
based on milk samples collected in winter and summer. J. Dairy Sci. 92:6202–6209.
Sandri, S., F. Tosi, M. S. Mariani, P. Vecchia, M. Malacarne, and A. Summer. 2001.
Osservazioni sull’andamento delle principali caratteristiche casearie del latte per
Parmigiano-Reggiano durante gli anni 1990. Ann. Fac. Med. Vet. University of Parma
21:235-247.
Sinnaeve, G., P. Dardenne, R. Agneessens, and R. Biston. 1994. The use of near infrared
spectroscopy for the analysis of fresh grass silage. J. Near Infrared Spec. 2:79–84.
Tyrisevä, A.-M., K. Elo, A. Kuusipuro, V. Vilva, I. Jänönen, H. Karjalainen, T. Ikonen, and
M. Ojala. 2008. Chromosomal regions underlying noncoagulation of milk in Finnish
Ayrshire cows. Genetics 180:1211-1220.
Tyrisevä, A.-M., T. Ikonen, and M. Ojala. 2003. Repeatability estimates for milk coagulation
traits and non-coagulation of milk in Finnish Ayrshire cows. J. Dairy Res. 70:91-98.
Tyrisevä, A.-M., T. Vahlsten, O. Ruottinen, and M. Ojala. 2004. Noncoagulation of milk in
Finnish Ayrshire and Holstein-Friesian cows and effect of herds on milk coagulation
ability. J. Dairy Sci. 87:3958-3966.
Vallas, M., H. Bovenhuis, T. Kaart, K. Pärna, H. Kiiman, and E. Pärna. 2010. Genetic
parameters for milk coagulation properties in Estonian Holstein cows. J. Dairy Sci.
93:3789-3796.
Wedholm, A., L. B. Larsen, H. Lindmark-Månsson, A. H. Karlsson, and A. Andrén. 2006.
Effect of protein composition on the cheese-making properties of milk from individual
dairy cows. J. Dairy Sci. 89:3296-3305.
Williams, P. C. 2001. Implementation of near-infrared technology. Page 143 in: P. C.
Williams & K. Norris (Eds.), Near-infrared technology in the agricultural and food
72
industries (2nd ed.). St. Paul, Minnesota, USA: American Association of Cereal
Chemists.
Williams, P. C. 2003. Near-infrared technology getting the best out of light. Page 109 in A
Short Course in the Practical Implementation of Near Infrared Spectroscopy for the
User. 1.1 ed. PDKProjects Inc., Nanaimo, Canada.
Williams, P. C., and K. Norris. 2001. Near-infrared technology in the agricultural and food
industries (Second ed.). St. Paul, Minnesota, USA: American Association of Cereal
Chemists, Inc.
73
74
CHAPTER 3
Effectiveness of mid-infrared spectroscopy for prediction of the contents of calcium
and phosphorus, and titratable acidity of milk and their relationship with milk
quality and coagulation properties
Toffanin V, De Marchi M, Lopez-Villalobos N and Cassandro M
International Dairy Journal (2015) 41:68-73
75
76
ABSTRACT
Individual milk samples from Holstein Friesian cows were collected and analysed by
inductively coupled plasma optical emission spectrometry (ICP-OES) and titration for the
determination of Ca and P, and TA contents, respectively. Prediction models were obtained
using partial least squares (PLS) regression analyses using two statistical packages. The
average Ca, P and TA were 1156 mg kg-1, 934 mg kg-1 and 3.42 SH° 50 mL-1, respectively.
Pearson’s correlations between Ca and P and other milk traits were significant (P<0.05) and
ranged from 0.16 to 0.53 for chemical composition traits and from 0.17 to -0.35 for milk
coagulation properties (MCP). Results from the two statistical packages were comparable.
Prediction models using MIR spectroscopy were satisfactory for Ca, P and TA, with
coefficients of correlation of cross-validation greater than 0.73. Moreover, the study
highlighted favourable relationships of these traits with milk coagulation properties.
INTRODUCTION
Minerals from milk, and in particular calcium (Ca) and phosphorus (P), play a key role
on human health. As reported by the FAO (2001), milk Ca provides rigidity to the skeleton by
virtue of its phosphate salts and takes part in neuromuscular function, enzyme-mediated
processes, and blood clotting. During skeletal growth, the increase in bone mineral density is
affected by Ca intake, while during old age this element prevents bone loss and osteoporotic
fractures (Caroli et al., 2011). The effect of P on human health is not completely understood
(Cashman et al., 2006); the Ca to P ratio in milk has been studied intensively, and a high
content of P combined with a low level of Ca seems to be responsible for the stimulation of a
parathyroid hormone, with a reduction of bone mass and density, especially in young people.
Moreover, Ca and P are important in cheese-making process because they have a
strong influence on the ability of milk to coagulate and on the final consistency of the
coagulum (Fossa et al., 1994). In fact, colloidal calcium phosphate (CCP) plays a fundamental
role in all stages of cheese-making, affecting the aggregation speed of paracaseinate particles
and the properties of the casein curd (Mariani et al., 1996). Several other factors are related to
milk coagulation (e.g., type and concentration of the coagulation enzyme, temperature, acidity,
and protein content; O’Callaghan et al., 2002). Milk acidity, and in particular titratable acidity
(TA), affects the aggregation rate of paracaseinate micelles, the reactivity of rennet, and the
rate of syneresis (De Marchi et al., 2009); as reported by Formaggioni et al. (2001), milk with
low acidity is generally considered unsuitable for cheese-making, because of negative effects
77
on the rheology of the rennet curd and on the textural properties of the cheese paste.
Moreover, several studies have investigated the favourable relationships between TA and milk
coagulation properties (MCP; Cassandro et al., 2008; De Marchi et al., 2007; De Marchi et al.,
2009; Penasa et al., 2010; Harzia et al., 2012; Toffanin et al., 2012) and cheese yield (De
Marchi et al., 2013).
The determination of milk minerals as well as TA is time-consuming and has high costs
(Soyeurt et al., 2009; De Marchi et al., 2009); these disadvantages could be overcome by midinfrared (MIR) spectroscopy, an innovative technique widely used in milk laboratories for the
routine prediction of traditional milk components (De Marchi et al., 2014). The possibility of
recording cow phenotypic information on a large scale would enable genetic selection since a
genetic basis, as has been shown for Ca and P content (Davis et al., 2001, Soyeurt et al., 2009,
Van Hulzen et al., 2009) and TA (Colinet et al., 2012).
Recently, De Marchi et al. (2014) reviewed the application of MIR spectroscopy as a
phenotyping tool in the dairy industry, showing the potential of this technique for the
prediction of several non-traditional milk quality traits, such as fatty acid composition (Coppa
et al., 2010; De Marchi et al., 2011; Soyeurt et al., 2011), protein composition (De Marchi et
al., 2009a; Rutten et al., 2011) and MCP (De Marchi et al., 2013). Soyeurt et al. (2009)
investigated the effectiveness of MIR spectroscopy in predicting milk minerals, showing
promising results for Ca, P, and Mg, and suggesting an improvement in the accuracy of the
reference method by using a mineralization process before ICP-OES analysis. Therefore, the
aims of this study were (i) to study variation in levels of Ca, P, and TA in bovine milk and
their relationship with milk quality and coagulation properties and (ii) to investigate the
effectiveness of MIR spectroscopy in predicting milk Ca, P and TA levels using different
statistical approaches.
MATERIAL AND METHODS
Milk samples collection, reference analyses, and spectra collection
A total of 208 individual milk samples of Holstein-Friesian cows from parity 1 to 10
and between 10 and 620 days in milk were collected between January and March 2011 from
13 dairy herds in the North of Italy. Immediately after sampling, milk samples (100 mL) with
preservative (Bronopol, Knoll Pharmaceuticals, Nottingham, UK) were transferred to the
laboratory of the Breeders Association of the Veneto region (Padova, Italy) for milk analyses.
Milk fat, protein and casein contents and pH were determined by Milko-Scan FT6000 (Foss
78
Electric A/S, Hillerød, Denmark), and somatic cell count (SCC) by Cell Fossomatic 250 (Foss
Electric A/S).
Milk coagulation properties (MCP) were determined using a Formagraph (Foss
Electric) as described by Pretto et al. (2011) and De Marchi et al. (2013). Briefly, samples (10
mL) were heated to 35°C and 200 μL of a rennet solution (Hansen Standard 160; Pacovis
Amrein AG, Bern, Switzerland) diluted to 1.6% (w/v) in distilled water was added at the start
of analysis. Rennet coagulation time (RCT, min), which corresponds to the time between the
addition of the clotting enzyme to the milk and the beginning of coagulation, the curd-firming
time (k20, min), the time required to achieve 20 mm of firmness, and the curd firmness (a30,
mm), which is defined as the width, in millimetres, of the diagram 30 min after the addition of
the rennet addition, were determined.
Calcium and P contents in milk were determined after mineralization with nitric acid
in closed vessels by a microwave system using inductively coupled plasma optical emission
spectrometry (ICP-OES), Ciros Vision EOP (SPECTRO Analytical Instruments GmbH,
Kleve, Germany). ICP-OES was employed to determine Ca at 315.887 nm, and P at 178.287
nm. Instrument operating parameters were optimized for acid solution and calibration
standards were matched with nitric acid 5% “suprapure” grade. The elements to be determined
were added from single element solutions (Inorganic Ventures, Christiansburg, VA, USA).
The concentration range of the calibration solutions was between 0 and 100 mg L-1 for both
elements. The accuracy and precision of this method were investigated analysing the certified
reference material BCR® – 063R “Skim milk powder” (Institute for Reference Materials and
Measurements (IRMM), Geel, Belgium) prepared as described above. The measured values
and the certified values were in excellent agreement for all the elements.
Titratable acidity and pH were determined using the Crison Compact D (Crison
Instruments SA, Alella, Spain). Titratable acidity was expressed in Soxhlet-Henkel degrees
(°SH 50 mL-1) as described by Anonymous (1963).
The MIR spectra were collected on milk samples over the spectral range of 4000-900
cm−1 using a Milko-Scan FT6000 (Foss Electric A/S).
Statistical analysis
Prediction equations were obtained using partial least squares (PLS) regression
analyses using two statistical software, The Unscrambler version 10.1 (PLS1; Camo A/S,
Oslo, Norway) and the PLS procedure of SAS version 9.3 (PLS2; SAS Institute Inc., Cary,
NC). Before PLS analyses, two spectra regions (3040 to 3470 cm−1 and 1,600 to 1,700 cm−1)
79
characterized by high noise levels were removed according to Hewavitharana and Brakel
(1997), Jørgensen and Næs (2004), and De Marchi et al. (2013), and anomalous spectra and
reference values were discarded according to the procedures reported by De Marchi et al.
(2013). Models were developed using raw spectra data. The final data accounted for 203, 207,
and 207 records for Ca, P, and TA, respectively.
To compare statistical software both prediction models (PLS1 and PLS2) were
developed using a full cross-validation; this was achieved with a one-at-a-time crossvalidation method in which Unscrambler and SAS used all observations but one for the
calibrated model, which then was used to predict the left-out observation; this process was
repeated for every observation to find the best prediction equation. The prediction equations
chosen were those that minimized the predicted residual sum of squares with the minimum
number of PLS factors.
Several criteria were used to determine the proficiency of predictive models based on
MIR spectroscopy: the coefficient of correlation of cross-validation (rcv), the root mean square
error of cross-validation (RMSEcv), optimum number of PLS factors (#L), and ratio
performance deviation (RPD). The latter statistic is calculated as the ratio of the SD to
RMSEcv for a given trait (Edney, Morgan, Williams, & Campbell, 1994; Williams, 2001).
High values of RPD are desirable; in particular, RPD values greater than 2 enable good
predictions (Sinnaeve et al., 1994; De Marchi et al., 2011).
Finally, the relationships between protein, fat and casein contents, somatic cell count
(SCC) and somatic cell score (SCS, calculated as the logarithm of SCC), RCT, k 20 and a30,
measured Ca, P and TA and predicted Ca (pCa), P (pP) and TA (pTA) were investigated
through SAS procedures (SAS, 2008). Milk samples that did not coagulate within 30 min
(about 13% of total records) were considered missing values with no MCP information.
RESULTS AND DISCUSSION
Descriptive statistics and Pearson correlations
Calcium and P levels were on average 1156.33 and 933.98 mg kg-1, respectively
(Table 1). These values are very similar to those reported by Soyeurt et al. (2009) and van
Hulzen et al. (2009) for bovine milk with Ca and P values that ranged from 1051 to 1447 mg
kg-1 and from 919 to 1221 mg kg-1, respectively. Moreover, values of the present study were
consistent with findings of Cashman (2011) who reported average values of 1120 mg kg-1 and
890 mg kg-1 for measured Ca and P in bovine milk, respectively. The mean values of TA and
80
pH were 3.42 °SH 50 mL-1 and 6.68, respectively (Table 1), which are very similar to those
reported by De Marchi et al. (2008) and Cassandro et al. (2008) for Holstein Friesian bovine
milk. Calcium, P and TA were normally distributed, allowing the development of robust
prediction models. Milk chemical composition and SCS are typical of Italian Holstein Friesian
cow milk and consistent with values reported by the National Herdbook of Italian Holstein
Friesian (ANAFI, 2011) and by Penasa et al. (2014).
Rennet coagulation time, k20, and a30 averaged 18.23 min, 5.70 min, and 24.58 mm,
respectively (Table 1); the CV ranged from 25 (RCT) to 51% (a30). Twenty-seven samples
(12.9% of the total data) did not form a curd within 30 min from the rennet addition. This
percentage of so-called non-coagulating (NC) milk samples is similar to that reported by
Ikonen et al. (2004), Tyrisevä et al. (2004), and Cassandro et al. (2008), who reported
percentages of NC samples between 7.5 and 13.2% for Finnish Ayrshire and Holstein Friesian
cows. Milk coagulation properties of the present study indicated a type of milk not very
suitable for cheese-making and a worsening of these traits across years (Zannoni and
Annibaldi, 1981). Nevertheless, values of MCP are similar to those reported by Penasa et al.
(2014); they reported RCT and a30 values of 21 min and 20.8 mm, respectively, for milk from
multi-breed dairy herds.
Overall, phenotypic correlations between measured Ca, P and TA and milk quality
traits (Table 2) were very similar to those between pCa, pP and pTA and quality traits (Table
3). This was expected because of the high accuracy of MIR spectroscopy prediction models.
Calcium and P were positively correlated with milk chemical composition and varied from
0.27 (Ca and fat content, and P and Fat content) to 0.53 (Ca and protein content, and P and
protein content). Calcium and P were positively correlated with TA, which is consistent with
results reported by Mariani (1982), Mariani and Artoni (1983), Mariani et al. (1989), and
Formaggioni et al. (2001). Those authors found values of correlation close to 0.72 between P
and TA using both individual (Mariani et al., 1983) and bulk (Formaggioni et al., 2001) milk
samples. Moreover, Ca showed a weak positive correlation with pH. As expected, a high
correlation (0.68; P<0.001) was calculated between Ca and P, highlighting their relationship
and reflecting the importance of the Ca/P ratio in milk (Cashman et al., 2006); similar results
were reported by Soyeurt et al. (2009), with a correlation of 0.73. A weak negative correlation
(-0.16; P<0.05) was found between P and SCS; this result was consistent with those reported
by Summer et al. (2010), who studied milk salt equilibria and reported a decrease in total P
with increasing SCC, and so confirmed the opposite relationship between the two traits.
81
Moreover, Summer et al. (2010) found no significant relationship between Ca and SCC,
consistent with the results of the present study.
A favourable relationship was estimated between milk minerals and MCP; an increase
in Ca and P is correlated with an increase of a30, while an increase in Ca reduces RCT. These
relations were found also by Malacarne et al. (2013), who found optimal milk for cheesemaking when these minerals were present at high concentrations.
Milk chemical composition was positively related with TA, with values ranging from
0.22 (P<0.05, TA and fat content) to 0.57 (P<0.001, TA and casein content); these estimates
are comparable to those between pTA and fat content (0.23), and pTA and casein content
(0.64). Cassandro et al. (2008) and Colinet et al. (2010) reported similar correlations in their
studies.
As expected, TA was negatively correlated with RCT and k20 and positively with a30;
this agrees with results of Cassandro at al. (2008) and Toffanin et al. (2012) for Italian
Holstein Friesians, and of De Marchi et al. (2007) in mixed Brown Swiss and Holstein
Friesian herds. Moreover, considering the strong and negative correlation between TA and pH
-0.53 (P<0.001), the correlations between pH and RCT and a30 were 0.42 (P<0.001) and -0.47
(P<0.001), respectively.
MIRS prediction models and PLS methods
Fitting statistics of PLS analysis are shown in Table 4. On average, the accuracy of the
prediction models developed by cross-validation and through different statistical packages
was very similar within each trait; moreover, the satisfactory results of the prediction models
suggested that there is a relation between MIR spectra and the traits studied.
Generally, a robust prediction model should have high rCV, low RMSECV and and RPD
value greater than 2. Results of prediction models for Ca and P were satisfactory, with rCV of
about 0.75 and 0.85, respectively, and this confirmed the effectiveness of MIR spectroscopy in
predicting Ca and P contents of milk. The RPD and #L were 1.47 and 4, and 1.84 and 6 for Ca
and P, respectively.
Very limited information has been reported in the literature about the application of
MIR spectroscopy for the prediction of mineral composition of milk. Results of the present
study are quite similar than those reported by Soyeurt et al. (2009); they found values of 95
mg kg-1 (SECV), 0.93 (rCV), and 2.74 (RPD) for Ca, and 50 mg kg-1 (SECV), 0.92 (rCV), and
2.54 (RPD) for P.
82
However, the present study used a different reference method respect to Soyeurt et al.
(2009); in the present study, the mineral contents were assessed by ICP-OES after
mineralization, while Soyeurt et al. (2009) used ICP-AES without mineralization. Moreover,
in the study of Soyeurt et al. (2009), 6 different cow breeds were included which provided
great biological variability, as confirmed by the coefficients of variation of the studied traits.
Recently, Wu et al. (2012) investigated the potential of near-infrared and MIR spectroscopy
techniques for predicting the calcium content of powdered milk. The predicted results of PLS
models gave very good results, with a coefficient of determination of 0.93 and 5.22% for
relative error of prediction.
The prediction models for TA gave satisfactory results, with correlation coefficients of
cross-validation of 0.86 (Table 4). The RPD values were close to 2, suggesting good
predictive models (Sinnaeve et al., 1994) and #L in cross-validation procedure was 6. These
results were slightly better than those reported by De Marchi et al. (2009), with RMSECV of
0.26 °SH 50 mL-1 and rCV of 0.80, and slightly worse than those reported by Colinet et al.
(2010), with SECV of 0.64°D (Dornic Degree) and rCV of 0.95. Nevertheless, Colinet et al.
(2010) used a different reference method and unit of measurement for TA. Compared to
statistical procedures used in the present study, predictive models proposed by De Marchi et
al. (2009) were developed using untreated spectra data and the Unscrambler software, while
prediction models developed by Colinet et al. (2010) used first derivative spectra pretreatment and WinIsi software.
For each trait, the best regression models are represented in Figure 1; the plot of
measured against predicted values showed a moderate degree of scatter in all cases. Moreover,
the coefficients of determination of cross-validation (R2CV) were 0.56, 0.72, and 0.74 for Ca, P
and TA, respectively. Considering these values, predictions of TA and P were found to be
approximate, and the model for Ca could only discriminate between low and high values
(Williams, 2003).
This is the first study that compares the performance of chemometric with two
statistical packages using the same data and validation procedures. As expected, the results
were very similar for both statistical packages. From a practical point of view, chemometric
analysis by the Unscrambler is more complex and requires more time and steps; in contrast,
SAS seems to be less suitable for spectra visualization and outlier identification. Moreover,
the PLS procedure of SAS allows large data analysis (more than 50,000 samples). This
considerations should be taken into account, because in the future the use of large MIR
83
spectroscopy data to predict new milk phenotypes will be an important tool for dairy industry
(De Marchi et al., 2014).
CONCLUSIONS
Mid-infrared spectroscopy combined with different PLS regressions has been proposed for
prediction of contents of Ca and P, and TA in bovine milk. Prediction equations were
effective in predicting P and TA, and were effective in discriminating between low and high
contents of Ca. Moreover, favourable relationships were found between these traits and MCP,
which might be interesting in improving the suitability of milk for producing cheese. Results
suggest the possibility of using MIR spectroscopy prediction models in large scale research
programs aiming at improving the nutritional aspects of milk by genetic selection of dairy
cattle.
ACKNOWLEDGMENTS
The authors thank the milk laboratory of the Breeders Association of Veneto region (ARAV,
Padova, Italy), Lucia Ancilotto (University of Padova, Italy) and Massimo Cagnin (University
of Padova, Italy) for technical support.
84
Table 1. Descriptive statistics of mineral content, acidity, chemical
composition, and coagulation properties of milk. a
Trait
n
Mean
SD
Skewness
Kurtosis
Ca, (mg kg-1)
208
1,156.33
130.46
0.31
-0.27
P, (mg kg-1)
208
933.98
109.71
0.18
-0.20
TA, (°SH 50 mL-1)
208
3.42
0.36
0.37
0.44
Fat, (%)
181
3.75
0.85
0.22
1.91
Protein, (%)
181
3.35
0.39
0.49
-0.25
Casein, (%)
154
2.55
0.33
0.79
0.38
SCS, (score)
181
4.40
1.26
0.46
-0.22
pH
202
6.68
0.07
-0.05
-0.10
RCT, (min)
181
18.23
4.56
0.15
-0.09
k20, (min)
120
5.70
2.04
0.48
-0.13
a30, (mm)
189
24.58
12.56
0.01
-0.44
a
Abbreviation are: Ca = calcium content; P = phosphorus content; TA =
titratable acidity; SCS = somatic cell score; RCT = rennet coagulation
time; k20 = curd-firming time; a30 = curd firmness.
85
Table 2. Phenotypic correlations between measured mineral levels, acidity, chemical composition, and coagulation properties of milk. a
Trait
Ca, mg kg-1
P, mg kg-1
TA, °SH 50mL-1
Ca,
P,
TA,
Fat,
Protein,
Casein,
SCS,
(mg kg-1)
(mg kg-1)
(°SH 50 mL-1)
(%)
(%)
(%)
(score)
0.68***
0.21**
0.27***
0.53***
0.47***
-0.07ns
0.54***
0.27***
0.53***
0.47***
0.22*
0.48***
0.30***
Fat, %
Protein, %
Casein, %
86
SCS, score
RCT,
k20,
a30,
(min)
(min)
(mm)
0.13†
-0.11ns
-0.35***
0.29***
-0.16*
0.06ns
-0.01ns
-0.23*
0.17*
0.57***
-0.11ns
-0.53***
-0.25**
-0.22*
0.44***
0.27†
-0.01ns
0.07ns
-0.08ns
-0.22*
0.18*
0.99***
0.11ns
-0.08ns
0.04ns
-0.44***
0.27***
0.12ns
-0.31*
-0.10ns
-0.49*
0.43**
0.03ns
0.08ns
-0.09ns
-0.07ns
0.42***
0.13ns
-0.47***
0.39***
-0.79***
pH
pH
RCT, min
-0.86***
k20, min
a
Abbreviation are: Ca = calcium content; P = phosphorus content; TA = titratable acidity; SCS = somatic cell score; RCT = rennet
coagulation time; k20 = curd-firming time; a30 = curd firmness. † P<0.10; * P<0.05; ** P<0.01; *** P<0.001.
86
Table 3. Phenotypic correlations of predicted mineral levels and titratable acidity with chemical composition and coagulation properties of milk. a
Trait
pCa, mg kg-1
pCa,
pP,
pTA,
Fat,
Protein,
Casein,
SCS,
(mg kg-1)
(mg kg-1)
(°SH 50 mL-1)
(%)
(%)
(%)
(score)
0.60***
0.40***
0.35***
0.70***
0.77***
0.01ns
0.69***
0.26**
0.58***
0.55***
0.23**
0.55***
0.64***
pP, mg kg-1
pTA, °SH 50 mL-1
a
k20,
a30,
(min)
(min)
(mm)
0.08ns
0.04ns
-0.40***
0.23**
-0.12ns
-0.07ns
-0.08ns
-0.23*
0.26***
-0.06ns
-0.42***
-0.15*
-0.28**
0.35***
Abbreviations are: pCa = predicted calcium content; pP = predicted phosphorus content; pTA = predicted titratable acidity; SCS = somatic cell
score; RCT = rennet coagulation time; k20 = curd-firming time; a30 = curd firmness.
†
RCT,
pH
P<0.10; * P<0.05; ** P<0.01; *** P<0.001.
87
87
Table 4. Fitting statistics of prediction models for calcium, phosphorus
and titratable acidity.
Traita
Calcium,
Phosphorus,
Titratable acidity,
(mg kg-1)
(mg kg-1)
(°SH 50 mL-1)
PLS1b
n
Mean
PLS2c
PLS1b
PLS2c
PLS1b
PLS2c
203
207
207
1,155.56
933.04
3.42
125.04
103.78
0.34
SD
RMSECV
85.70
85.25
54.67
56.38
0.17
0.17
rCV
0.75
0.73
0.85
0.84
0.86
0.86
RPD
1.46
1.47
1.89
1.84
1.98
2.01
5
4
6
6
6
6
#L
a
Abbreviations are: n = number of samples used in the calibration after
removing outliers; SD = standard deviation; RMSECV = root mean square
error of cross-validation; rCV = coefficient of correlation of crossvalidation; RPD = ratio performance deviation; #L = number of modified
partial least squares factors used in the prediction models.
b
Developed using the Unscrambler software.
c
Developed using SAS software.
88
Figure 1. Scatter plots of predicted versus measured calcium
(panel A), phosphorus (panel B), and titratable acidity (panel C)
using PLS.
A
1,700
1,600
Predicted Calcium, mg kg-1
1,500
1,400
1,300
1,200
1,100
1,000
900
800
700
700
800
900
1,000 1,100 1,200 1,300 1,400 1,500 1,600 1,700
Measured Calcium, mg kg-1
B
1,350
1,250
Predicted Phosphorus, mg kg-1
1,150
1,050
950
850
750
650
550
550
650
750
850
950
1,050
1,150
1,250
1,350
Measured Phosphorus, mg kg-1
C
Predicted Titratable Acidity, SH 50 mL-1
5.00
4.50
4.00
3.50
3.00
2.50
2.00
2.00
2.50
3.00
3.50
4.00
Measured Titratable Acidity, SH 50 mL-1
89
4.50
5.00
REFERENCES
ANAFI. 2011. Book of Statistics. (ANAFI National Italian Holstein Assoc.), Cremona, Italy.
Anonymous. 1963. Sauregradbestimmung nach Soxhlet-Henkel (SH). Titratable acidity
evaluation with the Soxhlet-Henkel (SH) method. Milchwissenschaft, 18:520.
Cashman, K. D. 2006. Milk minerals (including trace elements) and bone health. Int. Dairy J.
16:1389–1398.
Caroli, A. M., A. Poli, D. Ricotta, G. Banfi, and D. Cocchi. 2011. Invited review: Dairy intake
and bone health: a viewpoint from the state of the art. J. Dairy Sci. 94:5249–5262.
Cassandro, M., A. Comin, M. Ojala, R. Dal Zotto, M. De Marchi, L. Gallo, P. Carnier, and G.
Bittante. 2008. Genetic parameters of milk coagulation properties and their relationships
with milk yield and quality traits in Italian Holstein cows. J. Dairy Sci. 91:371–376.
Colinet, F. G., H. Soyeurt, C. Anceau, A. Vanlierde, N. Keyen, P. Dardenne, N. Gengler, and
M. Sindic. 2010. Potential estimation of titratable acidity in cow milk using midinfrared spectrometry. In 37th International Committee for Animal Recording (ICAR)
Meeting, Riga, Latvia. http://www.icar.org/Documents/Riga_2010/ppt/Colinet.pdf.
Colinet F., A. Vanlierde, S. Vanden Bossche, M. Sindic, F. Dehareng, G. Sinnaeve, H.
Soyeurt, C. Bastin, and N. Gengler. 2012. Mid-infrared prediction of milk titratable
acidity and its genetic variability in first-parity cows. http://hdl.handle.net/2268/129982.
Coppa, M., A. Ferlay, C. Leroux, M. Jestin, Y. Chilliard, B. Martin, et al. 2010. Prediction of
milk fatty acid composition by near infrared spectroscopy. Int. Dairy J. 20:182-189.
Davis, S. R., V. C. Farr, S. O. Knowles, J. Lee, E. S. Kolver, and M. J. Auldist. 2001. Sources
of variation in milk calcium content. Aust. J. Dairy Technol. 56:156.
De Marchi, M., G. Bittante, R. Dal Zotto, C. Dalvit, and M. Cassandro. 2008. Effect of
Holstein-Friesian and Brown Swiss breeds on quality of milk and cheese. J. Dairy Sci.
91:4092–4102.
De Marchi, M., V. Bonfatti, A. Cecchinato, G. Di Martino, and P. Carnier. 2009a. Prediction
of protein composition of individual cow milk using mid-infrared spectroscopy. Ital. J.
Anim. Sci. 8(Suppl. 2):399–401.
De Marchi, M., R. Dal Zotto, M. Cassandro, and G. Bittante. 2007. Milk coagulation ability of
five dairy cattle breeds J. Dairy Sci. 90:3986–3992.
De Marchi, M., C. C. Fagan, C. P. O'Donnell, A. Cecchinato, R. Dal Zotto, M. Cassandro, M.
Penasa, and G. Bittante. 2009. Prediction of coagulation properties, titratable acidity,
and pH of bovine milk using mid-infrared spectroscopy. J. Dairy Sci. 92:423–432.
90
De Marchi, M., M. Penasa, A. Cecchinato, M. Mele, P. Secchiari, and G. Bittante. 2011.
Effectiveness of mid-infrared spectroscopy to predict fatty acid composition of Brown
Swiss bovine milk. Animal 5:1653–1658.
De Marchi, M., Toffanin V., Cassandro M., and Penasa M. 2013. Prediction of coagulating
and noncoagulating milk samples using mid-infrared spectroscopy. J. Dairy Sci.
96:4707–4715.
De Marchi, M., V. Toffanin, M. Cassandro, and M. Penasa. 2014. Invited review: Midinfrared spectroscopy as phenotyping tool for milk traits. J. Dairy Sci. 97:1171–1186.
Edney, M. J., J. E. Morgan, P. C. Williams, and L. D. Campbell. 1994. Analysis of feed barley
by near infrared reflectance technology. J. Near Infrared Spec. 2(Spec.):33-41.
FAO. 2001. Human Vitamin and Mineral Requirements. Report of a joint FAO/WHO expert
consultation. Bangkok, Thailand. 152.
Formaggioni, P., M. Malacarne, A. Summer, E. Fossa, and P. Mariani. 2001. Milk with
abnormal acidity. VI. The role of phosphorus content and the rennet-coagulation
properties of Italian Friesian herd milks. Ann. Fac. Med. Vet. Univ. Parma 21:261–268.
Fossa, E., M. Pecorari, S. Sandri, F. Tosi, and P. Mariani. 1994. Il ruolo del contenuto in
caseina del latte nella produzione del Parmigiano-Reggiano: composizione chimica,
caratteristiche di coagulazione e comportamento tecnologico-caseario del latte. Sci.
Tecn. Latt. Cas. 45:519–535.
Harzia, H., K. Kilk, I. Jõudu, M. Henno, O. Kart, and U. Soomets. 2012. Comparison of the
metabolic profiles of noncoagulating and coagulating bovine milk. J. Dairy Sci. 95:533–
540.
Hewavitharana, A. K., and B. V. Brakel. 1997. Fourier transform infrared spectrometric
method for rapid determination of casein in raw milk. Analyst(Lond.) 122:701–704.
Ikonen, T., S. Morri, A.-M. Tyrisevä, O. Ruottinen, and M. Ojala. 2004. Genetic and
phenotypic correlations between milk coagulation properties, milk production traits,
somatic cell count, casein content, and pH of milk. J. Dairy Sci. 87:458–467.
Jørgensen, K., and T. Næs. 2004. A design and analysis strategy for situations with
uncontrolled raw material variation. J. Chemometr. 18:45–52.
Malacarne, M., P. Franceschi, P. Formaggioni, S. Sandri, P. Mariani, and A. Summer. 2013.
Influence of micellar calcium and phosphorus on rennet coagulation properties of cows
milk. J. Dairy Res. 81:1-8.
91
Mariani, P. 1982. Rapporti tra acidimetria e tempo di coagulazione del latte di quattro razze
bovine. Annali Facoltà Medicina Veterinaria, Università of Parma 2:197–208.
Mariani, P., and A. Artoni. 1983. Il latte ad acidità anomala. II. Composizione in casina,
fosforo e acido citrico. Sci. Tecn. Latt. Cas. 34:33–49.
Mariani, P., P. Bonatti, and M. Pecorari. 1989. Il latte ad acidità anomala. IV. Fosforo
solubile, cloruri e tipi di latte ipoacido. Sci. Tecn. Latt. Cas. 40:215–225.
Mariani, P., G. Zanzucchi, and A. Summer. 1996. Contenuto di fosfato di calcio colloidale
e grado di “mineralizzazione” della caseina in campioni di latte di massa di allevamenti
bovini di razza Frisona. L’industria del latte 32:3–16.
O’Callaghan, D. J., C. P. O’Donnell, and F. A. Payne. 2002. Review of systems for
monitoring curd setting during cheesemaking. Int. J. Dairy Technol. 55:65–74.
Penasa, M., M. Cassandro, D. Pretto, M. De Marchi, A. Comin, S. Chessa, R. Dal Zotto, and
G. Bittante. 2010. Short communication: Influence of composite casein genotypes on
additive genetic variation of milk production traits and coagulation properties in
Holstein-Friesian cows. J. Dairy Sci. 93:3346–3349.
Penasa, M., F. Tiezzi, A. Sturaro, M. Cassandro, and M. De Marchi. 2014. A comparison of
the predicted coagulation characteristics and composition of milk from multi-breed
herds of Holstein-Friesian, Brown Swiss and Simmental cows. Int. Dairy J. 35:6-10.
Pretto, D., M. De Marchi, M. Penasa, and M. Cassandro. 2013. Effect of milk composition
and coagulation traits on Grana Padano cheese yield under field conditions. J. Dairy
Res. 80:1–5.
Pretto, D., T. Kaart, M. Vallas, I. Jõudu, M. Henno, L. Ancilotto, M. Cassandro, and E. Pärna.
2011. Relationships between milk coagulation property traits analyzed with different
methodologies. J. Dairy Sci. 94:4336–4346.
Rutten, M. J. M., H. Bovenhuis, J. M. L. Heck, and J. A. M. van Arendonk. 2011. Predicting
bovine milk protein composition based on Fourier transform infrared spectra. J. Dairy
Sci. 94:5683–5690.
SAS Institute, 2008. SAS/STAT Software, Release 9.3. SAS Institute, Inc., Cary, NC.
Sinnaeve, G., P. Dardenne, R. Agneessens, and R. Biston. 1994. The use of near infrared
spectroscopy for the analysis of fresh grass silage. J. Near Infrared Spec. 2(Spec.):79–
84.
92
Soyeurt, H., D. Bruwier, J.-M. Romnee, N. Gengler, C. Bertozzi, D. Veselko, and P.
Dardenne. 2009. Potential estimation of major mineral contents in cow milk using midinfrared spectrometry. J. Dairy Sci. 92:2444–2454.
Soyeurt, H., F. Dehareng, N. Gengler, S. McParland, E. Wall, D. P. Berry, M. Coffey, and P.
Dardenne. 2011. Mid-infrared prediction of bovine milk fatty acids across multiple
breeds, production systems, and countries. J. Dairy Sci. 94:1657–1667.
Summer A., P. Franceschi, M. Malacarne, P. Formaggioni, F. Tosi, G. Tedeschi, and P.
Mariani. 2010. Influence of somatic cell count on mineral content and salt equilibria of
milk. Ital. J. Anim. Sci. 8(S2):435–437.
Toffanin, V., M. De Marchi, M. Penasa, D. Pretto, and M. Cassandro. 2012. Characterization
of milk coagulation ability in bulk milk samples. Acta Agr. Slov. 3:93–98.
Tyrisevä, A.-M., T. Vahlsten, O. Ruottinen, and M. Ojala. 2004. Noncoagulation of milk in
Finnish Ayrshire and Holstein-Friesian cows and effect of herds on milk coagulation
ability. J. Dairy Sci. 87:3958–3966.
Van Hulzen, K. J. E., R. C. Sprong, R. van der Meer, and J. A. M. Van Arendonk. 2009.
Genetic and nongenetic variation in concentration of selenium, calcium, potassium,
zinc, magnesium, and phosphorus in milk of Dutch Holstein-Friesian cows. J. Dairy Sci.
92:5754–5759.
Williams, P. C. 2001. Implementation of near-infrared technology. Page 143 in Near-Infrared
Technology in the Agricultural and Food Industries, 2nd ed. P. C. Williams & K. Norris,
ed. American Association of Cereal Chemists, St. Paul, MN.
Williams, P. C. 2003. Near-infrared technology getting the best out of light. Page 109 in A
Short Course in the Practical Implementation of Near Infrared Spectroscopy for the
User. 1.1 ed. PDK Projects Inc., Nanaimo, Canada.
Wu, D., P. C. Nie, Y. He, and Y. D. Bao. 2012. Determination of calcium content in
powdered milk using near and mid-infrared spectroscopy with variable selection and
chemometrics. Food Bioprocess Technol. 5:1402–1410.
Zannoni, M., and S. Annibaldi. 1981. Standardization of the renneting ability of milk by
Formagraph. Sci. Tecn. Latt. Cas. 32:79–94.
93
94
CHAPTER 4
Genetic parameters for milk mineral content and acidity predicted by mid-infrared
spectroscopy in Holstein-Friesian cows
Toffanin V, Penasa M, McParland S, Berry DP, Cassandro M and De Marchi M
Accepted for publication in Animal journal
95
96
ABSTRACT
The aim of the present study was to estimate genetic parameters for calcium (Ca),
phosphorus (P) and titratable acidity (TA) in bovine milk predicted by mid-infrared
spectroscopy (MIRS). Data consisted of 2458 Italian Holstein-Friesian cows sampled once in
220 farms. Information per sample on protein and fat percentage, pH, and somatic cell count,
as well as test-day milk yield, was also available. (Co)variance components were estimated
using univariate and bivariate animal linear mixed models. Fixed effects considered in the
analyses were herd of sampling, parity, lactation stage, and a two-way interaction between
parity and lactation stage; an additive genetic and residual term were included in the models as
random effects. Estimates of heritability for Ca, P, and TA were 0.10, 0.12, and 0.26,
respectively. Positive moderate to strong phenotypic correlations (0.33 to 0.82) existed
between Ca, P and TA, while phenotypic weak to moderate correlations (0.00 to 0.45) existed
between these traits with both milk quality and yield. Moderate to strong genetic correlations
(0.28 to 0.92) existed between Ca, P, and TA, and between these predicted traits with both fat
and protein percentage (0.35 to 0.91). The existence of heritable genetic variation for Ca, P,
and TA, coupled with the potential to predict these components for routine cow milk testing,
imply that genetic gain in these traits is indeed possible.
Keywords: milk mineral, milk acidity, mid-infrared spectroscopy, Holstein-Friesian cow,
genetic parameter
IMPLICATIONS
The present study quantified the phenotypic and genetic characteristics of cow milk
calcium, phosphorus and acidity predicted by mid-infrared spectroscopy. These milk features
are very important for both human health and the technological properties of milk. The
existence of heritable genetic variation coupled with the potential to predict these components
for routine cow milk testing, imply that genetic gain in these traits is indeed possible.
INTRODUCTION
Global demand for dairy products is increasing, especially milk powder and butter, and
further expansion of trade in dairy products is expected. Moreover, in recent years, there is a
growing interest in milk components with potential benefits for human health. Milk mineral
profile, in particular calcium (Ca) and phosphorus (P) content, play a key role in human health
(Caroli et al., 2011), especially for osteoporosis which is a progressive bone disease related to
97
deficiencies in Ca and vitamin D. Both Ca and P are also important in cheese-making as they
influence the coagulation process and the final consistency of the curd (Fossa et al., 1994).
Another characteristic which affects the technological properties of milk is titratable
acidity (TA) which has a key role in the aggregation rate of para-casein micelles, in the
reactivity of rennet (De Marchi et al., 2009) and also on milk coagulation properties (De
Marchi et al., 2007).
There is a paucity of studies which have estimated genetic variation for milk mineral
content and acidity. Van Hulzen et al. (2009) reported heritability estimates of 0.57 and 0.62
for milk Ca and P content, respectively, in 1860 Dutch Friesian cows. Reported heritability
estimates for milk TA range from 0.17 to 0.23 in Italian Holstein cows (Cassandro et al.,
2008; Cecchinato et al., 2011). To our knowledge, only Soyeurt et al. (2008a) used 5502
multi-breed cows to estimate genetic parameters for mineral content of milk predicted by midinfrared spectroscopy (MIRS) and they reported heritabilities of 0.42 and 0.47 for Ca and P,
respectively.
The limited number of studies on the genetics of milk mineral composition and acidity is
likely related to the high analytical costs associated with measuring these traits, thereby
hindering the generation of large data sets (De Marchi et al., 2014). Mid-infrared spectroscopy
has already been proposed to predict milk Ca and P (Soyeurt et al., 2008a; Toffanin et al.,
2015), thereby providing a low-cost approach to generate large datasets useful for genetic
evaluations. The objective therefore of the present study was to estimate genetic parameters
for milk Ca, P and TA predicted by MIRS as well as the genetic correlations between these
traits with milk production and quality in Italian Holstein-Friesian cows.
MATERIALS AND METHODS
Data and MIRS prediction models
A total of 2458 Holstein-Friesian cows representing the offspring of 210 AI sires were
sampled once in 220 Italian dairy herds between May 2010 and March 2011. Cows were from
parity 1 to 10, and between 5 and 600 days in milk (DIM). Information on parity, DIM, and
milk yield (MY, kg/day) at the time of milk sampling was provided by the Breeders
Association of the Veneto region (Padova, Italy). Samples were preserved with Bronopol
(Knoll Pharmaceuticals, Nottingham, UK), transported to the laboratory of the Breeders
Association of the Veneto region (Padova, Italy), and analysed within 12 hours of collection.
The routine prediction of milk fat and protein percentage as well as pH were conducted with a
98
Milko-Scan FT6000 (Foss Electric A/S, Hillerød, Denmark) and somatic cell count (SCC)
was determined using a Cell Fossomatic 250 (Foss Electric A/S, Hillerød, Denmark). Somatic
cell count was transformed to somatic cell score (SCS) by taking the natural logarithm of
SCC. Spectral information was stored for all milk samples.
Predicted Ca and P content, and TA were obtained using MIRS models developed by
Toffanin et al. (2015). Briefly, calibration models were built using 208 cow milk samples
collected from 13 herds chosen from those analysed in the present study. The gold standard
method for the quantification of Ca and P was based on inductively coupled plasma optical
emission spectrometry (ICP-OES) with previous milk mineralization; for TA the gold
standard was milk titration. Prediction models were developed through partial least squares
regression analysis using the PLS procedure of SAS (SAS Institute Inc., Cary, NC).
Coefficients of correlation of the models were 0.73, 0.84 and 0.86 for Ca, P and TA,
respectively, and the ratio performance deviation was 1.47 for Ca, 1.84 for P and 2.01 for TA
(Toffanin et al., 2015).
Statistical analyses
Factors associated with the traits of interest were determined using the following linear
model in PROC GLM (SAS Institute Inc., Cary, NC, USA):
Yijkl = µ + Herdi + parityj + stagek + (parity x stage)jk + eijkl,
where Yijkl is the dependent variable (Ca, P, TA, pH, fat percentage, protein percentage, SCS
or MY); µ is the overall mean; Herdi is the fixed effect of the ith herd of sampling (i = 1 to
220); parityj is the fixed effect of the jth parity of the cow (j = 1, 2, 3, ≥4); stagek is the fixed
effect of the kth class of DIM (k = 5-35, 36-65, 66-95, …, 306-350, 351-450, >450 days);
(parity x stage)jk is the fixed interaction effect between parity and stage of lactation; and eijkl is
the random residual ~N(0, σ2e). In the model, the herd and test-day effects were confounded
because cows in each herd were sampled only once, all on the same test-day.
Variance and covariance components for the studied traits were estimated using
univariate and bivariate animal models in ASREML (Gilmour et al., 2009). Fixed effects
considered in the analyses were the same as described previously, and the random effects were
the additive genetic effect and the residual term. The number of animals in the additive
relationship matrix was 33 197 and included individuals with phenotypic records and their
ancestors up to 23 generations back. Pedigree information was provided by the Italian
Holstein Friesian Cattle Breeders Association (Cremona, Italy).
99
RESULTS
Descriptive statistics
Predicted Ca, P, TA, and pH averaged 1171 mg/kg, 935 mg/kg, 3.41 °SH/50mL and 6.63,
respectively (Table 1). The coefficient of variation was 0.13 for both Ca and P, 0.08 for TA,
and 0.01 for pH.
The effect of lactation stage on Ca and P content was similar (Figure 1); both components
decreased rapidly within the first 2 months of lactation and increased thereafter. The trend for
TA and pH in early to mid-lactation was opposite to each other (Figure 2); milk TA decreased
markedly in the 1st month after calving, reached a plateau during the 2nd month, and increased
thereafter, whereas milk pH increased until the 5th month after calving and decreased slightly
thereafter (Figure 2).
Least squares means for the milk characteristics in each parity are in Table 2. Predicted
mineral content and TA were inversely related to parity (P < 0.05); pH did not change among
parities with the exception of parity one which exhibited the lowest pH value (P < 0.05).
Significant parity effects were detected for MY, protein percentage and SCS, while no effects
were detected for fat percentage.
Heritability
Estimates of heritability for predicted Ca, P, and TA were 0.10, 0.12, and 0.26,
respectively (Table 1), and they ranged from 0.09 (SCS) to 0.25 (fat percentage) for milk
quality and yield. The coefficients of genetic variation for the minerals and TA were lower
than those of fat percentage, SCS and MY, but comparable to that of protein percentage.
Practically no genetic variation in milk pH existed with a detected coefficient of genetic
variation of only 0.004.
Phenotypic and genetic correlations
Predicted Ca was moderately phenotypically correlated with both P (0.33) and TA (0.40),
while P was strongly correlated (0.82) with TA (Table 3). A moderate negative phenotypic
correlation (-0.38) existed between TA and pH. Phenotypic correlations of the milk minerals
and TA with milk chemical composition varied from 0.00 (TA and SCS) to 0.45 (TA and
protein percentage). Milk yield was negatively phenotypically correlated with Ca, P and TA,
albeit all correlations were weak (-0.23 to -0.11; Table 3).
Strong and significant (P < 0.05) genetic correlations existed between TA and P (0.92)
and between Ca and P (0.67). Genetic correlations of Ca, P and TA with fat and protein
100
percentages ranged from 0.35 (TA and fat percentage; P < 0.05) to 0.91 (P and protein
percentage; P < 0.05), and with SCS and MY the correlations were weak to moderate and not
significantly different from zero (P > 0.05; Table 3).
DISCUSSION
Descriptive statistics
Mean milk Ca and P in the present study are within the ranges of values documented by
van Hulzen et al. (2009), Cashman (2011) and Toffanin et al. (2015), who reported average
values from 1120 to 1235 mg/kg and from 890 to 1027 mg/kg for measured Ca and P in
bovine milk, respectively. Moreover, van Hulzen et al. (2009) and Toffanin et al. (2015)
documented a phenotypic coefficient of variation between 9% and 12% for measured Ca and
P in milk of Holstein-Friesian cows. Soyeurt et al. (2009) investigated the feasibility of MIRS
to predict the content of milk minerals using the ICP-AES without previous mineralization as
the reference method. Despite differences in pre-treatment for ICP-AES as well as the data
originating from two separate populations of cows, similar means and coefficients of variation
were observed between the present study and the aforementioned study of Soyeurt et al.
(2009).
Parity least squares means for Ca and P (Table 2) followed a similar trend to that
described by Kume et al. (1998) in Japanese Holstein cows, who reported a slight decrease in
milk mineral concentration after first parity, even if not statistically significant. The decrease
in milk Ca and P content within increasing parity is probably due to the reduced utilization of
these minerals in the mammary gland (Kume and Tanabe, 1993). Indeed, serum Ca and P
concentration is also inversely related to parity number (Shappell et al., 1987; Romo et al.,
1991) justifying the hypothesis of a lower utilization in older cows. Van de Braak and Van’t
Klooster (1987) argued that osteoplastic activities are less intense in older than in younger
cows, which could explain a decreased responsiveness for PTH-mediated Ca resorption and
intestinal absorption in older parity cows (Romo et al., 1991). Moreover, the greater amount
of milk produced by older cows during lactation could explain the lower mineral content
because of the dilution.
The association between lactation stage and Ca in the present study (Figure 1)
corroborates the observed increase in milk Ca content across lactation documented by van
Hulzen et al. (2009) in 1860 Dutch Holstein-Friesian cows. Similar effects have been
documented in other dairy species such as goat and sheep (Sahan et al., 2005; Kondyli et al.,
101
2007). Trends of minerals across DIM might be due to changes in feeding composition across
lactation (Cashman and Flynn, 2003) or to a dilution effect during lactation; negative
phenotypic correlations between MY with both Ca (-0.23) and P (-0.14) were observed in the
present study after adjustment for terms in the statistical model (Table 3).
Mean milk TA across all samples in the present study is similar to documented values of
TA in the milk of Holstein-Friesian (Cassandro et al., 2008) and Brown Swiss cows (De
Marchi et al., 2007, 2008; Cecchinato et al., 2011; Penasa et al., 2014) and in herd bulk milk
samples destined for Grana Padano cheese production (Pretto et al., 2013). Moreover, mean
TA in the present study is similar to reported values of MIRS-predicted TA by De Marchi et
al. (2009), Colinet et al. (2010) and Toffanin et al. (2015). The lower pH in first compared to
later parity cows corroborates results of Ikonen et al. (2004) and could be the consequence, at
least partly, of the higher values of P and TA in first lactation cows (Table 2), and the inverse
relationships between these minerals and pH (Table 3). The interrelationships between milk
acidity and mineral content have been previously investigated (Mariani et al., 1989). The
similar patterns of TA and minerals across stages of lactation (Figures 1 and 2) could be
explained by the nature of these traits; TA is moderately phenotypically correlated with both
protein percentage and Ca, as well as being strongly correlated with P (Table 3). As a
consequence, it is expected that TA follows the trend of minerals across lactation, which
decreases markedly in early lactation, increasing thereafter.
Descriptive statistics of milk chemical composition and MY are in agreement with those
documented in several studies on Italian Holstein-Friesian cows (Cassandro et al., 2008;
Pretto et al., 2011; Tiezzi et al., 2013), with the exception of SCS, which exhibited a smaller
phenotypic coefficient of variation in the present study. Parity mean milk composition and
yield (Table 2) were generally in agreement with other studied international populations of
dairy cows (Ikonen et al., 2004; Hansen et al., 2006; Bastin et al., 2013).
Heritabilities
Heritability estimates of Ca and P were markedly lower than those reported by Soyeurt et
al. (2008b) who predicted Ca and P using MIRS with similar accuracy to the equations used in
the present study. Differences in number and variability of data could explain different
estimates between the present study and that of Soyeurt et al. (2008b). Using data on
measured Ca and P, Van Hulzen et al. (2009) reported similar heritability estimates for Ca and
P to those documented by Soyeurt et al. (2008b). The lower heritability estimates obtained in
the present study could be also related to the MIRS prediction models performance: the less
102
than perfect predictions will likely increase the residual variance and thus reduce the
heritability. Nevertheless, the presence of genetic variation in these traits, albeit with
coefficients of genetic variation generally less than observed for other performance traits like
milk production, suggests that genetic improvement is still nonetheless possible. This is
especially true because milk MIRS information is routinely available on all milk samples
taken during milk testing. Moreover, it has been reported that also in the case of quite low
accuracy of prediction, the genetic correlations between predicted and true values are strong.
This was demonstrated by Cecchinato et al. (2009) who compared genetic parameters from
predicted (with accuracies similar to those obtained in the present study) and measured values
of milk coagulation properties: those authors concluded that the genetic response in milk
coagulation properties from selection using MIRS predictions as indicator traits is expected to
be equal to or slightly lower than the response achievable through direct measurement of the
traits (Cecchinato et al., 2009).
The accuracy of selection for both milk Ca and P based on information on 100 half-sib
daughters (ignoring parental contribution) in a univariate genetic evaluation is 0.86. Assuming
a genetic gain of 0.22 standard deviations annually, this equates to a potential genetic gain of
7.3 mg/kg and 6.9 mg/kg for Ca and P, respectively. The actual gain achievable however will
be dependent on the traits in the breeding goal, their covariances with Ca and P and their
relative weighting within the breeding goal, as well as other factors like intensity of selection,
accuracy of selection and generation interval (Rendel and Robertson, 1950).
To our knowledge, this is the first study to estimate genetic parameters for TA predicted
by MIRS. Heritability estimates for actual TA, determined using Soxhlet-Henkel degrees, has
been reported to range between 0.17 to 0.23 in Holstein-Friesian (Cassandro et al., 2008) and
Brown Swiss cows (Cecchinato et al., 2011). The heritability of pH in the present study (0.16)
is within the range of 0.06 (Cecchinato et al., 2011) to 0.38 (Ikonen et al., 2004) reported in
other populations. The lack of genetic variation in pH observed in the present study suggests
limited potential for change through breeding; the small phenotypic coefficient of variation for
pH, also suggests limited potential for alteration of milk pH in the dairy cow through nonbreeding means.
Phenotypic and genetic correlations
Both the phenotypic and genetic correlations between Ca and P observed in the present
study were consistent with correlations reported by Soyeurt et al. (2008b) from a large multibreed population of dairy cows. The phenotypic correlation between measures of P and TA
103
has been reported to range from 0.54 to 0.81 (Mariani et al., 1989; Toffanin et al., 2015),
depending on whether individual or bulk milk samples or whether single or multi-breed
populations were considered. As expected, the phenotypic correlation between P and pH in
the present study was negative, although weak, reflecting the link between P and TA (positive
and strong) and between TA and pH (negative and moderate). The phenotypic correlation
between TA and P was also confirmed by the effect of lactation stage on each trait being a
mirror of the other (Figure 2). Similar correlations were reported by Mariani et al. (1989) who
assessed a phenotypic correlation of -0.61 between pH and soluble P.
No study has previously estimated the genetic correlations between milk mineral content
and other milk components. Predicted Ca and P were positively and moderately (phenotypic)
to strongly (genetic) correlated with milk protein and fat percentage. After all, as reported by
Malacarne et al. (2013), micellar P can be present as part of colloidal calcium phosphate or
covalently bound to caseins as phosphate groups, given that Ca and P are basic components of
the milk micelles. Milk yield was moderately and not significantly (P > 0.05) related to Ca, P
and TA, suggesting independence of production from mineral content and acidity of milk.
However, it is likely that the lack of significance in the present study was the consequence of
the relatively small sample size which led to quite high standard errors for some estimates of
genetic correlations. The use of MIRS models to predict milk mineral content and TA at
population level will reduce the sampling variance.
CONCLUSIONS
Improvement in milk mineral and acidity profiles could be of benefit for the human
nutritional and technological characteristics of milk. The existence of heritable genetic
variation coupled with the ability to predict these milk characteristics through routinely
available MIRS suggests that genetic selection for these components in milk is indeed
possible. Moreover, because Ca, P, and TA are genetically correlated with milk protein and fat
percentage, breeding goals that select for improved milk fat and protein concentration are
likely to be indirectly selecting also for improved milk Ca, P and TA.
ACKNOWLEDGEMENTS
The authors thank the laboratory of the Breeders Association of the Veneto region (Padova,
Italy) for providing data, the Italian Holstein Friesian Cattle Breeders Association (ANAFI,
Cremona, Italy) for pedigree information, Dr. Denis Pretto (Estonian University of Life
104
Sciences, Estonia) and Lucia Ancilotto (University of Padova, Italy) for technical support, and
“CPDA134308/13” project for financial support.
105
Table 1. Mean, coefficient of genetic variation (CVg), estimated heritability (h2;
standard errors in parentheses) of milk mineral components, acidity, chemical
composition and yield
Trait1
N
Mean
CVg
h2 (s.e.)2
Ca (mg/kg)
2428
1171
0.03
0.10 (0.04)
P (mg/kg)
2353
935
0.04
0.12 (0.05)
TA (°SH/50mL)
2019
3.41
0.03
0.26 (0.07)
pH
2440
6.63
0.004
0.16 (0.05)
Fat (%)
2456
3.69
0.09
0.25 (0.06)
Protein (%)
2458
3.37
0.04
0.20 (0.05)
SCS (units)
2451
4.62
0.08
0.09 (0.04)
2285
30.19
0.07
0.12 (0.05)
Mineral component
Acidity
Quality traits
Milk yield (kg/day)
1
Ca = calcium; P = phosphorus; TA = titratable acidity; SCS = somatic cell score
[SCS = ln(SCC)], where SCC is somatic cell count.
2
All estimates of heritability are significantly different from zero (P < 0.05).
106
Table 2. Least squares means and pooled standard errors (s.e.) for milk mineral components,
acidity, chemical composition and yield across parities
Parity
Trait1
1
2
3
4 and later
s.e.
Ca (mg/kg)
1185a
1185a
1162b
1152b
6
P (mg/kg)
965a
942b
929b
931b
5
TA (°SH/50mL)
3.49a
3.36b
3.30c
3.27c
0.01
pH
6.62a
6.64b
6.63b
6.64b
0.00
Fat (%)
3.80a
3.80a
3.76a
3.77a
0.03
Protein (%)
3.44a
3.48b
3.43a
3.40a
0.01
SCS (units)
a
b
c
Mineral component
Acidity
Quality traits
Milk yield (kg/day)
1
bc
4.55
4.82
4.94
5.14
0.06
26.8a
28.6b
30.5c
29.7bc
0.3
Ca = calcium; P = phosphorus; TA = titratable acidity; SCS = somatic cell score [SCS =
ln(SCC)], where SCC is somatic cell count.
a-c
means with different superscripts within a row are significantly different (P < 0.05).
107
Table 3. Phenotypic (above diagonal, with standard errors in parentheses) and genetic (below diagonal, with standard errors in
parentheses) correlations between milk mineral components, acidity, chemical composition and yield
Trait1
Ca
Ca
P
TA
pH
Fat
Protein
SCS
MY
0.33(0.02)
0.40(0.02)
0.01(0.02)
0.32(0.02)
0.44(0.02)
0.06(0.02)
-0.23(0.02)
0.82(0.01)
-0.10(0.02)
0.25(0.02)
0.39(0.02)
0.03(0.02)
-0.14(0.02)
-0.38(0.02)
0.24(0.02)
0.45(0.02)
0.00(0.02)
-0.11(0.03)
-0.16(0.02)
-0.09(0.02)
0.13(0.02)
0.01(0.02)
0.37(0.02)
0.08(0.02)
-0.27(0.02)
0.16(0.02)
-0.35(0.02)
108
P
0.67(0.24)*
TA
0.28(0.25)
0.92(0.05)*
pH
0.19(0.29)
-0.06(0.25)
-0.30(0.19)
Fat
0.76(0.15)*
0.83(0.14)*
0.35(0.17)*
-0.29(0.19)
Protein
0.84(0.14)*
0.91(0.10)*
0.69(0.12)*
-0.02(0.22)
0.75(0.11)*
SCS
-0.02(0.33)
0.20(0.30)
0.38(0.25)
-0.14(0.29)
0.38(0.24)
0.40(0.24)
MY
-0.26(0.30)
-0.31(0.28)
-0.46(0.24)
0.28(0.25)
-0.19(0.23)
-0.44(0.21)
1
-0.18(0.02)
-0.08(0.31)
Ca = calcium; P = phosphorus; TA = titratable acidity; SCS = somatic cell score [SCS = ln(SCC)], where SCC is somatic cell count.
*Genetic correlations are significantly different from zero at P < 0.05.
108
Figure 1. Least squares means (with standard errors) of predicted calcium (Ca - continuous
line) and phosphorus (P - dashed line) across days in milk.
1000
1180
975
Ca, mg/kg
1150
950
1120
925
1090
P, mg/kg
1210
900
1060
1030
875
1000
850
Days in milk
Figure 2. Least squares means (with standard errors) of predicted titratable acidity (TA black line) and pH (grey line) across days in milk.
3.50
6.66
6.65
6.64
6.63
3.40
6.62
3.35
6.61
6.60
3.30
6.59
6.58
3.25
6.57
3.20
6.56
Days in milk
109
pH
TA, °SH/50mL
3.45
REFERENCES
Bastin, C., H. Soyeurt, and N. Gengler. 2013. Genetic parameters of milk production traits and
fatty acid contents in milk for Holstein cows in parity 1–3. J. Anim. Breed Genet.
130:118-127.
Caroli, A.M., A. Poli, D. Ricotta, G. Banfi G, and D. Cocchi. 2011. Invited review: Dairy
intake and bone health: A viewpoint from the state of the art. J. Dairy Sci. 94:5249–
5262.
Cashman, K.D. 2011. Macroelements, nutritional significance. In Encyclopedia of Dairy
Sciences (ed. JW Fuquay, PF Fox and PLH McSweeney), 2nd edition, 925-932.
Academic Press, San Diego, CA, USA.
Cashman, K.D., and A. Flynn. 2003. Sodium effects on bone and calcium metabolism. In
Nutritional Aspects of Bone Health (ed. S New and J-P Bonjour), 267-289. Royal
Society of Chemistry, London, UK.
Cassandro, M., A. Comin, M. Ojala, R. Dal Zotto, M. De Marchi, L. Gallo, P. Carnier, and G.
Bittante. 2008. Genetic parameters of milk coagulation properties and their relationships
with milk yield and quality traits in Italian Holstein cows. J. Dairy Sci. 91:371–376.
Cecchinato, A., M. Penasa, M. De Marchi, L. Gallo, G. Bittante, and P. Carnier. 2011.
Genetic parameters of coagulation properties, milk yield, quality, and acidity estimated
using coagulating and noncoagulating milk information in Brown Swiss and HolsteinFriesian cows. J. Dairy Sci. 94:4205-4213.
Colinet, F.G., H. Soyeurt, C. Anceau, A. Vanlierde, N. Keyen, P. Dardenne, N. Gengler, and
M. Sindic. 2010. Potential estimation of titratable acidity in cow milk using midinfrared spectrometry. Proceedings of the 37th International Committee for Animal
Recording (ICAR) Meeting, 31 May - 4 June 2010, Riga, Latvia. Retrieved on 15 May
2014, from http://www.icar.org/Documents/Riga_2010/ppt/Colinet.pdf.
De Marchi, M., G. Bittante, R. Dal Zotto, C. Dalvit, and M. Cassandro. 2008. Effect of
Holstein-Friesian and Brown Swiss breeds on quality of milk and cheese. J. Dairy Sci.
91:4092–4102.
De Marchi, M., R. Dal Zotto, M. Cassandro, and G. Bittante. 2007. Milk coagulation ability of
five dairy cattle breeds. J. Dairy Sci. 90:3986–3992.
De Marchi, M., C.C. Fagan, C.P. O'Donnell, A. Cecchinato, R. Dal Zotto, M. Cassandro, M.
Penasa, and G. Bittante. 2009. Prediction of coagulation properties, titratable acidity,
and pH of bovine milk using mid-infrared spectroscopy. J. Dairy Sci. 92:423-432.
110
De Marchi, M., V. Toffanin, M. Cassandro and M. Penasa. 2014. Invited review: Mid-infrared
spectroscopy as phenotyping tool for milk traits. J. Dairy Sci. 97:1171-1186.
Fossa, E., M. Pecorari, S. Sandri, F. Tosi, and P. Mariani. 1994. Il ruolo del contenuto in
caseina del latte nella produzione del Parmigiano-Reggiano: composizione chimica,
caratteristiche di coagulazione e comportamento tecnologico-caseario del latte. Sci.
Tecn. Latt. Cas. 45:519-535.
Gilmour, A.R., B.J. Gogel, B.R. Cullis, and R. Thompson. 2009. ASREML User Guide
Release 3.0 VSN International Ltd, Hemel Hempstead, HP1 1ES, UK. www.vsni.co.uk
Hansen, J.V., N.C. Friggens, and S. Højsgaard. 2006. The influence of breed and parity on
milk yield, and milk yield acceleration curves. Livest. Sci. 104:53-62.
Ikonen, T., S. Morri, A.M. Tyrisevä, O. Ruottinen, and M. Ojala. 2004. Genetic and
phenotypic correlations between milk coagulation properties, milk production traits,
somatic cell count, casein content, and pH of milk. J. Dairy Sci. 87:458-467.
Kondyli, E., M.C. Katsiari, and L.P. Voutsinas. 2007. Variations of vitamin and mineral
contents in raw goat milk of the indigenous Greek breed during lactation. Food
Chem. 100:226–230.
Kume, S., and S. Tanabe. 1993. Effect of parity on colostral mineral concentrations of
Holstein cows and value of colostrum as a mineral source for newborn calves. J. Dairy
Sci. 76:1654-1660.
Kume, S., E. Yamamoto, T. Kudo, T. Toharmat, and I. Nonaka. 1998. Effect of parity on
mineral concentration in milk and plasma of Holstein cows during early lactation. Asian
Austral. J. Anim. 11:133-138.
Malacarne, M., P. Franceschi, P. Formaggioni, S. Sandri, P. Mariani, and A. Summer. 2013.
Influence of micellar calcium and phosphorus on rennet coagulation properties of cows
milk. J. Dairy Res. 81:1-8.
Mariani, P., P. Bonatti, and M. Pecorari. 1989. Il latte ad acidità anomala. IV. Fosforo
solubile, cloruri e tipi di latte ipoacido. Sci. Tecn. Latt. Cas. 40:215–225.
Penasa, M., F. Tiezzi, A. Sturaro, M. Cassandro, and M. De Marchi. 2014. A comparison of
the predicted coagulation characteristics and composition of milk from multi-breed
herds of Holstein-Friesian, Brown Swiss and Simmental cows. Int. Dairy J. 35:6-10.
Pretto, D., M. De Marchi, M. Penasa, and M. Cassandro. 2013. Effect of milk composition
and coagulation traits on Grana Padano cheese yield under field conditions. J. Dairy
Res. 80:1-5.
111
Pretto, D., T. Kaart, M. Vallas, I. Jõudu, M. Henno, L. Ancilotto, M. Cassandro and E. Pärna.
2011. Relationships between milk coagulation property traits analyzed with different
methodologies. J. Dairy Sci. 94:4336-4346.
Rendel, J.M., and A. Robertson. 1950. Estimation of genetic gain in milk yield by selection in
a closed herd of dairy cattle. J. Genet. 50:1-8.
Romo, G.A., R.O. Kellems, K. Powell, and V. Wallentine. 1991. Some blood minerals and
hormones in cows fed variable mineral levels and ionic balance. J. Dairy Sci. 74:30683077.
Şahan, N., D. Say, and A. Kaçar. 2005. Changes in chemical and mineral contents of Awassi
ewes milk during lactation. Turk. J. Vet. Anim. Sci. 29:589–93.
Shappell, N.W., J.H. Herbein, L. Deftos, and R.J. Aiello. 1987. Effects of dietary calcium and
age on parathyroid hormone, calcitonin and serum and milk minerals in periparturient
dairy cow. J Nutr. 117:201-207.
Soyeurt, H., V.M.R. Arnould, D. Bruwier, P. Dardenne, J.M. Romnee, and N. Gengler. 2008b.
Relationship between lactoferrin, minerals, and somatic cells in bovine milk. J. Dairy
Sci. 91(E-Suppl.1):1542–1543.
Soyeurt, H., D. Bruwier, N. Gengler, J.M. Romnee, and P. Dardenne. 2008a. Potential
estimation of minerals content in cow milk using mid-infrared spectrometry.
Proceedings of the 36th International Committee for Animal Recording (ICAR) Session
and Interbull Meeting, 16-20 June 2008, Niagara Falls. Retrieved on 5 May 2014, from
http://www.icar.org/niagara/Presentations/5%20Friday/WS%203/2%20%20Soyeurt%20Minerals.pdf
Soyeurt, H., D. Bruwier, J.M. Romnee, N. Gengler, C. Bertozzi, D. Veselko, and P. Dardenne.
2009. Potential estimation of major mineral contents in cow milk using mid-infrared
spectrometry. J. Dairy Sci. 92:2444–2454.
Tiezzi, F., D. Pretto, M. De Marchi, M. Penasa, and M. Cassandro. 2013. Heritability and
repeatability of milk coagulation properties predicted by mid-infrared spectroscopy
during routine data recording, and their relationships with milk yield and quality
traits. Animal 7:1592-1599.
Toffanin, V., M. De Marchi, N. Lopez-Villalobos, and M. Cassandro. 2015. Effectiveness of
mid-infrared spectroscopy for prediction of the contents of calcium and phosphorus, and
titratable acidity of milk and their relationship with milk quality and coagulation
properties. Int. Dairy J. 41:68-73
112
Van de Braak, A.E., and A.T.H. Van’t Klooster. 1987. Effect of calcium and magnesium
intakes and feeding level during the dry period on bone resorption in dairy cows at
parturition. Res. Vet. Sci. 43:7-12.
Van Hulzen, K.J.E., R.C. Sprong, R. van der Meer, and J.A.M. Van Arendonk. 2009.
Genetic and nongenetic variation in concentration of selenium, calcium, potassium,
zinc, magnesium, and phosphorus in milk of Dutch Holstein-Friesian cows. J. Dairy
Sci. 92:5754–5759.
113
114
GENERAL CONCLUSIONS AND PERSPECTIVES
The potentiality of MIRS as milk phenotyping tool has been documented in the
literature. The accuracy of prediction models largely differs across milk traits, and the
standardization of reference methods, the increase of biological variability of data through
collaborations among different countries, the large scale data recording, and the study of the
most suitable editing and spectra pre-treatments would lead to improvement of the robustness
of prediction models.
In the present work the effectiveness of MIRS to predict milk MCP, Ca and P contents,
and TA has been demonstrated. The prediction performance were satisfactory for RCT, k20
and a30, given the improvement of prediction models based on a overextending of the
traditional reference analysis time, while the accuracy of a60 prediction need to be enhanced.
Milk Ca and P contents were predicted with good accuracy, even though Ca prediction model
only permits to discriminate between low and high contents of Ca and need to be improved.
Moreover, TA of milk was predicted with satisfactory accuracy.
The MCP, mineral contents and acidity of milk were moderately and favourably
correlated to physical-chemical composition. Moreover, given the existence of heritable
genetic variation of milk Ca, P and TA and high genetic correlations of Ca, P, and TA with
milk protein and fat percentages, an indirect improvement of the former traits could be
achieved through direct selection of the latter features.
The possibility to predict samples which coagulate after the traditional testing time of 30
minutes, should be considered for genetic purposes. In fact, these samples are often discarded
from genetic analyses and considered as missing information, leading to possible biases in the
prediction of sires merit for coagulation traits.
The aforementioned genetic purposes could be followed given the possibility to recorder
large amount of milk phenotypes, with reduced costs and times thanks to MIRS technology.
New milk phenotypes should be routinely available at population level if their prediction
models are apply to MIRS instruments routinely used in milk laboratories for the milkrecording schemes to predict protein, casein, fat and lactose contents.
Concluding, the possibility to use mid infrared spectroscopy as phenotyping tool for milk
MCP, mineral content and acidity was demonstrated and a genetic improvement of these
nutritional and technological characteristics of milk could be facilitated by this technology.
115
116
LIST OF PUBLICATIONS
Toffanin, V., M. De Marchi, N. Lopez-Villalobos and M. Cassandro. 2015. Effectiveness of
mid-infrared spectroscopy for prediction of the contents of calcium and phosphorus, and
titratable acidity of milk and their relationship with milk quality and coagulation
properties. International Dairy Journal 41:68-73.
Toffanin, V., M. Penasa, S. McParland, D.P. Berry, M. Cassandro and M. De Marchi. Genetic
parameters for milk mineral content and acidity predicted by mid-infrared spectroscopy
in Holstein-Friesian cows. Accepted for publication to Animal.
De Marchi, M., V. Toffanin, M. Cassandro and M. Penasa. 2014. Invited review: Mid-infrared
spectroscopy as phenotyping tool for milk traits. Journal of Dairy Science 97:11711186.
De Marchi, M., V. Toffanin, M. Cassandro, and M. Penasa. 2013. Prediction of coagulating
and noncoagulating milk samples using mid-infrared spectroscopy. Journal of Dairy
Science 96:4707–4715.
Toffanin, V. and M. De Marchi. 2013. Use of the mid-infrared spectroscopy (MIRS) for the
assessment of technological quality of bovine milk. Poster presentation: 18th Workshop
on the Developments in the Italian PhD Research on Food Science Technology and
Biotechnology, Universities of Padova and Udine, Conegliano (Italia), 25th–27th
September 2013.
Cassandro, M., M. De Marchi, M. Penasa, M. Battagin, A. Sturaro, V. Toffanin, P. Gottardo,
A. Varotto, M. Isaia and M. Baruchello. 2013. The BIONET project: an Italian regional
network for conservation of poultry biodiversity. In: Proceedings of the 8th European
Symposium on Poultry Genetics, 25th–27th September, Isola di San Servolo, Venice,
Italy, p. 73.
Toffanin, V., M. De Marchi, M. Penasa, P. Gottardo and M. Cassandro. 2013. Prediction of
milk minerals and titratable acidity by mid-infrared spectroscopy. Poster presentation to
the XXI International Symposium “Animal Science Days”, 18th-20th September 2013,
Padova, Italy.
Gottardo, P., F. Tiezzi, M. Penasa, V. Toffanin, M. Cassandro and M. De Marchi. 2013. Milk
fatty acids predicted by mid-infrared spectroscopy in mixed dairy herds. Agriculturae
Conspectus Scientificus 78:263-266.
Toffanin, V. and M. De Marchi. 2013. Prediction of calcium, phosphorus and titratable
acidity, and relationships with coagulation traits and chemical composition of bovine
117
milk. In: Book of Abstracts of the XX National Congress of the Animal Science and
Production Association (ASPA), 11th-13th June 2013, Bologna, Italy. ITAL. J. ANIM.
SCI. 12(Suppl. 1):41. (Abstr. C-086)
De Marchi, M., V. Toffanin and M. Penasa. 2013. Prediction of coagulating and
noncoagulating milk samples using mid-infrared spectroscopy. In: Book of Abstracts of
the XX National Congress of the Animal Science and Production Association (ASPA),
11th-13th June 2013, Bologna, Italy. ITAL. J. ANIM. SCI. 12(Suppl. 1):41. (Abstr. C096).
Toffanin, V., M. De Marchi, M. Penasa, D. Pretto and M. Cassandro. 2012. Characterization
of milk coagulation ability in bulk milk samples. Acta Agriculturae Slovenica
Supplement 2, 93-98. Oral presentation – XX International Symposium Animal Science
Days, Kranjska Gora, Slovenia (19th-21st September 2012).
De Marchi, M., M. Penasa, F. Tiezzi, V. Toffanin, and M. Cassandro. 2012. Prediction of
milk coagulation properties by Fourier transform mid-infrared spectroscopy (FTMIR)
for genetic purposes, herd management and dairy profitability. In 38th International
Committee for Animal Recording (ICAR) Meeting, Cork, Ireland. Accessed Nov. 10,
2012. http://www.icar.org/Cork_2012/Manuscripts/Published/Cassandro.pdf.
118
I want to thank,
my family and dears for their emotional care, affection and moral help,
Prof. Martino Cassandro, Prof. Massimo De Marchi, Dr. Mauro Penasa, Prof. Nicolas
Lopez-Villalobos, Dr. Donagh Berry and Dr. Sinead McParland for their scientific and
technical support,
Prof. Alen Dzidic and Dr. Elli Pärna for their evaluations and suggestions,
all my colleagues who made this period more cheerful and playful,
and Rosalba Moro for her kindness.
119
Scaricare