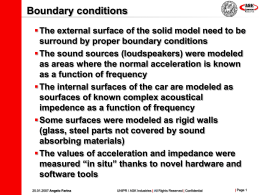
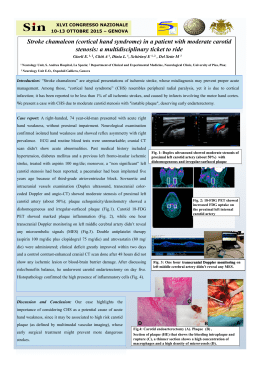
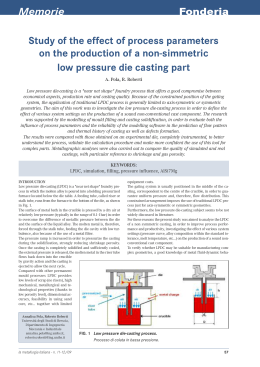
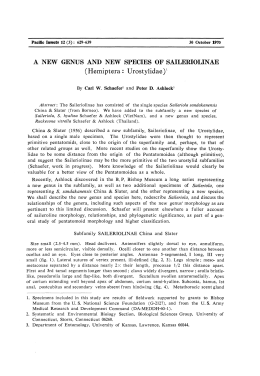
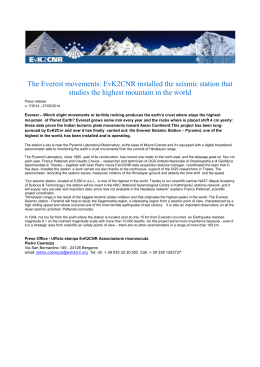
Numerical model of the sound field inside cars for the
creation of virtual audible reconstructions
A. Farina (1)
E. Ugolotti (2)
(1) Industrial Eng. Dept., University of Parma, via delle Scienze, 43100 Parma (ITALY),
Email: [email protected] – HTTP://pcfarina.eng.unipr.it
(2) ASK Automotive Industries s.p.a., via F.lli Cervi 79, 42100 Reggio Emilia (ITALY)
Email: [email protected]
Abstract
The research undertaken aims to the development of a new numerical predictive technique, capable
of producing such a detailed simulation, so that it can be used for the creation of “virtual” sound
samples, theoretically indistinguishable from binaural recordings inside a real car. This way, a
proposed (not existing yet) sound system could be compared with the existing ones by direct
listening tests.
This paper describes the implementation of the numerical model, based on Boundary Elements for
low frequencies and Pyramid Tracing for higher frequencies. The results of the two models are
merged together, producing a binaural impulse response which can be convolved with the music
signal. The performances of the system were evaluated by listening tests, in comparison with
experimental measurements taken in a 1:5 scale model of a car compartment.
1 Introduction
The experimental binaural technique is commonly
used nowadays for the subjective evaluation both of
the noise and of the sound system inside vehicles,
making it possible to collect conveniently the
subjective response of many listeners. Furthermore,
this technique avoids not-acoustical biases in the test
results.
The auralization technique [1] is a more advanced
implementation, based on the separate measurement
of the binaural impulse responses and the subsequent
convolution with suitable test signal (usually selected
music samples); this way it is possible to check the
sound system with any kind of different signals
without the need to make measurement inside the car
again.
Often it is required to estimate the behavior of a new
model of car before than the first prototypes are built.
As for many other aspects, also for the simulation of
the sound fields it is possible to make use of
numerical models as soon as a geometrical
description of the car is available. Finite Element
models have been used for a while with the goal of
predicting the noise produced by the engine and other
mechanical parts inside the compartment [2], but they
are not suitable for producing wide-band impulse
responses, as required for the auralization process.
Hybrid models were recently proposed for this task,
coupling finite elements with image sources models
[3].
In this work, a classic Boundary Elements
formulation is adopted at low frequencies, while at
higher frequencies, where the boundary elements
approach becomes computationally too heavy and the
phase relationships are less important, a new
geometrical acoustics algorithm is employed (pyramid
tracing) [4]. Although both these techniques have
proven to yield reasonably accurate results in their
optimal frequency domains [5,6], the suitability of the
results for the auralization approach has to be
evaluated by means of subjective listening tests, in
comparison with effective recordings inside the
modeled cars. In particular, the most delicate task is
the proper merging of the results of the two
simulations, which have to be converted in a single,
wide-band binaural impulse response.
A test case on a highly simplified geometry was
studied first: an 1:5 scale model of a car compartment
was employed for the binaural measurements, excited
by four small tweeters emulating a standard sound
system; an 1:5 human head and torso, equipped with
auricular microphones, was placed at the driver’s
position. The binaural impulse responses were
measured through the MLS technique for each
loudspeaker [7]. The same simplified geometry was
then employed for the numerical simulations: two
impulse responses were obtained (low and high
frequencies), and they were joined together at the
crossing frequency, making use of a standard digital
waveform editor.
Thereafter, the impulse responses (both experimental
and numerical) were used as numerical FIR filters,
applied by convolution to the same original signals.
The convolved signals were then comparatively
evaluated thanks to a panel of selected subjects.
In the paper, details about the two numerical models
are given, with mayor emphasis about the techniques
for merging the results and transforming them in
wide-band pressure impulse responses. Then the
results of the experiment are reported and discussed,
and a foreword of the future work is given.
2 Experimental measurements
MLS measurements were conducted in a scale model
of a FIAT Cinquecento car, built with flat plexiglass
panels and acoustically dampened by means of soft
tissue tiles applied on a part of the internal surfaces.
The geometry was very simplified in comparison with
the true car, and also the distribution of the materials
is quite simple, as only two boundary conditions have
to be taken into account.
Two small loudspeakers, originally designed for
notebook computers, were placed at the sides, and fed
with continuous MLS signals coming from a MLSSA
board. The response of the compartment was
measured through two miniaturized (1/4”)
microphones placed at the ears of a scaled human
mannequin, made of wood. The sampling rate was
120 kHz, which correspond to a theoretical maximum
frequency of 12 kHz. In practice, anyway, due to the
limited frequency range of both the loudspeakers and
microphones, and to the presence of the anti-aliasing
filters on the MLSSA board, the scaled frequency
response reaches only 8 kHz. These are enough,
anyway, for reasonable auralization tests.
Fig. 1 is a photograph of the scale model, taken
during its construction, when it was almost finished.
Fig. 2 shows the binaural impulse response measured
at the driver’s seat, and fig. 3 the corresponding
frequency response spectra.
Fig. 2 – Experimental binaural impulse responses –
Left speaker (above) and right speaker (below)
Fig. 3 – Experimental binaural frequency responses –
Left speaker (above) and right speaker (below)
3 Numerical simulations
3.1 Low Frequency – Boundary Elements
Fig. 1 – 1:5 plexiglass scale model
A commercial Boundary Element software (BEASY)
was employed for the low-frequency simulation, up to
500 Hz. The higher frequencies were studied by
means of the Pyramid Tracing program Ramsete.
Both these models make use of the same geometrical
description of the car compartment, made of 76
planar rectangles, as shown in fig. 4.
The Boundary Element simulation was conducted at 2
Hz increments, from 100 to 400 Hz. The complex
acoustic impedance of the two boundary materials
(plexiglass and soft tissue) were measured in a
standing wave tube following the ASTM 1050-E
standard. The loudspeakers were modeled as rigid
pistons. The complex acoustic pressure was obtained
at two selected points, located at the position of the
driver’s head. The human body of the driver was not
modeled at all for the low frequency simulation. The
pressure impulse responses were obtained by inverse
Fourier transformation of the complex pressure
spectra, after proper frequency-domain interpolation,
for yielding the required time resolution
corresponding to a sampling frequency of 24 kHz.
summed energetically, with no regard of their relative
phase. It is obvious that these simplifications are
reasonable only for wide-band, random noise, in
absence of resonance or interference effects. Only at
high frequencies these hypotheses are suitable for
musical signals reproduced by loudspeakers.
3.3 Conversion to wide-band pressure
impulse responses
Fig. 4 – 3D surface model for numerical computations
3.2 High Frequency – Pyramid Tracing
As the frequency increases, the boundary elements
should become smaller and smaller, in such a way
that their longest side is always less than ¼ of the
wavelength. This complicates the geometrical
modeling, and it takes a lot of time to make the
computations with very detailed surface grids.
Thus, above 400 Hz, a very different numerical
approach was employed: in the hypothesis that the
surfaces are large compared to the wavelength, the
geometrical acoustics assumptions are accepted.
Three kinds of numerical models exist under these
assumptions: Image Sources, Ray Tracing and Beam
Tracing.
Fig. 5 – generation of pyramidal beams
Pyramid Tracing is a particular case of the Beam
Tracing computing scheme, in which the acoustic
energy travels within “waveguides” having form of
triangular beams. The whole energy radiated inside
each pyramid always follow the path of the central
axis of the pyramid, without interaction with the
adjacent pyramids. Fig. 5 illustrates the scheme for
the generation of pyramids from an ideal point source,
as implemented in the employed Ramsete program
[4,6].
As only the energy of the sound wave is taken into
account, the boundary surfaces are characterized
simply by their acoustic absorption coefficients in
octave bands. Furthermore, the contributions which
arrive at a receiver point within the same time slot are
Ramsete (as many other Ray Tracing or Beam
Tracing programs) produces energy impulse
responses of unlimited length, sampled at intervals
typically of 1 ms or less; a separate response is
computed for each octave band (31.5 to 16000 Hz).
To obtain reasonably good binaural simulations, two
receivers must be located at the sides of a sound
diffracting sphere, approximating two ears. In this
way, the response in one receiving point is a couple of
arrays, each of them with 10 columns (the frequency
bands) and some hundreds or thousands of rows (the
time intervals).
It is necessary to convert each of these two arrays in a
single pressure response, with a bandwidth of 20 Hz
to 20 kHz, sampled at 44.1 or (better) 48 kHz.
Usually these impulse responses are stored in
standard WAV format, or in proprietary Impulse
Response formats as the TIM format of the MLSSA
system. Powerful software tools already exist,
enabling any kind of mathematical manipulation of
these pressure response files, as the Cool Edit
program here employed.
The conversion process begins with the generation of
a sample of white noise with proper length and
sampling rate, covering the impulse response
duration. Ten copies of this white noise signal are
made, and each of them is “modulated” with an
amplitude envelope obtained by the square root of the
energy impulse response in the corresponding
frequency band. After this, each modulated white
signal is passed through a 6-pole IIR digital octave
filter, centered on the corresponding frequency. The
ten filtered signals are then summed together,
obtaining a wide-band pressure response. Eventually,
the result is normalized and converted to 16-bit
integer.
Although this process can be criticized in many ways,
it is very fast and produces impulse responses that
exhibit the same energy/time curves, the same
reverberation times, and almost exactly the same
objective acoustical parameters as the original energy
responses. Obviously this is not enough to be
accepted as realistic for audible simulations: a
subjective evaluation need to be made for this.
4 Numerical results
After the computation were made with both numerical
models, the wide-band impulse responses obtained
were merged together through the editing capabilities
of the shareware program Cool Edit. In more detail,
the low-frequency impulse responses obtained from
the boundary element program were low-passed with
th
a 10 order Butterworth filter having a cut-off
frequency of 400 Hz. Similarly, the Pyramid Tracing
results were high-pass filtered. Then the impulse
responses were mixed together, after temporal
alignment of the first non-zero samples corresponding
to the arrival of the direct wave.
In this way, two binaural impulse responses were
obtained (one for each sound source), as shown in fig.
6. Fig. 7 shows the computed spectra, obtained by
FFT transformation of the impulse responses.
A preliminary, informal test was made, asking simply
to 5 subjects if they were able to recognize as
different two sound samples listened by headphones:
one of them was obtained from the auralization of the
experimental measurements, the other from the
numerical simulations.
All 5 subjective recognized immediately the sound
samples as different, so it was clear that the
simulation results were not so good to “fool” anyone.
Nevertheless, it was important to establish what are
the reasons for the differences, and thus a more
detailed comparative test was employed, as already
described in [1] for the comparison of the auralization
of different cars.
In practice, each subject seats in front of a personal
computer, where a specially-made software presents
him a series of sound samples. The user can listen at
each sound sample at will, filling up a software
questionnaire made of 9 counterpoised-attributes
scales.
The results of this second phase are not available yet
at time of writing, but they will be presented at the
DAFX-98 conference.
References
Fig. 6 – Simulated binaural impulse responses
Left speaker (above) and right speaker (below)
Fig. 3 – Simulated binaural frequency responses –
Left speaker (above) and right speaker (below)
5 Subjective listening tests
Although a direct comparison with the experimental
results (figs. 2 and 3) is possible, the effectiveness of
the numerical simulations has to be ascertained by
subjective listening tests.
[1] A. Farina, E. Ugolotti, “Subjective comparison of
different car audio systems by the auralization
rd
technique”, Pre-prints of the 103
AES
Convention, New York, 26-29 September 1997.
[2] A. Farina , R. Pompoli - "Noise reduction in a
tractor cab…: FEM prediction and experimental
nd
verification" – Proc. of 2 Int. ATA Conference
"Vehicle Comfort", Bologna 14-16 Ottobre 1992.
[3] E. Granier, M. Kleiner et al., ‘Experimental
auralization of car audio installations’ J.A.E.S.,
vol. 44, n. 10, 1996 October, pp.835-849.
[4] A. Farina - "RAMSETE - a new Pyramid Tracer
for medium and large scale acoustic problems" Euro-Noise 95 Conference, Lyon 21-23 march
1995.
[5] R.D.Ciskowski, C.A. Brebbia – “Boundary
element methods in acoustics” – CM Publ.,
Elsevier Applied Science, Southampton 1991.
[6] A. Farina - "Verification of the accuracy of the
Pyramid …" - ICA95, Trondheim (Norway) 26-30
June 1995.
[7] A. Farina, E. Ugolotti, “Automatic Measurement
System For Car Audio Application”, Pre-prints of
rd
the 104 AES Convention, Amsterdam, 15 - 20
May, 1998.
Scaricare