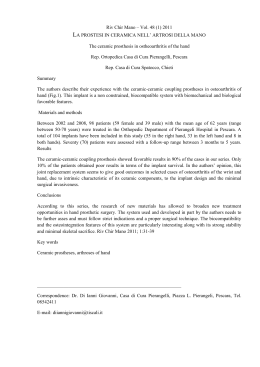
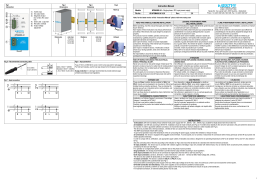
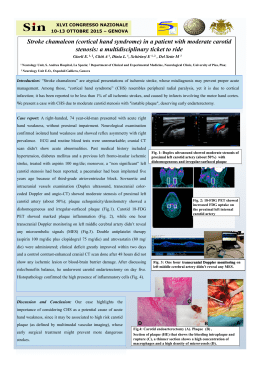
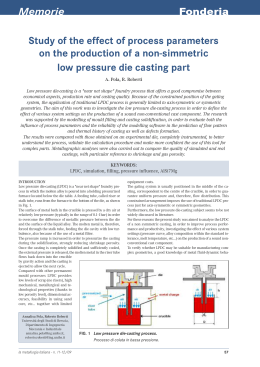
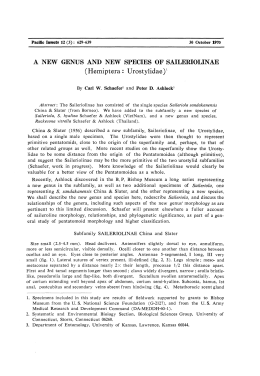
Work Package 6 Ecological and physiological analysis of plant and epiphytic vegetation answers to environmental modifications Analisi ecologica e fisiologica delle risposte di piante e vegetazione epifitica alle modificazioni ambientali Studi Trent. Sci. Nat., Acta Biol., 81 (2004), Suppl. 1: 227-244 © Museo Tridentino di Scienze Naturali, Trento 2005 ISSN 0392-0542 Winter depression and spring recovering of photosynthetic function of five coniferous species in the treeline zone of the Southern Alps (Trentino-South Tyrol) Leonardo MONTAGNANI1, Giorgio MARESI1, Cinzia DORIGATTI2, Andrea BERTAGNOLLI1, Emanuele ECCEL1, Roberto ZORER2 & Massimo BERTAMINI2* IASMA Research Center, Natural Resources Department, Via E. Mach 1, I-38010 San Michele all’Adige (TN), Italy IASMA Research Center, Agricoltural Resources Department, Via E. Mach 1, I-38010 San Michele all’Adige (TN), Italy * Corresponding author e-mail: [email protected] 1 1 SUMMARY - Winter depression and spring recovering of photosynthetic function of five coniferous species in the treeline zone of the Southern Alps (Trentino-South Tyrol) - Over a period of two years microclimate and physiological features of five coniferous species (Spruce, Cembran pine, Larch, Mountain dwarf pine, Scots pine) growing at the treeline on Mt. Weisshorn / Corno Bianco were monitored. Temperature profiles and plants light microclimate were studied and chlorophyll fluorescence, chlorophyll and carotenoids concentrations and needle water content were measured. An evident positive relationship between air temperature and quantum use efficiency of photosystem II and a depression of photosynthetic pigments concentration during winter and spring were found. Excessive light reduced quantum yield of PSII efficiency and, coupled with insufficient temperature, led to a permanent depression of photosynthetic capacity at higher elevations or in more exposed sites. In some cases these damages induced winter desiccations of needle and/or shoots. Sheltering effect of canopies positively influenced photosynthetic performances and health of shoots, allowing higher growth and survival rates. In order to simulate the effects of temperature on spring recovery of photochemical efficiency of PSII two models, based on thermal sums, have been calibrated and tested for Norway spruce; nevertheless, simpler running mean models provided better results. RIASSUNTO - Depressione invernale e recupero primaverile delle funzioni fotosintetiche in cinque specie di conifere nella zona di limite del bosco nelle Alpi meridionali (Trentino-Alto Adige) - Nel corso di due anni sono stati monitorati sia il microclima sia alcuni caratteri fisiologici di cinque specie di conifere (abete rosso, pino cembro, larice, pino mugo, pino silvestre) che crescono al limite del bosco sul Monte Weisshorn / Corno Bianco. Sono stati studiati i profili di temperatura e il microclima luminoso delle piante e sono stati misurati la fluorescenza clorofilliana, la concentrazione di clorofilla e carotenoidi, e il contenuto d’acqua negli aghi. È stata trovata una chiara relazione positiva tra la temperatura dell’aria e l’efficienza quantica del fotosistema II, ed evidenziato un calo nella concentrazione dei pigmenti fotosintetici in inverno e primavera. La forte radiazione luminosa, in particolare se combinata con una bassa temperatura, ha ridotto l’efficienza quantica del fotosistema II, comportando anche una depressione permanente alle quote più elevate o nei siti più esposti. Questi danni, nei casi più gravi, hanno provocato dei disseccamenti invernali di aghi e/o di interi getti. L’effetto di protezione (auto-ombreggiamento) delle chiome influenza le prestazioni fotosintetiche e la salute dei getti fogliari, permettendo una più elevata crescita e sopravvivenza delle piante. Per simulare gli effetti della temperatura sulla ripresa fotosintetica sono stati calibrati e testati due diversi modelli, basati su sommatorie termiche e specifici per l’abete rosso; tuttavia, modelli di media mobile hanno fornito risultati predittivi migliori. Key words: treeline, chlorophyll content, chlorophyll fluorescence, PSII quantum yield, winter desiccation, spring recovery Parole chiave: limite del bosco, contenuto di clorofilla, fluorescenza clorofilliana, resa quantica PSII, disseccamenti invernali, ripresa primaverile 228 Montagnani et al. 1. INTRODUCTION Alpine vegetation shows a clear ecotone in its upper limit. However, the interface between different biomes, such as forest and alpine grassland, has different aspects due to the combination of physiological and environmental conditions of the site where plants live. On the Apennines and on subtropical and southern hemisphere mountains, the transition between the two biomes is surprisingly sharp. In contrast, the Larch forest shows a gradual reduction in tree density and height. On the eastern Alps there is a fast decrease in tree height and forest biomass moving from 2000 m a.s.l, where a mixed coniferous forest exists, through to a shrub-like mountain pine forest, where stunted trees survive, to open alpine grassland growing at elevations higher than 2300 m. This line of passage between biomes is called treeline, and the knowledge of its features is necessary to understand the evolution of the alpine flora in time and space. Climate change can influence alpine species growth and composition, in particular changing the treeline altitude. While there is a common scientific consensus about the limited direct influence of higher CO2 atmospheric concentration on mountain vegetation (Cooper 1986; Smith & Donahue 1991; Terashima et al. 1995), the increase of temperature and the variations in precipitation regimes and snow cover can have a direct impact on constraints of alpine plant growth (Hättenschwiler & Körner 1995; Vaganov et al. 1999). Although the treeline has been the subject of a privileged field for ecological research and scientific theories for more than one century (Kerner 1869), up to now there is no complete agreement about the determinants of this abrupt change between biomes. Temperature is certainly a condition influencing this vegetation change, however the small thermal gradient, moving from the forest to alpine pastures, can hardly be considered the single determinant for this change. Probably implicitly assuming a Liebig approach (Liebig 1840) to limiting factors, many researchers tried to find a single limiting factor on tree vegetation. Many factors and processes constraining tree growth, survival and reproduction have been considered by different authors: worthy mention are decrease in seeds production (Fischer et al. 1959) and their viability, winter desiccation (Tranquillini 1979), carbon balance, loss of capacity to use assimilated products (Körner 1998), xylem embolism (Feild & Brodribb 2001). Winter depression and spring recovering Conifers are able to acquire deep frost hardiness when exposed to short days and decreasing temperatures (see Levitt 1980 for review). This enables them to survive extreme climatic conditions during winter, although the metabolic activities may be strongly reduced (Havranek & Tranquillini 1995). As a result of night frost, photosynthetic capacity gradually decreases during autumn (e.g., Troeng & Linder 1982; Strand 1995). In the boreal zone, photosynthesis is also curtailed during winter by low soil temperatures, and there is no net carbon gain during periods when frozen soil prevents water uptake (Troeng & Linder 1982). This survey followed the ecophysiological approach used by Tranquillini (1957) nearly half a century ago in his memorable study on alpine plants. We added the assessment of photochemical efficiency of photosystem II (PSII) by the measurement of chlorophyll fluorescence, a tool widely used in the last 20 years to assess ecophysiological constraints on plant growth (Öquist et al. 1987; Schreiber & Bilger 1987; Greer et al. 1991; Ottander & Öquist 1991; Strand & Lundmark 1995; Valentini et al. 1995; Koehn et al. 2003). We extended the period of study to two years, including a winter without snow until February and the warmest summer of the last century. Modelling of spring photosynthetic recovery for conifers has been investigated mainly for boreal conditions (Hänninen & Backman 1994; Hänninen 1996; Linkosalo 2000; Hänninen & Hari 2002; Tanja et al. 2003). Indeed, the only common factor between climate at an elevation of 2000 m in the Alps and boreal climate is low temperature. Radiative and temperature range regimes are remarkably different: on boreal climate there is a large thermal amplitude and generally lower radiation and precipitation. Models have to take into consideration several aspects: dormancy break mechanism; temperature effects on photosynthetic efficiency in general; efficiency recovery after low temperature episodes. The study moved from the permanent site of Lavazè, where a meteorological and a monitoring station exists since 1992, to the higher slopes of the mountain where environmental conditions were harsher. We studied the temperature and radiation effects on photochemical efficiency of PSII for the coniferous species over two years, from February 2002 to February 2004. Analyses of water content, chlorophyll, carotenoids and protein concentration in the dry matter were performed on two of these species along one year. Effects of radiation on plant gas exchange potential were defined by studying the yearly amount of available radiation on different positions within the crowns chosen for the surveys. Studi Trent. Sci. Nat., Acta Biol., 81 (2004), Suppl. 1: 227-244 In addition, the presence of different typologies of damage to crowns was checked and recognised during the investigation period, and environmental conditions associated to such phenomena were defined. The target of this work was to define limiting factors constraining growth and survival of five different conifers species at the treeline, in the Dolomitic area. 2. METHODS 2.1. Experimental site and plant materials The study was carried out at Mt. Weisshorn / Corno Bianco, South Tyrol (46°21'N, 11°26'E), Italy. The highest altitude range was considered, from 2000 m to the top of the mountain, 2317 m a.s.l. At this elevation a mixed-conifer forest exists, growing on a thin soil generated over a dolomite bedrock. At lower elevations the forest, up to 15 m tall, is composed of Cembran pine (Pinus cembra L.), Norway spruce (Picea abies (L.) Karsten) and Scots pine (Pinus sylvestris L.) on the southern slopes. Some larch (Larix decidua L.) and mountain pine (Pinus mugo Turra) grow at the edge of the meadows. At around 2100 m there is an abrupt change in the vegetation height and species composition, that can be assumed to be the treeline according to the indication of Körner (2003). In the altitude range from 2100 m to 2300 m the vegetation is dominated by the prostrate-ascending mountain pine, with scattered emergent spruce and larch, many of which bear a desiccated crown top. The presence of stone pine is progressively lower with height, however an abundant, dwarf population is present near the top of the mountain (2317 m a.s.l.) on the northern slope, where seeds are spread by a community of ravens. Two areas were selected for this study: the first one was chosen on the western slope of the Mt. Weisshorn, around 2050 m a.s.l. Here five individuals for each investigated species (Larix decidua, Pinus cembra, Picea abies, Pinus silvestris, Pinus mugo) were selected, marked and geo-referred by a GPS system. The selected plants grew isolated or in small groups at the border of alpine meadows. The spruce sampling individuals were collected along a gradient of forest density. The second plot was placed on a Pinus cembra population of saplings growing near the top of the mountains, centred at 2300 m a.s.l., on north-facing slope (Fig. 1). 229 2.2. Climate characterisation Main meteorological features for the site were derived by the Lavazè Pass meteorological station located 3 km away, at 1780 m a.s.l. The station has been operating since 1992. The area of Lavazè Pass can be set in a climatic frame of the middle latitudes, but, because of its elevated geographical location, climatic classifications usually adopted for cold climates better fit to its features. According to Köppen (Hufty 1979) the area falls in a “Dfc” climatic zone, that is “Microthermal Climate”, which is humid all year round. The area displays some continentality features, particularly if compared to most of territory in Trentino, which is basically oceanic. The experimental area represents well, from a thermal point of view, the typical climate of the mountain belt at the elevation of the station itself; yearly average temperature is 3.9 °C. The position of Lavazè Pass is favourably exposed to sun; in general, the horizon is open at the pass, but the position, just at the bottom of mountain peaks, makes the places prone to enhanced cloudiness, with respect to valley bottom locations, due to a stronger convective activity, especially in summer months. This feature is evident in the precipitation regime, which is unimodal, displaying its maximum in July. The area is not particularly rainy, considering the elevation: total average amount (period 1992-2003) is 946 mm. The relatively moderate rain height is, anyway, a general feature of the central-eastern alpine region, namely for E-W-oriented valleys. The area receives a reduced water contribution, both compared to the pre-alpine area (south), and to the western Trentino valleys. 2.3. Microclimate characterisation 2.3.1.Temperature microclimate Two air temperature profiles were set up in the selected plots at 2050 and 2300 m, with thin 0.08 mm Copper-Constantane thermocouples placed at 6 levels (0.05 m, 0.15 m, 0.40 m, 1.09 m, 2.93 m, 8.07 m above ground). Data were collected on a CR10 datalogger (Campbell Scientific, Lymington, UK). Longterm temperature measurements at the two selected elevations and two different heights (0.1 m and 2.0 m above ground) were performed with four Tinytagultra data-logger, equipped with a shielded temperature probe. 230 Montagnani et al. Winter depression and spring recovering Fig. 1 - Aerial picture (ortophoto) of the investigated area: yellow stars represent positions of sampled trees, green lines represent height level (Digital Orthophoto P.A.T. - S.I.A.T.). Fig. 1 - Ortofoto dell’area oggetto di indagine: le stelle gialle rappresentano la posizione delle piante campionate, le linee verdi le curve altimetriche (O.F.D. della P.A.T. - S.I.A.T.). 2.3.2.Sun light microclimate The sun light microclimate above the sampled shoots was computed taking hemispherical pictures at the sample location to evaluate the shading effect of the topography (slope, exposition) and of the canopy structure (north/south exposition, height of the crown) on the light availability. Hemispherical pictures (lens: Fisheye Converter FC-E8 Nikon Corp., Tokyo, Japan; camera: Coolpix 995, Nikon Corp., Tokyo, Japan) were taken at the sampling sites where shoots were periodically collected. Images were analysed with the software Gap Light Analyser version 2·0 (Frazer et al. 1999), in order to compute the canopy gap fraction at 10-degree zenith and azimuth reso- lution and the monthly percentage of transmitted sun light. Finally, monthly cumulated global radiation at shoot level was estimated as the product of monthly percentage of transmitted light and corresponding global radiation data obtained from the near Lavazè Pass meteorological station (see also § 2.2. Climate characterisation). 2.4. Collection of shoots and needles In the first study area from February 2002 to February 2004, fully exposed, second-order shoots from the lowest branches were collected early on the morning once in three-four weeks. The samples were Studi Trent. Sci. Nat., Acta Biol., 81 (2004), Suppl. 1: 227-244 collected from five individuals of each selected species: Larix decidua, Pinus cembra, Picea abies, Pinus silvestris, Pinus mugo. To study the influence of light, exposed (south-facing) and moderately shaded (north-facing) shoots from every different tree were collected. In the second plot, located in a Pinus cembra population growing at 2300 m a.s.l., from January 2003 to February 2004, needle samples were collected with the same frequency from the basal and the top branches of these small, stunted plants (one meter high maximum). After cutting, samples were immediately placed in plastic vials and covered with aluminium foils. The vials were kept in a cooling box during sampling and then stored in a refrigerator at +4 °C. The shoots were dark acclimated at 20 °C for at least 1 h before the fluorescence measurements. 2.5. Laboratory measurements and needles analysis 2.5.1.Chlorophyll fluorescence Chlorophyll fluorescence was measured at room temperature using a modulation fluorometer (PAM2000 Portable Chlorophyll Fluorometer Walz, Effeltrich, Germany). The shoots were fastened to a strip of transparent tape and pressed against a bundle of optic fibres; the angle and distance from the leaf surface to the end of the optic fibre cable were kept constant during the experiments. Then the leaf sample was exposed to a 0.1 s saturated flash of approximately 6000 μmol -2 -1 m s to obtain the maximal fluorescence yield, Fm. The ratio of variable to maximal fluorescence, Fv/Fm, was calculated automatically according to measured F0 and Fm. All measurements of F0 were performed with the measuring beam set to a frequency of 600 Hz, whereas all measurements of Fm were performed with saturating flash automatically switching to 20 kHz. The Fv/Fm ratio [Fv/Fm= (Fm - F0)/Fm] was used as an index of maximum photochemical efficiency of PS II function. Each chlorophyll fluorescence measu re was repeated three times on each sample. 2.5.2.Relative water content Relative water content was determined with a double weighing. Fresh needles samples (1-2 g each) were weighted on a analytical balance CP323S (Sartorius, Goettingen, Germany), with a resolution of 1 mg. Each sample was stored in an oven at 80 °C for 48 hours, in an aluminium foil. After the desiccation, each sample was weighted again for the measure of the dry weight. 231 2.5.3.Pigment determination Photosynthetic pigments were determined in crude acetone extracts. Needles were grinded to a fine powder in a mortar using liquid nitrogen and extracted with 80% (v/v) acetone. Chlorophylls and carotenoids were measured spectrophotometrically and their concentrations calculated on the basis of extinction coefficients given by Lichtenthaler & Buschmann (2001a, 2001b). 2.6. Modelling approach to spring photosynthesis recovery We used the data concerning the Norway spruce trees growing at 2000 m in order to set up a general photosynthesis recovery model following different approaches: thermal sum (Bergh et al. 1998); “feedback” model (Pelkonen & Hari 1980); running mean. In this analysis the mean of the two measurements for every sample (north and south side) has been used, better representing an average condition. The rough ratio has been normalized aiming at a sounder defi nition of the value of full activity; the relative value of the ratio (Fv/Fm) has been obtained by dividing any value by the maximum value measured in the two years of survey: 1) (Fv/Fm)rel. = (Fv/Fm) / (Fv/Fm)max All models have been calibrated using parameters of photosynthetic efficiency measured on the field. Most of the model parameters have been optimised by a Generalized Reduced Gradient method (GRG2), letting them vary within a likely range and having as a target the minimum possible value for Root Mean Square Error (RMSE), evaluated by differences between measured and modelled values. Such processing allowed to improve model scores, getting better results than those obtainable with a direct application of original formulations. Variable parameters include temperature damage thresholds, final thermal sum values, coefficients in general, and, for the running mean model, the length of the averaging period. Before discussing results, a short overview is given on the implemented models; details can be found in the originals. Bergh et al. (1998) ������������������������������������� developed a daily thermal sum model, with no “base” temperature value for addends; moderately low temperatures slow down the accumulation process, while severe frosts lower the thermal sum attained until that moment; soil frost conditions are explicitly taken into consideration. Pelkonen & Hari (1980) worked on an hourly basis; the rate of development is a function of tempera- 232 Montagnani et al. ture and of a critical value, corresponding to the fulfilment of the thermal requirements for the attainment of full photosynthetic capacity. For the sake of homogeneity, a winter value equal to the surveyed minimum for (Fv/Fm)rel (0.14) has been set also in this formulation. This model, compared to the one by Bergh et al. (1998), displays a quicker reaction to temperature fall, since the rate of development is less strongly dependent on the integral value attained. A comparison of these two models is given in Hänninen & Hari (2002). Finally, simple running average models have been traditionally applied for smoothing effects of abrupt temperature change; such algorithms proved to yield results comparable to more sophisticated models (Tanja et al. 2003); moreover, they have the advantage of avoiding any introduction of functional relationships whose functioning could be not fully explicable. 3. RESULTS AND DISCUSSION 3.1. Temperature In general, on the mountains larger temperature variations are experienced by human beings than in Winter depression and spring recovering plain environments. However, if we perform air temperature measurements, we often find, on the contrary, a much more narrow fluctuation of daily temperature around the mean than we would perhaps expect (Fig. 2). In mountains climates, solar radiation is usually able to induce a strong thermal gradient in a shallow air layer. Its height and the extent of the temperature gradient itself (usually negative during the day, positive during calm nights) is influenced by wind speed. The effects of roughness of ground surface on wind speed are generally expressed by a logarithmic equation (1), that becomes nearly linear within a forest canopy: 2) uh = (u*/k)ln((h-d)/h0) where uh is the wind velocity at the height h above ground, u* is the friction velocity, k is Von Karman constant, d is the zero plane displacement, whose value is generally around 2/3 of canopy height; h0 is the height at which the wind speed would reach zero if it followed a logarithmic decrease near the ground, and not a linear decrease, as in the case of vegetated surface (Kaimal & Finnigan 1994). Higher roughness is given by buildings, rocks and, with particular effectiveness, by vegetation. Fig. 2 - Temperature profiles measure during August, 2002, at the two plots (2050 and 2300 m a.s.l.) with thin (0.08 mm) copper-constantane thermocouples, at six different heights (0.05 m, 0.10 m, 0.40 m, 1.09 m, 2.93 m, 8.07 m) above ground. Continuous lines, circles: measures performed at 2050 m; dashed lines, squares: measures performed at 2300; black symbols: night values (h 5:00 a.m.); open symbols: day values (h 3:00 p.m.). Fig. 2 - Profili di temperatura misurati durante l’agosto 2002 nei due siti (2050 e 2300 m s.l.m.) con termocoppie fini di rame costantana (0,08 mm) a sei differenti altezze (0,05 m, 0,10 m, 0,40 m, 1,09 m, 2,93 m, 8,07 m) sul livello del suolo. Linea continua e circoli: misure raccolte a 2050 m; linee tratteggiata e quadrati: misure raccolte a 2300 m; simboli neri: valori notturni (h 5:00); simboli aperti : valori diurni (h 15:00). Studi Trent. Sci. Nat., Acta Biol., 81 (2004), Suppl. 1: 227-244 The profile of potential temperature follows closely that of wind speed (Sozzi et al. 2002). Whenever temperature is a limiting factor, due to seasonal and/or climatic conditions, plants can often exploit just the short occurrence of temperatures higher than a physiological threshold for their functioning. At the tree limit, the presence of vegetation not only reduces wind speed, so reducing mechanical damages to the vegetation and evaporative demand – evapotranspiration in stunted conifers is anyway of little relevance – but, limiting wind speed, it al- 233 so enhances the occurrence of daily thermal ranges larger than in the case of clear soil. Hence, the time period when the plants and their photosynthesising organs can reach useful temperature values is increased. On the other hand, trees act as obstacles to the solar radiation in its way to the ground, so the soil is often cooler when it is covered by a thick canopy, the shading effect exceeding in general that of reduction of long wave radiation loss at night. Soil temperature can hamper forest growth, particularly in Fig. 3 - Hemispherical pictures, taken skyward at the shoots sampling sites, used to estimate the monthly cumulated global radiation available at the shoot level, based on the incoming global radiation, measured at the Lavazé meteorological station, and gap fraction distribution. A, B, C Pinus cembra located at 2300 m a.s.l.; D, E, F Pinus cembra at 2050 m; G, H, I Picea abies at 2050 m. Fig. 3 - Immagini emisferiche, ottenute mediante riprese verso il cielo al di sopra dei punti di raccolta dei getti, utilizzate per stimare la radiazione globale cumulata mensilmente a livello dei getti campionati, basata sui dati della stazione meteorologica di Lavazé e sulla distribuzione della gap fraction. A, B, C Pinus cembra posto a 2300 m s.l.m.; D, E, F Pinus cembra posto a 2050 m, G, H, I Picea abies posto a 2050 m. 234 Montagnani et al. circumpolar regions, where vegetation grows over a permafrost layer. But, if soil temperature is not limi ting, the presence of close woods is favourable for tree growth. 3.2. Sun light microclimate Hemispherical canopy photography is an indirect optical technique that has been widely used in studies of canopy structure and forest light transmission (Anderson 1964; Kull & Niinemetz 1998). Photographs taken skyward with a 180° hemispherical (fisheye) lens produce circular images that record size, shape, and location of gaps in the forest overstory. These data can be subsequently combined to produce estimates of growing-season light transmission, as well as other measures more directly related to canopy structure, such as openness, leaf area and sunflecks proportion of incoming radiation. The light regime experienced by shoots is influenced both by exposition and location in the crown. The global radiation availability for the shoots collected in the upper part of the crown of small Pinus cembra trees at 2300 meters, on a north-facing slope, varied between 70 MJ m-2 (December 2003) and 620 MJ m-2 (July 2003) with a mean monthly value of 304 MJ m-2, about 72% of total available global radiation. Lower shoots, in reason of orientation and reduced habitus of the trees, showed a mean global radiation availability of 200 MJ m-2, about 47% of the incoming radiation and a range between 30 to 400 m-2 (Figs 3A, 3B, 3C). At a lower elevation, 2050 m, west-facing slope, the habitus of most of the trees is regular and the crown reaches 3 m height. The crown shading effect was in this case larger and the transmittance values at the north and south face of the borderline trees were different. The south facing shoots were exposed to high values of global radiation (range of 80-480 MJ m-2; mean value of 260 MJ m-2), 68% of the incoming radiation (Figs 3D, 3E, 3F). Over the north-face shoots, the canopy shading was very effective and the global radiation showed the lowest values during the year (24-180 MJ m-2). Sampled spruces experienced different light regimes, according to position of the individual with respect to other trees. Shoots were shaded by their own crowns only or by the adjacent trees too. Mean global radiation varied between 140 and 280 MJ m-2, respectively for north and south exposed shoots (Figs 3G, 3H, 3I). Isolated trees, that received the highest amount of global radiation, showed delayed recovery of greenness and severe damages during late winter. Winter depression and spring recovering 3.3. Needles water content Needles water content in Cembran pine and spruce was determined for the period January 2003 - February 2004. The summer of 2003 was extremely dry and warm, so it could be suggested that even trees growing near the timberline were subject to summer drought. Water content, measured by a double weighing of fresh and dry matter, showed conversely two main peaks in winter 2003 and winter 2004, while the increase of dry matter percentage (and decrease of water content) was little during the “heat wave” of 2003. The more dehydration prone species was the spruce, while the Cembran pine showed more drought-tolerant leaves. Needles of spruce, and particularly sun-exposed and wind exposed ones, had severe dehydration that, in some case, led to needle death. The most acute and easily recognisable effects of dehydration took place in late winter 2003 (February, March) poor in snow, while less effects had the previous winter without snow until February. Lethal levels of dehydration were reached in late winter 2003, when water content in spruce leaves was as low as 35% (Fig. 4). During winter-drought period, sun-exposed needles had a severe photobleaching, indicating a synergy between action of drought and high light effects. Recovery from photochemical inhibition, after restoration of favourable water relation, is very slow (Bjorkman & Powles 1984). 3.4. Chlorophyll fluorescence Plants have different ways to prevent photoda mages. The easier is to shed the leaves, as larches do; a second way is to lose pigments, like Chlorophylls and carotenoids, or to change the way of chloroplasts stacking. Physiological adjustments involves xantho phyll cycle, with de-epoxidation of Violaxanthin in Zeaxanthin and Antheraxanthin (Demmig-Adams & Adams 1996), the fluorescence and the dissipation of incoming short wave radiation as long wave, thermal radiation. Photoinhibition of photosystem II occurs when photosynthesis and protein turnover become inhibited by low temperatures and when nonphotochemical, heat dissipation mechanism are insufficient to deal with excess excitation (Anderson & Osmond 1987; Öquist & Huner 2003). The five studied coniferous species displayed similar trends in photochemical efficiency during the two years of study. The four evergreen species (spruce, Cembran pine, Scots pine, mountain dwarf pine) had a minimum in Studi Trent. Sci. Nat., Acta Biol., 81 (2004), Suppl. 1: 227-244 65 60 55 50 45 11-04-2003 65 60 55 50 Da t e 40 1-01-2003 75 C 80 70 65 60 55 50 45 11-04-2003 Cembran pine needle dry matter (%) Cembran pine needle dry matter (%) 70 20-07-2003 4528-10-2003 C 80 40 1-01-2003 75 B 80 5-02-2004 11-04-2003 20-07-2003 Higher crown Lower crown Da t e Nort h Sout h 75 Nort h Sout h 70 65 60 55 50 45 40 1-01-2003 28-10-2003 B 80 Cembran pine needle dry matter (%) A 80 70 40 1-01-2003 Nort h Sout h Cembran pine needle dry matter (%) 75 Spruce needle dry matter (%) Spruce needle dry matter (%) A 80 235 75 70 65 60 55 50 20-07-2003 4528-10-2003 5-02-2004 Dat e 40 1-01-2003 11-04-2003 20-07-2003 28-10-2 5-02-2004 Dat e 11-04-2003 Higher crown Lower crown 75 70 65 60 55 50 20-07-2003 4528-10-2003 5-02-2004 Dat e 40 1-01-2003 11-04-2003 20-07-2003 28-10-2003 Dat e 5-02-2004 Fig. 4 - Trends of dry weight content percentage [(dry weight/fresh weight)*100] in spruce needles and in needles of Cembran pines growing at different altitudes. Thick line: north facing or lower crown (2300 m plot) needles. Thin line: south facing or higher crown needles. A: Spruce, growing at 2050 m a.s.l.; B: Cembran pine, growing at 2050 m a.s.l.; C: Cembran pine growing at 2300 m a.s.l. Fig. 4 - Andamento del peso secco percentuale [(peso secco/peso fresco)*100] negli aghi di abete rosso e pino cembro vegetanti a diverse altitudini. Linea spessa: aghi appartenenti alla parte della chioma esposta a nord oppure alla parte inferiore (sito a 2300 m). Linea fine: chioma a sud o parte superiore della chioma. A: abete rosso, vegetante a 2050 m s.l.m.; B: pino cembro, vegetante a 2050 m s.l.m.; C: pino cembro, vegetante a 2300 m s.l.m. winter, when the Fv/� Fmvalue dropped to a very low value. It is known that under natural conditions, recovery is slow and it may take several months before full photosynthetic capacity is achieved (Linder & Troeng 1980; Linder & Lohammar 1981; Lundmark et al. 1988). The timing of recovery showed some differences among species, with the spruce slightly faster. During year 2002 the higher values of Fv/� Fmwere approached at the beginning of the summer, but were not kept for long time. During the hot summer of 2003 all the plants showed higher values of photochemical efficiency at the beginning of July and at the end of the August, but showed a clear depression of PSII efficiency in mid July. During the year 2003 the photochemical efficiency was measured also on Cembran pines located near the top of Mt. Weisshorn. They showed a slower recovery and an anticipated loss of photochemical efficiency (Fig. 5). During the spring and the beginning of summer 2003 an evident positive relation was found between photochemical efficiency and needle development during the previous year (Fig. 6). While at the lower elevation the length of needles in saplings is similar, or slightly higher in the higher parts of the crown, in the group of Cembran pines growing above the actual timberline needles are shorter in the higher part of the crown (Fig 7). Needle length is regular only on the shaded shoots growing near the ground. Also water content in needles was lower in the higher parts of the crown, suggesting a possible interaction between water content, photochemical efficiency and growth (Neuner et al. 1999). 236 Montagnani et al. Winter depression and spring recovering Fig. 5 - Trend of averaged value of photochemical efficiency of photosystem II, given by the parameter of fluorescence Fv/Fm along two years. Period: February 2002-February 2004. Dotted lines: Cembran pines 2050m a.s.l.; dotted line Cembran pines 2300m a.s.l.; thick black line: Larch; medium black line: Mountain dwarf pine; thick grey line: Spruce; light black line: Scots pine. Fig. 5 - Andamento del valore medio, nel corso di due anni, dell’efficienza fotochimica del fotosistema II, rappresentata dal parametro di fluorescenza Fv/� Fm. Periodo: febbraio 2002 - febbraio 2004. Linee tratteggiata grossa: pino cembro 2050 m s.l.m.; linea punteggiata: pino cembro 2300 m s.l.m; linea nera continua spessa: larice; linea nera continua media: pino mugo; linea grigia, spessa: abete rosso; linea nera continua e sottile: pino silvestre. Fig. 6 - Relation between needle length and quantum use efficiency values, given by Fv/Fm. Needles collected in spring 2003 at 2300 m a.s.l. at different heights in the crown. Fig. 6 - Relazione tra lunghezza degli aghi e i valori dell’ef ficienza quantica (Fv/Fm). Aghi raccolti nella pri-mavera 2003 a 2300 m di altitudine e a differenti altezze nella chioma. Fig. 7 - Bar graph of the of needle length of secondary shoots as a function of relative height in the crown. Grey bars: needles at 2300 m.; black bars: needles at 2050 m. Fig. 7 - Diagramma a barre della lungh ezza degli aghi di getti secondari in funzione dell’altezza relativa nella chioma. Barre grigie: aghi raccolti a 2300 m.; barre nere: aghi raccolti a 2050 m. 3.5. Chlorophyll and carotenoids al forest, Bowen ratio (sensible heat loss/evaporative heat loss) is very high. During spring there is a period of greening that, in continental climates (central and eastern Europe and Siberia), lasts few weeks, followed by the maximal rate of CO2 uptake in late June or July (Röser et al. 2002; Tanja et al. 2003). On the Alps, where climate is less continental, the During winter, boreal evergreen forests lose part of their leaf chlorophyll content. Although solar radiation is low, plants need to find a way to dissipate energy: since being the intracellular water frozen, they cannot use solar energy to transform carbon dioxide into organic compounds. During winter, over bore- Studi Trent. Sci. Nat., Acta Biol., 81 (2004), Suppl. 1: 227-244 Total chlorophylls, a+b (mg g -1) A 5 4 3 2 1 0 1-1-03 3.6. Relation between temperature and photosystem function Actual photosynthesis depends on temperature. There are different processes involved in the adju stment of photosynthetic apparatus. Winter inhibition of photosynthesis is well established for Scots pine B 5 Total chlorophylls, a+b (mg g-1) timing of this recovery is much slower. Chlorophylls showed a minimum in late spring, at the moment of the emission of new shoots, and a complete recovery only in late summer. Chlorophyll and carotenoids concentrations were higher in the more shaded leaves and were significantly lower at the higher elevation in Cembran pine (Fig. 8). 237 4 North South 11-4-03 20-7-03 28-10-03 Date 3 2 1 0 1-1-03 5-2-04 4 4 Carotenoids (mg g -1) D 5 Carotenoids (mg g -1) C 5 3 2 1 0 1-1-03 North South 11-4-03 20-7-03 28-10-03 Time 5-2-04 Higher crown Lower crown 11-4-03 20-7-03 28-10-03 Date 5-2-04 3 2 1 Higher crown Lower crown 0 1-1-03 11-4-03 20-7-03 28-10-03 Time 5-2-04 Fig. 8 - Trends of total Chlorophylls (Chl. a + Chl. b) and total carotenoids content (mg g d. m.-1) on dry matter, during the period January 2003 - February 2004 on Cembran pines growing at different elevations. Light black lines, open symbols: sun exposed shoots, south facing or growing in the higher crown; black thick lines: shaded shoots, north facing or growing in the lower part of the crown. A: Total Chlorophyll content in needles of pines growing at 2050 m; B: Total Chlorophyll content in needles of pines growing at 2300 m; C: Carotenoids content in needles of pines growing at 2050 m; D: Carotenoids content in needles of pines growing at 2300 m. Fig. 8 - Andamento della clorofilla totale (clorofilla a + clorofilla b) dei carotenoidi totali (mg g s. s. -1) riferiti alla sostanza secca, durante il periodo gennaio 2003 - febbraio 2004 nei pini cembri che vegetano a diverse altezze. Linee nere sottili, simboli aperti: getti esposti al sole, a sud o nella parte superiore della chioma; linee nere spesse: getti ombreggiati, esposti a nord o nella parte inferiore della chioma. A: contenuto totale di clorofilla in aghi di pino che crescono a 2050 m; B: contenuto totale di clorofilla in aghi di pino che crescono a 2300 m; C: contenuto totale di carotenoidi in aghi di pino che crescono a 2050 m; D: contenuto totale di carotenoidi in aghi di pino che crescono a 2300 m. 238 Montagnani et al. and Norway spruce (Linder & Troeng 1980; Leverenz & Öquist 1987; Lundmark et al. 1988; Ottander & Öquist 1991; Kull & Koppel 1992; Strand & Lundmark 1995) and seems to include both temperature stress per se and low-temperature enhanced photoinhibition. Acclimation on temperature needs different time according to the process involved. So, the O2 evolution following the Rubisco activation has a direct (seconds) response to the temperature variation, while the efficiency of Photosystem II and the energy trapping by Chlorophyll a and b and by carotenoids needs a longer period of adjustment. Content of proteins involved in this process of adjustment, like D1 protein and Psbs protein (Li et al. 2000) depends by protein activation and turnover, both temperature-related processes. Net loss of the reaction centre D1 protein occurs when the rate of D1 protein synthesis is lower than the rate of photodamages (Öquist & Huner 2003). Plant photosynthesis is therefore influenced not only by actual temperature, but also by the temperatures experienced in a recent past, days in the case of fluo rescence, months in the case of Chlorophylls. The relation between temperature and measured fluorescence found a best fit when, at the place of the temperature measured at the moment of the sampling, a moving average was used. In this case, the best fit between temperature and Fv/Fm was found with an average of eight days. An enhancement of the fitting was obtained using a modified moving average equation, previously used to determine time delay in instrument outputs (Sozzi et al. 2002). The equation used was 3) Tmod=Tact[1-exp(-∆t/t)]+(Tmod-1)exp(-∆t/t) where Tmod is the temperature modelled with a delay function, Tact is the actual temperature measured at the moment of the sampling, the term ∆t/t is the parameter influencing time delay. In this study was assumed a value of 0.1 for this term. As an input, were used temperature values measured at 2 m above ground at the two plots sited at 2050 m and 2300 m. Spruces reached a higher level of photoinhibition in winter, displaying large differences between sun exposed and shaded parts of the crown. The clear secondary minimum of photochemical efficiency displayed at 10 °C, in summer, confirms the sensitivity of this physiological traits to dehydration (Fig. 9a, 9b). Relation between temperature and photochemical efficiency showed a small hysteresis loop: at a given temperature Fv/Fm values were lower in spring than in late summer, indicating the relative importance of thermal sums in order to attain the efficiency of the photosynthetic apparatus. Winter depression and spring recovering Fluorescence measured on Cembran pines growing at 2050 m showed a clear relation of saturation with temperature. Photochemical efficiency of photo system II increased with the moving average of air temperature, saturating at extremely low values, 5-6 °C above zero. It was evident the extreme adaptation of this plant to alpine climate and low temperatures (Figs 9c, 9d). Cembran pines growing at 2300 m a.s.l. suffered, in the higher part of the crown, for higher radiation and low temperatures. In the higher part of the crown maximal values of photochemical efficiency were never attained, suggesting a permanent degree of inactivation of some physiological process (Fig. 9e, 9f). It is known that, under natural conditions, recovery is slow, and it may take several months before photosynthetic capacity is restored (Linder & Troeng 1980; Linder & Lohammar 1981; Lundmark et al. 1988). 3.7. Modelling approach to spring photosynthesis recovery After calibration of models according to the three approaches, some useful results can be drawn. The parameter used to quantify spring photosynthetic recovery in spruce is Fv/Fm. From our analyses, a maximum value of 0.79 has been estimated for (Fv/Fm)max and a minimum of 0.14, very close to that used in Bergh model (0.15). Referring to normalized ratios, full value (1.0) represents the typical summer situation. The application of the optimisation algorithm modified the original parameters of both models developed by Bergh et al. (1998) and by Pelkonen & Hari (1980) (with some unavoidable arbitrariness, due to the shortness of the available experimental set – two years), yet improving their performances. In table 1 a comparison of the original values is given with those obtained by calibration for our data set. Parameters not reported were not modified. It can be seen that in the first model all temperature thresholds have been considerably lowered, but no value for T3 lower than T2 was found. T2 is the threshold value below which a decrease in the state of development takes place, causing a reversal of the photosynthetic activity recovery; the latter can be reversed again with positive temperatures. T3 is the threshold below which the damage due to frost is maximum, affecting recovery permanently. It must be inferred that either no major frost event has occurred during the observation period, or that a mechanism strongly limiting photosynthetic activity, to be ascribed to very low temperatures, would not take place, at least in the terms under which the model itself has been proposed. In the second model Studi Trent. Sci. Nat., Acta Biol., 81 (2004), Suppl. 1: 227-244 B 0.8 0.7 0.6 0.6 0.5 0.4 0.3 0.2 0.1 0.0 -10.0 0.4 -5.0 0.0 5.0 10.0 15.0 Temperature (moving average) °C 0.2 0.1 0.0 01-2003 04-2003 20.0 D 0.6 Fv Fm-1 0.7 0.6 0.5 0.4 0.1 0.0 -10.0 0.5 0.4 0.1 0.0 01-2003 04-2003 F 0.7 0.6 0.6 0.5 0.5 0.3 0.2 0.1 0.0 -10.0 Northward needles Southward needles -5.0 0.0 5.0 1.0 1.5 Temperature (moving average)°C 20.0 07-2003 10-2003 Date 02-2004 Higher crown Lower crown 0.8 0.7 0.4 South North 0.2 20.0 0.8 02-2004 0.3 Northward needles Southward needles -5.0 0.0 5.0 1.0 1.5 Temperature (moving average)°C 07-2003 10-2003 Date 0.8 0.7 0.2 Fv Fm-1 Northward needles Southward needles 0.8 0.3 E 0.5 0.3 Fv Fm-1 Fv Fm-1 C South North 0.8 0.7 Fv Fm-1 Fv Fm-1 A 239 0.4 0.3 0.2 0.1 0.0 01-2003 04-2003 07-2003 10-2003 Date 02-2004 Fig. 9 - Relation between a moving average (Eq. 2) of air temperature and photochemical efficiency of photosystem II given by the chlorophyll fluorescence parameter Fv/Fm (A, C, E) and trends of the same parameter (B, D, F). Fv/Fm averaged values of 5 samples from different trees. A, B: Spruce, growing at 2050 m a.s.l.; C, D: Cembran pine, growing at 2050 m a.s.l.; E, F: Cembran pine, growing at 2300 m a.s.l. Thick line: north facing or lower crown (2300 m plot) needles; dotted line, open symbols: south facing or higher crown (2300 m plot) needles; arrows show the direction of the hysteresis loop between temperature and Fv/Fm during the year (January 2003 - February 2004). Fig. 9 - Relazione tra una media mobile (Eq. 2) della temperatura dell’aria e l’efficienza fotochimica del fotosistema II dato dal parametro Fv/Fm (A, C, E) e gli andamenti dello stesso parametro (figure B, D, F). Valori medi di Fv/Fm di cinque campioni da alberi diversi. A, B: abete rosso, a 2050 m s.l.m.; C, D: pino cembro, a 2050 m s.l.m.; E, F: pino cembro, a 2300 m s.l.m. Linea spessa: aghi della parte esposta a nord o della parte inferiore della chioma (sito a 2300 m s.l.m.). Linea sottile, simboli aperti: aghi campionati sul lato esposto a sud oppure nella parte superiore della chioma (sito posto a 2300 m). Le frecce mostrano la direzione del ciclo di isteresi tra la temperatura e Fv/Fm durante l’anno (gennaio 2003 - febbraio 2004). 240 Montagnani et al. Winter depression and spring recovering Tab. 1 - Results of models calibration. Tab. 1 - Risultati della calibrazione dei modelli. Parameter Physical meaning Bergh et al. (1998) T1 [°C] T1’ [°C] T2 [°C] T2’ [°C] T3 [°C] Scrit [°C day] Recovery slowing-down threshold – minimum daily temperature Recovery slowing down threshold – mean daily temperature Recovery reversal threshold – minimum daily temperature Recovery reversal threshold – mean daily temperature Temperature damage threshold Value for attainment of critical state of development Pelkonen & Hari (1980) a c Scrit Curve shape parameter for development rate Curve shape parameter for development rate Value for attainment of critical state of development Original value Value after calibration 0 0 -3 -3 -4 500 -6.8 -6.8 -7.7 -7.7 -7.7 399 2 600(*) 6500(*) 1.7 2895 268 (*) original formulation expressed on an hourly basis (Pelkonen & Hari 1980), both c and Scrit have undergone to a heavy change with respect to the proposed values, but that was largely expected, since original formulation envisaged hourly values, while our application made use of daily data. c is a parameter of the exponential term of the model, while Scrit is the critical “state of development” (i. e. the integral over time of the rate of development), when the maximum photosynthetic capacity is attained. The application of both models was not satisfactory to represent the photochemical efficiency process for Norway spruce at Mt. Weisshorn. Particularly, results are poor in reproducing spring recovery (more evidently in 2002 than in 2003), while they seem to better reproduce the drop in photosynthetic efficiency in autumn. Only for summer 2003 models fit experimental values. This is the expected result of a calibration carried out with only two years measures, with substantially different summer regimes: 2003 will be remembered as an exceptionally warm season (Rebetez et al. 2004) and temperature must have promoted photosynthetic activity, allowing highest efficiency for a long period. On the contrary, summer 2002 was wet and cool, with low solar radiation. Anyway, experimental data do not display a summer plateau of full photosynthetic efficiency like both models do. A similar conclusion was reached by Tanja et al. (2003): temperature sums do not allow to represent rapid temperature rise and fall and are affected by too long “memory”. Better results can be attained by an application of running mean models to mean daily temperature. Attempts have been done by varying the length of the averaging period, from 2 to 25 days. Best outcomes have been obtained with temperatures averaged over a period spanning from 8 to 15 days, according to the side of the tree – north or south – where samples were taken. For a 8-days moving window, R2 = 0.76 (p< 0.001). Results from the three model approaches are given in Fig. 10. When estimating the carbon balance of cold-temperate and boreal forests, the seasonal variation in photosynthetic capacity and performance must be considered, to avoid overestimating annual carbon assimilation (Linder & Lohammar 1981; McMurtrie et al. 1994; Bergh et al. 1998a). Bergh ������ et al. (1998), using the process-based simulation model BIOMASS (McMurtrie et al. 1990), estimated that the combined effect of autumn decline of photosynthetic capacity, winter-damaged photosynthetic apparatus and frozen soils may reduce annual gross primary production in a boreal Norway spruce stand by 35-45%. 3.8. Shoot and needles damages During the year 2003 a regular presence of suf fering needles was observed on all the Cembran pines in the plot at 2300 m a.s.l. The needles on the upper branches were discolouring during the winter season, yellowing in spring and, in some cases, turned to brown in summer. This kind of damage was not observed on lower branches of the same trees: here the needles appeared always green (Fig. 11). Most of the affected needles seemed not able to recover during the growing season, maintaining the yellow appearance, while the new vegetation showed the same symptoms after the following winter. Studi Trent. Sci. Nat., Acta Biol., 81 (2004), Suppl. 1: 227-244 241 Fig. 10 - Models comparison. Solid grey: application of the Bergh et al. (1998) model; dashed grey: Pelkonen & Hari, 1980 model; solid black: 8 days running mean model; black dots: relative photosynthetic capacity from analyses of Fv/Fm. Fig. 10 - Confronto tra modelli. Linea grigia continua: modello di Bergh et al. (1998); grigio tratteggiato; modello di Pelkonen & Hari (1980); linea nera continua: modello a media mobile di 8 giorni; punti neri: andamento della capacità fotosintetica normalizzata proveniente dai dati osservati di Fv/Fm. Phacidium infestans P. Karsten was detected on the lower branches of some Pinus cembra at 2300 a.s.l. This snow-related parasite caused discoloration of needles that turned to pale grey in summer. The presence of the fungus was confirmed by the appearance of apothecia during August 2003. Incidence of this disease was irregular and located on some patches of trees. During the surveys the fungus was observed only on lower branches. The combination of pathologies and suffering status brought to a wide loss of branches and death of saplings (about 30%) during the year 2003. Similar losses were not found at 2050 m a.s.l. In March 2003, a sudden damage on needles was observed on the sampled trees in the 2050 m plot (Fig. 12). Needles of 2002 season growing on exposed branches became partially or completely white, starting from the tip; then, in the following months, all turned reddish-brown and finally fell during summer. This kind of damage was observed all around the edge of the forest between 1800 and 2100 m a.s.l. Only exposed trees were affected, while no effects were observed on plants inside the wood. The more severe damages were present on the side exposed to wind. All evergreen species studied showed the same symptoms, but the spruce had more severe damages (Fig. 13). In some cases, exposed branches and the top of the crown were desiccated. In the following year, the new vegetation was not affected by the same attack. Fig. 11 - Small Pinus cembra L. tree at 2300 m a.s.l. Can be seen the apical shoot desiccated in a previous year and the yellowing top crown. �������������������������������� Photograph taken in spring 2004. Fig. 11 - Piccolo albero di Pinus cembra L. a 2300 m di quota. È possibile notare gli apici terminali disseccati negli anni precedenti e l’ingiallimento della parte alta della chioma. Foto primavera 2004. 242 Montagnani et al. Winter depression and spring recovering Fig. 12 - A branch of an isolated group of young spruces during subsequent winters (2003, 2004). During winter 2003 (A) the tree had severe de-hydration and chlorophyll bleaching on sun exposed shoots. In the following year (B), needles of year 2002 were fell down, but the new shoot was in good conditions. Fig. 12 - Un ramo di un gruppo isolato di giovani abeti rossi durante inverni successivi (2003, 2004). Durante l’inverno 2003 (A) l’albero ha avuto una pesante disidratazione e una degradazione della clorofilla sui rami esposti al sole. Nell’anno seguente (B) gli aghi del 2002 erano ormai caduti, mentre il nuovo getto era in buone condizioni. Fig. 13 - Winter desiccation on Spruce and mountain dwarf pine observed in the plot in April 2003. It is to notice the different level of damages in the two species. Fig. 13 - Danni da disseccamento invernale su abete rosso e pino mugo osservati nell’area nell’aprile 2003. Si osservi la differente intensità di danneggiamento fra le due specie. 4. CONCLUSIONS The physiological character distinguishing the plants growing above the timberline is the incomplete recovery of the efficiency of the photosynthetical machinery in the higher part of the crown. This feature is determined by a lower chlorophyll content and a lower efficiency of photosystem II, and is coupled with an incomplete growth of foliage and branchlets. This low-temperature-induced photoinhibition of evergreen plant during winter, is well indicated by low Fv/Fm ratio. Damages also occurred during winter in photo- synthetic or meristematical tissues, both above and under the treeline, at the more exposed parts of the canopy. This damage occurs at a side in the photosynthetic electron transport chain that can readily be repaired (Ottander & Öquist 1991). The recovering process is strongly temperature and light dependent (Greer et al. 1986). Since replacement of damaged tissues needs a high level of assimilating capacities (Waring 1991), we suggest that the long lasting effects of photoinhibition on the more exposed parts of the crown have a key role in treeline occurrence on the Alps. All limiting factors, such as low temperature, high radiation (Strasser et al. 1996) and water or nutrients shortage (Sakai & Larcher 1987), that can induce photoinhibition and photochemical damages or withstand D1 protein synthesis, can be ascribed as drivers for the treeline formation. Since trees growing in dense canopies are less triggered by limiting factors than isolated trees, we confirm by a physiological point of view the importance of the sylvicultural practice of keeping a forest defense close to tree limit on the mountains. ACKNOWLEDGEMENTS The assistance for field work of Alberto Conter and the GIS data elaboration of Ruggero Valentinotti is kindly acknowledged. This work was supported by a grant from Provincia Autonoma of Trento: project “EFOMI: Ecological Studi Trent. Sci. Nat., Acta Biol., 81 (2004), Suppl. 1: 227-244 Valuation in Alpine Forest Ecosystems by Integrated Monitoring”. REFERENCES Anderson M.C., 1964 - Studies of the woodland light climate. 1. The photographic computation of light conditions. J. Ecol., 52: 27-41. Anderson J.M. & Osmond C.B., 1987 - Shade/sun responses: compromises between acclimation and photoinhibition. In: Kyle D.J., Osmond C.B. & Arntzen C.J. (eds), Photoinhibition. Elsevier, Amsterdam: 1-37. Bergh J., McMurtrie R.R. & Linder S., 1998 - Climatic factors controlling the productivity of Norway spruce: a model-based analysis. Forest Ecol. Manag., 110: 127139. Bjorkman O. & Powles S.B., 1984 - Inhibition of photosynthetic reaction under water stress: interaction with light level. Planta, 161: 490-504. Cooper C.F., 1986 - Carbon dioxide enhancement of tree growth at high elevations. Science, 231: 859-860. Demmig-Adams B. & Adams W.W., 1996 - Xanthophyll cycle and light stress in nature: uniform response to excess direct sunlight among higher plant species. Planta, 198: 460-470. Feild T.S. & Brodribb T., 2001 - Stem water transport and freeze-thaw xylem embolism in conifers and angiosperms in a Tasmanian treeline heath. Oecologia, 127: 314-320. Fischer F., Schmid P. & Hughes B.R., 1959 - Anzahl und Verteilung der in der Schneedecke angesammelten Fichtensamen. Mitt. Schweiz. Anst. Forstl. ������������������� Versuchswes., 35: 459-479. Frazer G.W., Canham C.D. & Lertzman K.P., 1999 - Gap Light Analyzer (GLA), Version 2.0: Imaging software to extract canopy structure and gap light transmission indices from true-colour fisheye photographs, users manual and program documentation. Simon Fraser University, Burnaby, British Columbia, and the Institute of Ecosystem Studies, Millbrook, New York. Greer D.H., Berry J.A. & Bjorkman O., 1986 Photoinhibition of photosynthesis in intact bean leaves; role of light and temperature, and requirement for chloroplast-protein synthesis during recovery. Planta, 168: 253-260. Greer D.H., Ottander C. & Öquist G., 1991 - Photoinhibition and recovery of photosynthesis in intact barley leaves at 5 and 20 °C. Physiol. Plant., 81: 203-210. Hänninen H., 1996 - Effects of climatic warming on northern trees: testing the frost damage hypothesis with meteorological data from provenance transfer experiments. Scand. J. For. Res., 11:17-25. Hänninen H. & Backman R., 1994 - Rest break in Norway spruce seedlings: test of a dynamic temperature response hypothesis. Can. J. For. Res., 24:558-563. Hänninen H. & Hari P., 2002 - Recovery of photosynthesis 243 of boreal conifers during spring: a comparison of two models. Forest Ecol. Manag., 169: 53-64. Hättenschwiler S. & Körner C., 1995 - Responses to recent climate warming of Pinus sylvestris and Pinus cembra within their montane transition zone in the Swiss Alps. J. Veg. Sci., 6: 357-368. Havranek W.H. & Tranquillini W., 1995 - Physiological processes during winter dormancy and their ecological significance. In: Smith W.K. & Hinckley T.M. (eds), Ecophysiology of coniferous forest. Academic Press, London: 95-124. Hufty A., 1979 - La climatologia. Newton Compton, Roma: 235 pp. Kaimal J.C. & Finnigan J.J., 1994 - Atmospheric Boundary layer flows: Their structure and measurements. Oxford University Press, New York: 289 pp. Kerner A., 1869 - Die Abhängigkeit der Pflanzengestalt von Klima und Boden. Festschrift der 43. Jahres versammlung Deutscher Naturforscher und Ärtze. Wagner, Innsbruck: 29-45. Koehn A. C., Roberds J.H. & Doudrick R.L, 2003 Variation among slash pine families in chlorophyll fluorescence traits. Can. J. For. Res., 33: 1102-1109. Körner C., 2003 - Alpine plant life. ������������������������ Springer-Verlag, Berlin Heildelberg: 344 pp. Körner C.,1998 - A re-assessment of high elevation treeline positions and their explanation. Oecologia, 115: 445459. Kull O. & Koppel A., 1992 - Seasonal changes in photosynthetic parameters of Pices abies (L.) Karst. Estonian Acad. Sci. Ecol., 2:16-21. Kull O. & Niinemetz Ü., 1998 - Distribution of leaf photosynthetic properties in tree canopies: comparison of species with different shade tolerance. Funct. Ecol., 12: 472-479. Leverenz J.W. & Öquist G., 1987 - Quantum yields of photosynthesis at temperature between -2 °C and 35 °C in cold-tolerant C3 plants (Pinus sylvestris) during the course of one year. Plant Cell Environ., 10: 287-295. Levitt J., 1980 - Response of plant to environmental stresses, Vol I: Freezing and high temperature stresses. 2nd ed. Academic Press, New York: 606 pp. Li X-P., Björkman O., Shih C., Grossman A.R., Rosenquist M., Jansson S. & Niyogi K.K., 2000 - A pigment-binding protein essential for regulation of photosynthetic light harvesting. Nature, 403: 391-395. Lichtenthaler H.K. & Buschmann C., 2001a - Chlorophylls and Carotenoids: Measurement and Characterization by UV-VIS Spectroscopy. Current Protocols in Food Analytical Chemistry F4.3.1.-F4.3.8. John Wiley & Sons, Inc. Lichtenthaler H.K. & Buschmann C., 2001b - Extraction of Photosynthetic Tissue: Chlorophylls and Carotenoids. Current Protocols in Food Analytical Chemistry F4.2.1.-F4.2.6. John Wiley & Sons, Inc. Liebig J. von, 1840 - Die organische Chemie in ihrer Anwendung auf Agricultur und Physiologie. Friedrich ���������� Vieweg Verlag, Braunschweig: 342 pp. 244 Montagnani et al. Linder S. & Lohammar T., 1981 - Amount and quality of information on CO2-exchange required for estimation annual carbon balance of coniferous trees. Stud. For. Seuc., 160: 73 - 87. Linder S. & Troeng E., 1980 - Photosynthesis and transpiration of 20 year-old Scots pine. Ecol. Bull., 32: 165-181. Linkosalo T., 2000 - Mutual regularity of spring phenology of some boreal tree species: predicting with other species and phenological models. Can. J. For. Res., 30: 667-673. Lundmark T., Hällgren J.E. & Heden J., 1988 - Recoveryng from winter depression of photosynthesis in spruce and pine. Tree, 2: 110-114. Mcmurtrie R.E., Rook D.A. & Kelliher F.M., 1990 Modelling the yield of Pinus radiata on a site limited by water and nitrogen. For. Ecol. Manage., 30: 381-413. Mcmurtrie R.E., Gholz H.L., Linder S. & Gower S.T., 1994 - Climatic factors controlling the productivity of pine stands: a model-based analysis. Ecol. Bull., 43: 173188. Neuner G., Ambach D. & Aichner K., 1999 - Impact of snow cover on photoinhibition in evergreen Rhododendron ferrugineum leaves during subalpine winter. Tree Physiology, 19: 725-732. Öquist G. & Huner N.P.A., 2003 - Photosynthesis of overwintering evergreen plants. Ann. Rev. plant Biol., 54: 329-355. Öquist G., Greer D.H. & Ögren E., 1987 - Light stress at low temperature. In: Kyle D.J., Osmond C.B. & Arntzen C.J. (eds), Photoinhibition. Elsevier Science Publishers, Amsterdam: 67-109. Ottander C. & Öquist G., 1991 - Recovery of photosynthesis in winter-stressed Scots pine. Plant Cell Eenviron., 14: 345-349. Pelkonen P. & Hari P., 1980 - The dependence of the springtime recovery of CO2 uptake in Scots pine on temperature and internal factors. Flora, 169: 398404. Rebetez M., Mayer H., Dupont O., Schindler K., Gartner K., Kropp J. & Menzel A., 2004 - Heat and drought 2003: a climate analysis. Scientific Conference: Impacts of the Drought and Heat in 2003 on forests. �������������� Freiburg (D), 17-19 November 2004. Berichte Freiburger Forstliche Forschung. Book of abstracts, 1. Röser C., Montagnani L., Schulze E.D., Mollicone D., Kolle O., Meroni M., Papale D., Belelli L., Marchesini L., Federici S. & Valentini R., 2002 - Net CO2 exchange rates in three different successional stages of the “Dark Taiga” of Central Siberia. Tellus, 54B: 642-654. Sakai A & Larcher W., 1987 - Frost Survival of Plants: Responses and adaptation to freezing stress. ��������� SpringerVerlag, Berlin: 138-153 Schreiber U. & Bilger W., 1987 - Rapid assessment of stress effects on plant leaves by Chlorophyll Fluorescence measurements. In: Tenhunen J.D. (ed.), Plant response Winter depression and spring recovering to stress. Springer-Verlag, ����������������������������������������� Berlin Heidelberg. ����� NATO ASI Series, Vol. G15: 27-53. Smith W.K. & Donahue A., 1991 - Simulated influence of altitude on photosynthetic CO2 uptake potential in plants. Plant Cell Environ., 14: 133-136. Sozzi R., Georgiadis T. & Valentini M., 2002 - Introduzione alla turbolenza atmosferica. Pitagora Editrice, Bologna: 544 pp. Strand M., 1995 - Inhibition of photosynthesis in currentyear needles of unfertilized and fertilized Norway spruce [Picea abies (L.) Karst.] during autumn and early winter. Trees, 9: 332-340. Strand M. & Lundmark T., 1995 - Recovery of photosynthesis in 1-year-old needles of unfertilized and fertilized Norway spruce (Picea abies (L.) Karts.) during springs. Tree Physiol., 15: 151-158. Strasser R.J., Srivastava A. & Haldimann P., 1996 Licht. In: Brunold C., Rüegsegger A. & Brändle R. (eds), Stress ������������ bei Pflanzen. Verlag Paul Haupt, Bern: 89-102. Tanja S., Berninger F., Vesala T., Markkanen T., Hari P., Mäkelä A., Ilvesniemi H., Hänninen H., Nikinmaa E., Huttula T., Laurila T., Aurela M., Grelle A., Lindroth A., Arneth A., Shibistova O. & Lloyd J., 2003 - Air temperature triggers the recovery of evergreen boreal forest photosynthesis in spring. Global Change Biol., 9: 1410-1426. Terashima I., Masuzawa T., Ohba H. & Yokoi Y., 1995 Is photosynthesis suppressed at higher elevation due to low CO2 pressure? Ecology, 76/8: 2663-2668. Tranquillini W., 1957 - Standorstklima, Wasserhaushalt and CO2-gaswechsel Junger Zirber (Pinus cembra L.) an der alpinen Waldgrenze. Planta, 49: 612-661. Tranquillini W., 1979 - Physiological Ecology of the alpine timberline. Ecol. Studies, 31: 137 pp. Troeng E. & Linder S., 1982 - Gas exchange in a 20-yearold stand of Scots pine. I. Net photosynthesis of current and one-year-old shoots within and between season. Physiol. Plant., 54: 7-14 Vaganov E.A., Hughes M.K., Kirdiyanov A.V., Schweingruber F.H. & Silkin P.P., 1999 - Influence of snowfall and melt timing on tree growth in subartic Eurasia. Nature, 405: 904-905. Valentini R., Epron D., De Angelis P., Matteucci G. & Dreyer E., 1995 - In situ estimation of net CO2 assimilation, photosynthetic electron flow and photorespiration in Turkey oak (Quercus cerris L.) leaves: diurnal cycles under different levels of water supply. Plant Cell Environment., 18: 631-640. Waring R.H., 1991 - Responses of evergreen trees to multiple stresses. In: Mooney et al. (eds), Responses of plants to multiple stresses, Academic Press, S. Diego (Cal.): 371- 390. Wieser G., 1997 - Carbon dioxide gas exchange of cembran pine (Pinus cembra) at the alpine timberline during winter. Tree Physiol., 17: 473-477.
Scaricare