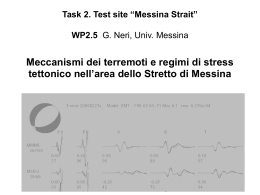
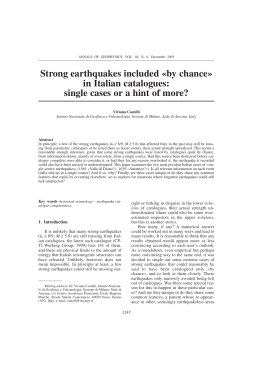
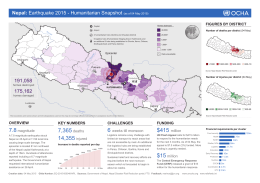
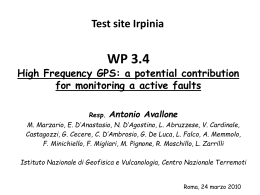
Bollettino di Geofisica Teorica ed Applicata
Vol. 48, n. 2, pp. 205-212; June 2007
Possible electromagnetic earthquake precursors in two years of
ELF-VLF monitoring in the atmosphere
A. NARDI1, M. CAPUTO2, 3 and C. CHIARABBA4
1
Dipartimento di Scienze della Terra, Univ. La Sapienza, Roma, Italy
Dipartimento di Fisica, Università La Sapienza, Roma, Italy
3
Department of Geology and Geophysics, Texas A&M University, College Station, Texas, U.S.A.
4
Istituto Nazionale di Geofisica e Vulcanologia, Roma, Italy
2
(Received: March 24, 2006; accepted: January 25, 2007)
ABSTRACT
In this study we show that ELF-VLF emissions occurred during the fracturing of rocks
in laboratory experiments and during rock extraction in a cave, and that such
emissions have also been recorded by 3 ELF-VLF stations installed in the central
Apennines before earthquakes . The electric field emission is composed of two types
of signals that are related to the evolution of micro-fractures within the rocks. In two
years of monitoring, from August 2003 to September 2005, we recorded three signals,
which all have frequency bands and characteristics similar to the signal recorded
during the fracturing of rocks in the laboratory and during the extraction of rocks. All
these signals appeared a few days before the occurrence of M ≥ 4.5 earthquakes in the
surrounding region (100-300 km). May EM emissions be are precursors of the
earthquakes ?
1. Introduction
The investigation of natural emissions and the modification of physical parameters during the
stressing of rocks is fundamental for earthquake forecasting. Among several parameters indicated
as potential seismic precursors, electromagnetic EM emissions are receiving wider attention.
The first information on EM emission related to earthquakes goes back to the 16th century, to
the city of Ferrara, for the series of earthquakes occurring from 1550 through 1577 (Caputo,
1987). A more complete and detailed list of EM phenomena related to earthquakes is found in
Galli (1910); in 52 cases the phenomenon occurred before the earthquake, in 37 cases they
occurred during the earthquakes and in 20 cases after.
Several studies have confirmed that accumulation and release of tectonic stress may generate
EM emissions (Eftaxias et al., 2003). Following the 1980 Sugadaira event (M = 7.0), EM signals
associated with large earthquakes started being documented, mostly in the ULF band (see Table
1).
An IASPEI commission examined the possibility that ground noise in the LF, VLF and ELF
bands could be useful in earthquake forecasting (Yoshino, 1997), they concluded that the data
collected until then did not allow them to reach any firm conclusion, but EM emission from rock
fracturing is still a promising field.
In past years, Bella et al. (1993) measured electric, magnetic, and seismo - acoustic signals in
relation to pre-seismic stress. A few days before the June 4, 1993 (M = 4.3) earthquake, an
© 2007 – OGS
205
Nardi et al.
Boll. Geof. Teor. Appl., 48, 205-212
Fig. 1 - Spectrum of the noise of VLF. The frequency scale is in Hz on the y axis. The intensity of the signal is given
by the intensity of the gray along the spectra. The time is in the x axis marked every 5 minutes. It shows the noise
essentially generated by the harmonics of the 50 Hz of the electric power network (hum), some signals of natural
atmospheric phenomena as lightnings and spherics and some VLF stations characterized by the typical intermittent
radio-signal.
attenuation of 20 dB in the recordings of the long waves of Radio Montacarlo were observed
(Bella et al., 1998).
Mognaschi (1997) studied the signals observed by a radio - amateur before the earthquake of
May 12, 1997 in central Italy; he investigated the dynamics of the phenomenon that interests a
wide frequency band. Mognaschi and Zezza (2000) recorded EM impulses during, and
sometimes before, the fracture of a gneiss sample under uniaxial compression, by using a radio
receiver of the medium frequency band (AM).
Table 1 - Examples of earthquakes appearing in the literature with a study of the EM emission prior to the earthquake.
They are all strong earthquakes.
206
year
1988
1989
1993
1995
1995
1998
1999
band
ULF
ULF
ULF
ULF-VHF
VLF, VHF
ULF
VLF
Associate event
Spitak, Armenia, 12.07.88, M=6.9
Loma Prieta, California, 17.10.89, M=7,1
Guam, Giappone, 08.08.93, M=8,0
Kobe, Giappone, 17.01.95, M=7,2
Kozani, Grecia, 13.05.95, M=6,6
S.J. Bautista, California, 12.08.98, M=5,1
Atene, Grecia, 07.08.99, M=5,9
1999
ULF-ELF
Chi-Chi, Taiwan, 21.09.99, M=7,6
1999
2000
ULF
ULF
Hector Mine, California, 16.10.99, M=7,1
Izu, Giappone, 27.06.2000, M=6.4
bibliography
Molchanov et al., 2003
Fraser-Smith et al., 1990
Smirnova et al., 2001
Nagao et. al., 2002
Eftaxias et. al., 2003
Karakelian et. al., 2000b
Eftaxias et. al., 2003
Ohta et. al., 2001
Akinaga et al., 2001
Karakelian et. al., 2000a
Ismaguilov et. al., 2002
EM earthquake precursors
Boll. Geof. Teor. Appl., 48, 205-212
Fig. 2 - Schematic representation of the radioacoustic emission in the uniaxial compression and fracture of rock
samples. At the top: the spectrum; below: the oscillogram. The y scale is the frequency in the band 20 Hz –20 kHz;
with dynamic amplification of 60 dB. The time is in the x axis as percent of the time from the beginning of the constant
rate compression to the fracture of the sample. We note two different types of impulsive sequences: the OIS is a orderly
succession of impulses, the DIS is a disordered sequence of impulses. C is an impulse regularly appearing at about
50% of the time to fracture. SP is the concentrated sequence preceding the fracture.
Despite the abundance of information on emission phenomena, rigorous scientific
experiments on the VLF emissions are still lacking. Recent laboratory experiments revealed VLF
emissions during the fracturing of rock samples with different lithologies (Nardi, 2001). VLF
emissions occurred during the entire loading of the rock sample and culminated at the final
sample rupture. Similar VLF signals were observed during the collapsing of the walls for the
extraction of rocks in a cave (Nardi, 2001; Nardi et al., 2003).
2. Laboratory experiments
We ran a series of experiments in the Laboratorio Terre of Istituto Sperimentale della Ferrovie
dello Stato (Nardi and Caputo, 2006) by using a 500-ton hydraulic press. A constant rate uniaxial
pressure is applied to 36 wide rock samples with different lithologies. The fracture was obtained
within 3 - 8 minutes, depending on the rock lithology.
The EM signals, recorded during the loading and at rock fracture, are formed by a sequence
of micro-impulses. The band of emission of these signals is about 3 kHz wide, the centre of the
band is from 6 to 11 kHz, with a tendency to drift towards the radio-frequency band spectrum but
always remaining in the band 0.5 -11 kHz, as shown in Figs. 1 and 2. These electric emissions
are, possibly, associated to in pre-seismic signals.
We observed EM in 36 of the 42 compression and fracture tests which cover all the 14
different lithologies examined (massive limestone, clay sandstone, metamorphic rocks and also
beton). We recorded two different subsequent types of signals evolving during the compression
and the fracturing of the samples: Orderly Impulsive Sequence (OIS) and Disorderly Impulsive
207
Nardi et al.
Boll. Geof. Teor. Appl., 48, 205-212
Fig. 3 - Spectrum of the EM signal associated to the (M = 5.0) earthquake occurring in the Emilian Apennine on
September 14, 2003. The OIS signal was recorded on September 10. The hours in UTC are on the x axis, the frequency
in kHz is in the y axis. The amplitude of the spectrum is expressed by means of the intensity of the gray color. The OIS
signal covers a band of about 3 kHz centered at about 5 kHz.
Sequence (DIS) (Fig. 2).
The OIS is a high frequency signal which may be mechanically associated with the crack
formation and, independently from the scale of the phenomenon, may be subdivided in: impulses,
sets of impulses with variable intervals in between. The impulses are rather similar and appear
with a band width of about 3 kHz, whose center may vary from 4 to 8 kHz and sometimes may
even drift during the phenomenon.
The DIS is more intense and characterized by a low frequency and it may be associated with
the opening of the fractures. During this phase, the impulses are different and variably distributed
in time, although they sometimes appear in clusters and are progressively more intense and
dense, forming a sequence that culminates with the fracture of the sample.
In the recorded DIS, each single EM impulse corresponds to a mechanical impulse recorded
acoustically. The phenomenology has been observed in all the tested lithologies with differences
that depend on the style of deformation and structural homogeneity of samples rather than their
mineralogy.
The OIS emission occurred during all the tests, at least during the last phase that culminates
with the final fracture of the sample. The absence of emissions during only a few tests is due to
Table 2 - Earthquakes occurring in the 2 years of recording from August 2003 and September 2005 in the Apennines
and the Thyrrenean Sea with magnitude ≥ 4.5 and corresponding SIO signals recorded by the field stations.
Epicenter of
seismic event
Appennino Emiliano
Costa calabra occid.
Mare a largo di Anzio
208
Date
Mag
14-09-03
03-03-04
22-08-05
5.0
4.6
4.5
Receiving
station
Cascia (PG)
Frascati (RM)
Cascia (PG)
(km)
200
270
150
Advance
hours days
106 = 4,4
62 = 2.6
89 = 3,7
EM earthquake precursors
Boll. Geof. Teor. Appl., 48, 205-212
Fig. 4 - Spectrum of the EM signal associated to the (M = 4.6) earthquake occurring on the Calabrian coast on March
3, 2004. The OIS signal was recorded on March 1. The hours in UTC are on the x axis, the frequency in kHz is on
the y axis. The amplitude of the spectrum is expressed by means of the intensity of the gray color. The OIS signal covers
a band of about 3 kHz centered at about 4 kHz.
problems with the recordings apparatus or to the irregular shape of the samples.
3. Monitoring in the atmosphere
Three EM continuously recording stations have been installed in central Apennines. EM
signal is recorded by a electric ELF-VLF antenna and digitized on a PC. Since the high sampling
frequency (44100 Hz), only spectrograms are stored on the PC hard disk.
In the EM stations installed in the Apennines, we recognised OIS type signals (see Table 2).
In all the three cases they are associated with magnitude ≥ 4.5 earthquakes, occurred 3~4 days
later.
The recording of the first episode (September 2003) allowed us to compare the characteristics
of the signal with those of the OIS recorded in the laboratory. Both have the same spectral
distribution and an analogous time distribution on the wide scale (see Figs. 3, 4, and 5) and show
identical or almost equal distribution times, that is the impulsive sequences have a duration of 1.2
s and are separated by intervals of 3 - 3.6 s with a bandwidth of 3 kHz.
The analogy of the signals recorded in the atmosphere with those recorded in the laboratory
may be due to the dimension of the micro-fractures in small samples (those in the laboratory) and
in the large scale and in spite of the fact that in the laboratory the stress rate is much greater than
in the crust of the Earth.
Considering the earthquake list, shown in Table 2 (with events with M ≥ 4.5), it is interesting
to note that, the three earthquakes for which the hypothetical precursors are observed are
relatively large and close enough to the EM stations to be detected.
Based on this observation, we tentatively propose the hypothesis of a magnitude threshold
related to the release of observable EM precursors remembering that the EM emissions have always
been recorded during laboratory experiments.
209
Boll. Geof. Teor. Appl., 48, 205-212
Nardi et al.
Fig. 5 - Spectrum of the EM signal associated to the (M ≥ 4.5) earthquake occurring off the coast of Anzio (Latium)
on August 22, 2005. The OIS signal was recorded on August 18. The hours in UTC are on the x axis, the frequency in
kHz is on the y axis. The amplitude of the spectrum is expressed by means of the intensity of the gray color. The OIS
signal covers a band of about 3 kHz centered at about 8 kHz.
We could not record the DIS signals using the automatic recording in the field, due to the limited
resolution of the apparatus. However, a similar signal was observed during the explosions and
collapsing of rocks in the cave of massive limestone (Nardi, 2001; Nardi et al., 2003; Nardi and
Caputo, 2003, 2006).
4. Conclusions
The instruments and procedure used in this study allow us to identify possible EM precursors of
earthquakes. We describe the EM emission as composed of two independent signals (SIO and SID)
occurring during different stages of the stressing process. In two years of field observations, we
recorded possible precursors for three earthquakes occurring in the area monitored by the
instruments. We observe only SIO signals, while the presence of eventual SID signals is hampered
by the automatic operation of the stations used in the field, whose time resolution is much lower than
that of the apparatus used in the laboratory experiments. Although the number of cases is still limited,
we did not record any false alarm and all the M ≥ 4.5 earthquakes occurring close to the stations show
presumed EM precursors that are very similar to OIS signals.
Statistical studies about different types of EM precursors observed in the ionosphere (Asada et
al., 2001; Liu et al., 2004; Pulinets and Boyarchuck, 2004) shows advance times, distance from the
epicenter and also one threshold of magnitude analogous to our observations.
The SID signals observed in laboratory experiments would also be important since they appear
with a larger amplitude than the SIO signals and they last longer, culminating with the fracture of the
samples.
Moreover, the one to one correspondence between the VLF impulses and the opening of the
fractures in the samples observed acoustically suggests that these signals may potentially monitor the
210
EM earthquake precursors
Boll. Geof. Teor. Appl., 48, 205-212
Fig. 6 - Distribution of the earthquakes recorded in the time interval September - December 2003 [retrieved from the
INGV catalogue (www.ingv.it/~roma/reti/rms/bollettino/index.php)] plotted as function of decreasing magnitude (on the
y axis) and of an increasing distance (on the x axis) from the VLF recording stations. The sets of 3 points for each
epicenter indicate the relative distances from the 3 stations. The arrow indicates the earthquake of September 14, 2003
associated to the EM emission of September 10, shown in Fig. 3. This signal is the strongest and, at the same time, the
closest to the associated earthquake.The 3 cases considered tentatively suggest the possible existence of a magnitude
threshold (around 4.5) for the generation and recording of the EM emission.
phenomenon of dilatancy at distance.
Finally, the temporal relation tentatively inferred from the laboratory data may be related to the
possibility of forecasting the time of occurrence of the earthquake.
REFERENCES
Akinaga Y., Hayakawa M., Liu J.Y., Yumoto K. and Hattori K.; 2001: A precursory ULF segnature for the Chi-Chi
earthquake in Taiwan. Natural Hazards and Earth System Sciences, 1, 33-36.
Asada T., Baba H., Kawazoe M. and Sugiura M.; 2001: An attempt to delineate very low frequency electromagnetic signals
associated with earthquakes. EPS, 53, 55-62.
Bella F., Biagi P.F., Caputo M., Della Monica G., Ermini A., Pettinelli V. and Sgrigna V; 1993: Ground tilt variations
detected in the Central Appennines in the period 1986-1989 and their correlation with seismicity. Nuovo Cimento, 16,
303-311.
Bella F., Biagi P.F., Caputo M., Cozzi E., Della Monica G., Ermini A., Plastino W. and Sgrigna V.; 1998: Field strength
variations of LF radio waves prior to earthquakes in central Italy. Physics of the Planetary Interiors, 105, 279-286.
Caputo M., 1987: Sismologia e segnali precursori dei terremoti. Ed. Calderini, Bologna.
Eftaxias K., Kapiris P., Polygiannakis J., Peratzakis a., Kopanas J., Antonopulos G. and Rigas D.; 2003: Experience of short
211
Boll. Geof. Teor. Appl., 48, 205-212
Nardi et al.
term earthquake precursors with VLF-VHF electromagnetic emissions, Natural Hazards and Earth System Sciences, 3,
217-228.
Fraser-Smith A.C., Bernardi A., McGill P.R., Ladd M.E., Helliwell R.A., and Villard O.G. Jr.; 1990: Low-frequency
magnetic field measurements near the epicenter of the Ms 7.1 Loma Prieta earthquake. Geoph. Res. Letts., 17, 14651468.
Galli I.; 1910: Raccolta e classificazione di fenomeni luminosi osservati nei terremoti. Boll. Soc. Sism. It., 14, 221-448.
Ismaguliov V.S., Kopytenko Y.A., Hattori K. and Mayakawa M.; 2002: Variations of phase velocity and gradient values of
ULF disturbances connected with the Izu strong earthquakes. Natural Hazards and Earth System Sciences, 3, 211-215.
Karakelian D., Beroza G.C., Klemperer S.L. and Fraser-Smith; 2000a: Analysis of ultra-low frequency electromagnetic field
measurements associated with the 1999 M7.1 Hector Mine earthquake sequence. Bull. Seismol. Soc. Am., 92, 15131524.
Karakelian D., Klemperer S.R., Thompson J.A. and Fraser-Smith A.C.; 2000b: In: Results from electromagnetic monitoring
of the Mw 5.1 San Juan Bautista, California earthquake of 12 August 1998. Bokelman G. and Kovach R.L. (eds). Proc.
3rd conf. “Tectonic problems of the San Andreas Fault System,” Stanford University Publications, Geological Sciences,
21, pp. 334-345.
Liu J.Y. et al.; 2004: Pre-earthquake ionospheric anomalies registred by continuous GSP TEC measurements. Ann.
Geophys., 22, 1585-1593.
Mognaschi E.R.; 1997: Segnali radio che precedono eventi sismici. Radioonde 8, ottobre, Web page: www.anisn.it/
geologia2000/R_Mog.html.
Mognaschi E.R. and Zezza U.; 2000: Detection of electromagnetic emission from fracture of rocks and building stones
under stress. In: Proceeding of the 5th International Congress on Restoration of Architectural Heritage, Firenze, 17
settembre, pp. 553-562.
Molchanov O., Schekotov A., Fetorov E., Belyaev G. and Gordeev E.; 2003: Presismic ULF electromagnetic effect from
observation at Kamchatka. Natural Hazards and Earth System Sciences, 3, 203-209.
Nagao T., Enomoto Y., Fujinawa Y., Hata M., Hayakawa M., Huang Q., Izutsu J., Kushida Y., Maeda, K., Oike K., Uyeda
S. and Yoshino T.; 2002: Electromagnetic anomalies associated with 1995 Kobe earthquake. J. Geodynamics, 33, 349359.
Nardi A.; 2001: Evidenze di emissioni elettromagnetiche in rocce sottoposte a sollecitazione meccanica. Tesi di laurea in
Scienze Geologiche, Università degli studi di Roma “La Sapienza”.
Nardi A. and Caputo M.; 2005: Electromagnetic emissions during rock loading and fracture, first precursors recorded. In:
Eighth Workshop on Non-linear Dynamics and Earthquake Prediction, 3 October-17 October 2005.
Nardi A. and Caputo M.; 2006: A perspective electric earthquake precursor observed in the Apennines. Boll. Geof. Teor.
Appl., 47, 3-12.
Nardi A., Caputo M., De Natale G. and Scarascia Mugnozza G.; 2003: Evidence for electromagnetic emissions during rock
loading and fracture: a way towards earthquake forecast. In: Slejko D. (a cura di), Convegno Nazionale Gruppo
Nazionale Geofisica Terra Solida, Riassunti estesi delle comunicazioni, Tip. Mosetti, Trieste, pp. 163-164.
Ohta k., Umeda K., Watanabe N. and Hayakawa M.; 2001: ULF/ELF emissions observed in Japan, possibly associated with
the Chi-Chi earthquake in Taiwan. Natural Hazards and Earth System Sciences, 1, 37-42.
Pulinets S.A. and Boyarchuk K.A.; 2004: Ionospheric precursors of earthquakes. Spring-Verlag, Berlin, Germany, 315 pp.
Smirnova N., Hayakawa M., Gotoh K. and Volobuev B.; 2001: Scaling characteristics of geomagnetic ULF fields at the
Guam sismoactive area and their yinamics in relation to the earthquakes. Natural Hazards and Earth System Sciences,
1, 119-126.
Yoshino T.; 1997: Case 26 – Increase VLF Background Noise Level. Pure Appl. Geophys, 149, 147-157.
Corresponding author: Adriano Nardi
Istituto Nazionale di Geofisica e Vulcanologia, UTO-MAE
c/o Caserma Bulgarella
Viale Pinturicchio 23/e, 00196 Roma, Italy
e-mail: [email protected]
212
Scaricare