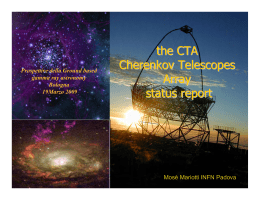
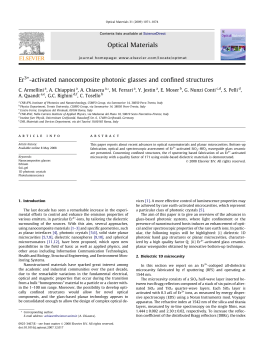
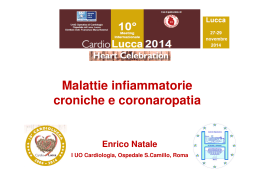
5050
OPTICS LETTERS / Vol. 39, No. 17 / September 1, 2014
Mid-infrared frequency comb for broadband
high precision and
sensitivity molecular spectroscopy
I. Galli,1 S. Bartalini,1 P. Cancio,1 F. Cappelli,1,4 G. Giusfredi,1 D. Mazzotti,1,*
N. Akikusa,2 M. Yamanishi,3 and P. De Natale1
1
Istituto Nazionale di Ottica (INO)—CNR and European Laboratory for Non-linear Spectroscopy (LENS),
Via Carrara 1, 50019 Sesto Fiorentino FI, Italy
2
Development Bureau Laser Device R&D Group, Hamamatsu Photonics KK, Shizuoka 434-8601, Japan
3
4
Central Research Laboratories, Hamamatsu Photonics KK, Shizuoka 434-8601, Japan
Current address: Institut für Quantenelektronik—ETH, Auguste-Piccard-Hof 1, 8093 Zürich, Switzerland
*Corresponding author: [email protected]
Received June 6, 2014; revised July 14, 2014; accepted July 17, 2014;
posted July 17, 2014 (Doc. ID 213106); published August 20, 2014
We report on the experimental demonstration of the metrological and spectroscopic performances of a mid-infrared
comb generated by a nonlinear downconversion process from a Ti:sapphire-based near-infrared comb. A quantum
cascade laser at 4330 nm was phase-locked to a single tooth of this mid-infrared comb and its frequency-noise power
spectral density was measured. The mid-infrared comb itself was also used as a multifrequency highly coherent
source to perform ambient air direct comb spectroscopy with the Vernier technique, by demultiplexing it with
a high-finesse Fabry–Perot cavity. © 2014 Optical Society of America
OCIS codes: (140.4050) Mode-locked lasers; (140.5965) Semiconductor lasers, quantum cascade; (190.4223) Nonlinear wave mixing; (140.3590) Lasers, titanium; (120.2230) Fabry-Perot.
http://dx.doi.org/10.1364/OL.39.005050
Since the advent of optical frequency combs (OFCs) [1],
high-precision spectroscopy has been benefiting from a
tool with unprecedented metrological features [2,3].
Nowadays, the development of OFCs in the visible and
near-infrared (NIR) domains has reached such a maturity
level as to be commercially available. As a consequence,
the number of applications of OFCs is growing more and
more, ranging from the calibration of astronomical
spectrographs [4], to the development of optical atomic
clocks [5]. The frequency coverage of OFCs is rapidly improving [6], up to the extreme ultraviolet [7] and down to
the terahertz [8] spectral regions. The extension of OFCs
to the mid-infrared (MIR) is of particular interest [9],
since many molecular species have strong ro-vibrational
transitions in this spectral region. Therefore, OFC-assisted MIR precision spectroscopy is a powerful tool both
for investigating the internal structure of molecules (and
all related fundamental physical laws and/or constants)
and for identifying and quantifying trace gases (even
down to sub-ppt concentrations [10]) in several application fields (atmospheric monitoring, security, medical diagnostics, and so on).
Different approaches have been pursued to generate
MIR OFCs: with difference-frequency generation (DFG)
processes either between a NIR OFC and a continuouswave (CW) laser [11–13] or between two spectral
portions of the same NIR OFC [14–18]; with optical parametric oscillators pumped by NIR OFCs [19–22]; with χ 3
nonlinear processes occurring in high-Q monolithic
microresonators [23,24].
Quantum cascade lasers (QCLs) parallel OFCs in their
rapid development and represent a mature technology
for providing powerful, tunable, and narrow-linewidth
coherent sources for precise measurements in the
mid/far-infrared spectral region [25]. Phase/frequency
0146-9592/14/175050-04$15.00/0
stabilization of QCLs against OFCs was achieved with
different schemes. MIR QCLs were phase-locked to NIR
OFCs either by optical injection locking [26] or by heterodyne beating [27] with OFC-referenced DFG radiation.
Similarly, sum-frequency generation with NIR OFCs
was used for upconverting MIR QCLs and heterodyne
beating them with different spectral portions of the same
OFCs [28]. Recently, direct comb emission from a QCL
was demonstrated [29,30].
Here we report on the metrological and spectroscopic
performances of a MIR OFC generated by a nonlinear
downconversion process from a NIR OFC. The MIR
OFC served both as an accurate and highly stable
phase/frequency reference for a CW quantum cascade
laser at 4330 nm, thus enabling high-precision spectroscopy with a powerful and narrow linewidth MIR source,
and as a multifrequency highly coherent MIR source to
perform high-sensitivity broadband direct comb spectroscopy in ambient air with the Vernier technique.
By using the experimental setup shown in Fig. 1 and
described, with more details, in [13], we generated a
MIR OFC and phase-locked a room-temperature CW
distributed-feedback (DFB) QCL around 4330 nm to a single tooth of the comb. This was done by superimposing
a fraction of the QCL beam (about 1 mW) with the MIR
OFC beam and sending them to a liquid-N2 -cooled
HgCdTe photodiode (200-MHz bandwidth, PD1 in Fig. 1).
Figure 1 shows the detected beat-note between the QCL
and the nearest comb tooth, as recorded by a RF spectrum
analyzer. The beat-note frequency was phase-locked to a
local oscillator provided by a RF signal generator, by
using a home-made phase-detection electronics with
hybrid analog/digital architecture. The phase-error signal
was processed by a proportional-integral controller. The
servo bumps confirm a phase-locking bandwidth of
© 2014 Optical Society of America
September 1, 2014 / Vol. 39, No. 17 / OPTICS LETTERS
CO2 in air
PD1
Beat-note
detection
Empty cavity
PD2
MIR OFC
Removable
beam-splitter -40
Free running
Locked
RBW=4 kHz
Mirror
Beat-note (dBm)
Room temp.
DFB-QCL
@4300 nm
-50
-60
-70
-80
-600
-400
-200
0
200
400
600
Relative frequency (kHz)
Fig. 1. Experimental setup. Inset: beat-note between the QCL
and one MIR OFC tooth, in both free-running and phase-locked
conditions.
about 400 kHz, mainly limited by the QCL frequency
modulation behavior. The phase-locking efficiency η 73% was estimated as the ratio between the areas of
the resolution-bandwidth-limited carrier and the whole
2
beat-note spectrum. From the formula η e−ϕrms we
calculated a residual rms phase-noise ϕrms 0.56 rad,
as an estimate of the phase-locked loop performance.
We remark that the possibility of phase locking the
QCL to one arbitrary MIR OFC tooth within its working
range (which for a standard DFB QCL spans about
300 GHz) makes the MIR OFC itself a sort of universal
absolute frequency reference for this class of lasers.
A free-running QCL linewidth of about 400 kHz is
inferred from the free-running beat-note of Fig. 1, by
considering the few kilohertz linewidth we measured
for the MIR OFC tooth [13]. Instead, a full characterization of the phase-locked QCL linewidth behavior at
different time scales can be only retrieved by measuring
its frequency-noise power spectral density (FNPSD). To
that purpose, we used an empty 1-m-long high-finesse
Fabry–Perot (F–P) cavity (finesse F ≈ 8000 at 4330 nm)
as a frequency-to-amplitude converter. Figure 2 shows a
comparison between FNPSDs of the phase-locked QCL
measured in this work and of the MIR OFC measured
in our previous work [13]. Both spectra have been compensated for the F–P cavity cutoff, corresponding to a
8.5 μs ringdown time for resonant photons. The quite
good agreement between the two recorded noise spectra
confirms the validity of what we assumed in the previous
work, i.e., that measuring the FNPSD of many comb teeth
together (simultaneously tuned on the same F–P cavity
fringe side) yields the same result as measuring it for
a single comb tooth. It is worth noting that this further
confirmation of the MIR OFC high coherence degree
was enabled by the phase-locked QCL, used as a tracking
oscillator “amplifying” a single comb tooth, otherwise too
weak to be measured. By properly integrating the FNPSD
spectrum of the phase-locked QCL [31], we can retrieve a
linewidth of about 4.6 kHz over 1 s, with a narrowing factor of about 100. This value is a bit larger than what was
measured for the MIR OFC (2 kHz), mainly due to
residual 1∕f frequency noise of the QCL. Such a single-frequency narrow-linewidth, absolutely referenced
MIR coherent source with tens of milliwatts of power
can serve as a unique tool to perform high-precision/
sensitivity molecular spectroscopy, also exploiting
recently developed sub-Doppler techniques [32].
Alternatively, the multifrequency MIR OFC itself can
be used for broadband direct comb spectroscopy. A convenient technique to go this second route is the Vernier
technique [33], which proved to be able to resolve all individual teeth of the MIR OFC, as described below. We
would like to point out that this approach was enabled
by the high average power (about 1 μW) and narrow linewidth (about 5 kHz) of each tooth. Since our F–P cavity
has a free spectral range FSR ≈ 150 MHz and the signal
NIR OFC has a repetition rate f r ≈ 1 GHz, the simplest
Vernier ratio to make the MIR OFC teeth simultaneously
resonant with the F–P cavity (neglecting the mirrors
dispersion) is
f r0 Fig. 2. Comparison between FNPSDs measured for the MIR
OFC (see [13]) and for the phase-locked QCL, retrieved by using
the F–P cavity as a frequency-to-amplitude converter. The MIR
comb trace is noisier than the QCL one, due to lower available
power.
5051
20
20 c
FSR ;
3
3 2L0
(1)
where L0 ≈ 1 m is the fixed resonance length of the F–P
cavity. In order to resolve the single teeth, we chose a
repetition rate f r of the NIR OFC that was deliberately
slightly detuned from the value f r0 that perfectly satisfies
the Vernier condition in Eq. (1). We scanned the cavity
length by applying a voltage ramp to three PZT actuators
moving one of the two mirrors. We plot in Fig. 3 the measured spectrum of the MIR OFC, as transmitted by the
empty F–P cavity and detected by a liquid-N2 -cooled InSb
photodiode (1-MHz bandwidth, PD2 in Fig. 1). The MIR
OFC spectrum exhibits a FWHM of about 200 GHz, due to
the spectral bandwidth of quasi-phase-matching (QPM)
conditions, with strong amplitude inhomogeneities,
mainly due to absorption from CO2 in ambient air over
2 m path length. The absolute frequency scale was
retrieved in two steps. First, a relative, linear frequency
scale was calculated by fitting the length-to-voltage response of the PZT actuators to a 5th-order polynomial
curve, by using the comb teeth as frequency markers
with spacing equal to 3f r . Second, the molecular
5052
OPTICS LETTERS / Vol. 39, No. 17 / September 1, 2014
Fig. 3. MIR OFC spectrum measured with the Vernier
technique: only one of the three subcombs is shown, with no
amplitude normalization.
absorption features in ambient air were used (as a
“natural” wavemeter) to retrieve the integer order numbers of the teeth.
The spectrum plotted in Fig. 3 was measured by averaging 80 scans of the F–P cavity length and the measured
full width at half-maximum (FWHM) of each single tooth
corresponds to 55 kHz, which is wider than the cavity
resonance linewidth (about 19 kHz), mainly due to cavity
drift during the averaging time (4.75 s).
Given the 20∕3 Vernier ratio, when scanning the cavity
length by a complete FSR, three subcombs were measured, each one with teeth spacing 3f r and shifted with
respect to the others by f r . After properly interlacing
the three subcombs, we obtained an overall MIR OFC
with teeth spacing f r , whose central portion is shown
in Fig. 4. The transmission spectrum through 2 m path
length in ambient air, as simulated by the HITRAN
Fig. 4. Central portion of the MIR OFC air transmission spectrum measured with the Vernier technique. Circles, squares,
and triangles identify the three interlaced subcombs. The HITRAN simulation is plotted below and the CO2 ro-vibrational
transitions of two bands are also labeled; ν3 → 000 1 − 000 0,
ν3 → 011 1 − 011 0.
2012 database [34,35], is also plotted in the same figure.
The agreement between the experimental MIR OFC
transmission spectrum in air and the HITRAN simulation
is very good. Actually, the spectrum of the generated MIR
OFC depends both on the parent NIR OFC and on QPM
conditions. Therefore, to make the visual comparison
above easier, the experimental data plotted in Fig. 4 were
normalized to make the amplitude of the MIR OFC teeth
as flat as possible. This was done by dividing the original
spectrum of each subcomb by an envelope Gaussian
curve with the same center and width.
In conclusion, we have shown that a low-frequencynoise MIR OFC can be exploited to phase lock a QCL
to one of its spectral teeth, thus absolutely referencing
the QCL frequency and narrowing its linewidth by about
2 orders of magnitude. Furthermore, the comb nature of
this absolute frequency reference also makes it a unique
tool either for simultaneously referencing several MIR lasers with Cs-clock traceability, or for phase locking one
MIR laser to another, acting as a transfer oscillator with
hundreds of gigahertz bandwidth. Finally, we have
shown that this MIR OFC is suitable as a direct source
for broadband high-precision molecular spectroscopy
at atmospheric pressure. When detecting a sample gas
with lower concentration than ambient CO2 (∼400 ppm)
and/or weaker lines, the achieved sensitivity can be
pushed even further by using the F–P cavity itself as a
spectroscopy cell with ∼5 km effective absorption
length. For all these purposes the wide tunability of
this setup (4.2–5.0 μm), limited by both the Ti:sapphire
laser and the spectral bandwidth of the high-finesse
F–P cavity, is one of its selling points.
We gratefully acknowledge funding from LaserlabEurope, grant agreement no. 284464; EU 7th Framework
Program; Programma Nazionale di Ricerche in Antartide
(PNRA), 2013/AC4.01 research project; Italian Ministry of
Foreign Affairs; “Broadcon” Italy-Israel bilateral project;
ESFRI Roadmap; Extreme Light Infrastructure (ELI)
project.
References
1. T. Udem, R. Holzwarth, and T. W. Hänsch, Nature 416, 233
(2002).
2. S. A. Diddams, J. Opt. Soc. Am. B 27, B51 (2010).
3. P. Maddaloni, M. Bellini, and P. De Natale, Laser-Based
Measurements for Time and Frequency Domain Applications: A Handbook, Series in Optics and Optoelectronics
(CRC Press, 2013).
4. T. Steinmetz, T. Wilken, C. Araujo-Hauck, R. Holzwarth,
T. W. Hänsch, L. Pasquini, A. Manescau, S. D’Odorico,
M. T. Murphy, T. Kentischer, E. Schmidt, and T. Udem, Science 321, 1335 (2008).
5. D. Akamatsu, M. Yasuda, H. Inaba, K. Hosaka, T. Tanabe, A.
Onae, and F.-L. Hong, Opt. Express 22, 7898 (2014).
6. P. Maddaloni, P. Cancio, and P. De Natale, Meas. Sci.
Technol. 20, 052001 (2009).
7. A. Cingöz, D. C. Yost, T. K. Allison, A. Ruehl, M. E. Fermann,
I. Hartl, and J. Ye, Nature 482, 68 (2012).
8. L. Consolino, A. Taschin, P. Bartolini, S. Bartalini, P.
Cancio, A. Tredicucci, H. E. Beere, D. A. Ritchie, R. Torre,
M. S. Vitiello, and P. De Natale, Nat. Commun. 3, 1040
(2012).
9. A. Schliesser, N. Picque, and T. W. Hänsch, Nat. Photonics
6, 440 (2012).
September 1, 2014 / Vol. 39, No. 17 / OPTICS LETTERS
10. I. Galli, S. Bartalini, S. Borri, P. Cancio, D. Mazzotti, P. De
Natale, and G. Giusfredi, Phys. Rev. Lett. 107, 270802
(2011).
11. P. Maddaloni, P. Malara, G. Gagliardi, and P. De Natale,
New J. Phys. 8, 262 (2006).
12. E. Baumann, F. R. Giorgetta, W. C. Swann, A. M. Zolot, I.
Coddington, and N. R. Newbury, Phys. Rev. A 84, 062513
(2011).
13. I. Galli, F. Cappelli, P. Cancio, G. Giusfredi, D. Mazzotti, S.
Bartalini, and P. De Natale, Opt. Express 21, 28877 (2013).
14. A. Gambetta, R. Ramponi, and M. Marangoni, Opt. Lett. 33,
2671 (2008).
15. T. W. Neely, T. A. Johnson, and S. A. Diddams, Opt. Lett. 36,
4020 (2011).
16. A. Ruehl, A. Gambetta, I. Hartl, M. E. Fermann, K. S. E.
Eikema, and M. Marangoni, Opt. Lett. 37, 2232 (2012).
17. F. Zhu, H. Hundertmark, A. A. Kolomenskii, J. Strohaber, R.
Holzwarth, and H. A. Schuessler, Opt. Lett. 38, 2360 (2013).
18. S. A. Meek, A. Poisson, G. Guelachvili, T. W. Hänsch, and N.
Picqué, Appl. Phys. B 114, 573 (2014).
19. N. Leindecker, A. Marandi, R. L. Byer, and K. L. Vodopyanov,
Opt. Express 19, 6296 (2011).
20. N. Coluccelli, H. Fonnum, M. Haakestad, A. Gambetta, D.
Gatti, M. Marangoni, P. Laporta, and G. Galzerano, Opt.
Express 20, 22042 (2012).
21. Z. Zhang, X. Fang, T. Gardiner, and D. T. Reid, Opt. Lett. 38,
2077 (2013).
22. K. A. Ingold, A. Marandi, C. W. Rudy, K. L. Vodopyanov, and
R. L. Byer, Opt. Lett. 39, 900 (2014).
23. P. Del’Haye, A. Schliesser, O. Arcizet, T. Wilken, R.
Holzwarth, and T. J. Kippenberg, Nature 450, 1214 (2007).
24. C. Y. Wang, T. Herr, P. Del’Haye, A. Schliesser, J. Hofer, R.
Holzwarth, T. W. Hänsch, N. Picqué, and T. J. Kippenberg,
Nat. Commun. 4, 1345 (2013).
25. S. Bartalini, M. S. Vitiello, and P. De Natale, Meas. Sci.
Technol. 25, 012001 (2014).
5053
26. S. Borri, I. Galli, F. Cappelli, A. Bismuto, S. Bartalini, P.
Cancio, G. Giusfredi, D. Mazzotti, J. Faist, and P. De Natale,
Opt. Lett. 37, 1011 (2012).
27. I. Galli, M. Siciliani de Cumis, F. Cappelli, S. Bartalini, D.
Mazzotti, S. Borri, A. Montori, N. Akikusa, M. Yamanishi,
G. Giusfredi, P. Cancio, and P. De Natale, Appl. Phys. Lett.
102, 121117 (2013).
28. A. A. Mills, D. Gatti, J. Jiang, C. Mohr, W. Mefford, L.
Gianfrani, M. Fermann, I. Hartl, and M. Marangoni, Opt.
Lett. 37, 4083 (2012).
29. A. Hugi, G. Villares, S. Blaser, H. C. Liu, and J. Faist, Nature
492, 229 (2012).
30. J. B. Khurgin, Y. Dikmelik, A. Hugi, and J. Faist, Appl. Phys.
Lett. 104, 081118 (2014).
31. D. S. Elliott, R. Roy, and S. J. Smith, Phys. Rev. A 26, 12
(1982).
32. G. Giusfredi, S. Bartalini, S. Borri, P. Cancio, I. Galli, D.
Mazzotti, and P. De Natale, Phys. Rev. Lett. 104, 110801
(2010).
33. C. Gohle, B. Stein, A. Schliesser, T. Udem, and T. W.
Hänsch, Phys. Rev. Lett. 99, 263902 (2007).
34. L. S. Rothman, I. E. Gordon, Y. Babikov, A. Barbe, D. C.
Benner, P. F. Bernath, M. Birk, L. Bizzocchi, V. Boudon,
L. R. Brown, A. Campargue, K. Chance, E. A. Cohen,
L. H. Coudert, V. M. Devi, B. J. Drouin, A. Fayt, J.-M. Flaud,
R. R. Gamache, J. J. Harrison, J.-M. Hartmann, C. Hill, J. T.
Hodges, D. Jacquemart, A. Jolly, J. Lamouroux, R. J. Le Roy,
G. Li, D. A. Long, O. M. Lyulin, C. J. Mackie, S. T. Massie, S.
Mikhailenko, H. S. P. Müller, O. V. Naumenko, A. V. Nikitin,
J. Orphal, V. Perevalov, A. Perrin, E. R. Polovtseva, C.
Richard, M. A. H. Smith, E. Starikova, K. Sung, S. Tashkun,
J. Tennyson, G. C. Toon, V. G. Tyuterev, and G. Wagner, J.
Quant. Spectrosc. Radiat. Transfer 130, 4 (2013).
35. Harvard–Smithsonian Center for Astrophysics (CfA), V. E.
Zuev Insitute of Atmosperic Optics (IAO), “HITRAN on the
Web,” (2014).
Scaricare