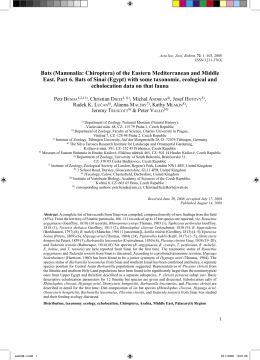
Downloaded from thorax.bmj.com on 21 July 2007
1012
Particle Epidemiology Reanalysis Project.
Cambridge, MA: Health Effects Institute, 2000.
11 Hoek GB, Brunekreef S, Goldbohm P, et al.
Association between mortality and indicators of
traffic-related air pollution in the Netherlands: a
cohort study. Lancet 2002;360:1203–9.
12 Reynolds P, Elkin E, Scalf R, et al. Case-control
pilot study of traffic exposures and early
childhood leukemia using a geographic
information system. Bioelectromagnetics
2001;5:S58–68.
13 Anon. Exposure assessment in studies
on the chronic effects of long-term
exposure to air pollution, Report on a
WHO/HEI Workshop, Bonn, Germany, 4–5
February 2002. Copenhagen: World Health
Organization Regional Office for Europe,
2003.
14 Cass GR, Conklin MH, Shah JJ, et al.
Elemental carbon concentrations: estimation of an
historical data base. Atmos Environ
1984;18:153–62.
Nitrogen dioxide
.......................................................................................
Hypothesis: Ill health associated with
low concentrations of nitrogen
dioxide—an effect of ultrafine
particles?
A Seaton, M Dennekamp
...................................................................................
The epidemiological associations between illness and nitrogen
dioxide may be the consequence of confounding by particle
numbers
I
n 1996 the Expert Panel on Air
Quality Standards (EPAQS) recommended an ambient air standard for
nitrogen dioxide (NO2) in the UK of
150 ppb measured hourly.1 This recommendation, like those for carbon monoxide (CO) and sulphur dioxide (SO2)
that had preceded it, was based on
human toxicology rather than on epidemiology. The EPAQS was unable to find
evidence that these gases were likely to
be toxic to humans at the recommended
concentrations. However, at the time of
the NO2 recommendation there was
already epidemiological evidence that
effects on populations rather than individuals might be associated with much
lower concentrations and the EPAQS
recommended that steps be taken to
reduce annual average concentrations,
although without proposing a long term
standard. The UK government has subsequently adopted, as targets to be
achieved by 2005, World Health
Organization NO2 guideline standards
of 105 ppb (200 mg/m3) over 1 hour and
21 ppb (40 mg/m3) as an annual average, the latter having been based on
possible relationships between exposure
to the gas and respiratory illness in
children.2 Achievement of a long term
standard does, of course, have the
desirable consequence of reducing peaks
and therefore short term exceedences.
www.thoraxjnl.com
However, compliance with a very low
average concentration of NO2 implies a
substantial reduction in the concentration of the primary pollutant released
from vehicle exhausts—that is, nitric
oxide (NO). Since NO reacts with ozone
to form NO2, lower concentrations will
result in raised urban ozone concentrations, a gas that also has known toxic
effects on the lungs and that, until now,
has been seen primarily as a rural
pollutant in the UK.
Progressive reductions in pollution
are welcomed by many because of a
belief that human health and the
ecology of the planet will benefit, but
it must be remembered that they
are attained at a cost to industry and
thus to society. That cost may be
offset by reductions in health expenditure, by increases in life expectancy
and crop productivity, and by opportunities for the innovative in designing
more efficient engines and fuels. The
components of this equation can at
present only be estimated very uncertainly, therefore setting tight standards
tends to be an act of faith, typically
driven by political balancing of the
exhortations of pressure groups on
both sides. This makes it particularly
important to attempt to quantify the
health effects of pollutants, a process
that has traditionally been based on
EDITORIAL
15 Cohen AJ, Anderson HR, Ostro B, et al. Mortality
impacts of urban air pollution. In: Ezzati M,
Lopez AD, Rodgers A, Murray CJL, eds.
Comparative quantification of health risks: global
and regional burden of disease attributable to
selected major risk factors. Geneva: World Health
Organization, 2003;(in press).
16 Smith KR, Mehta S. The burden of disease from
indoor air pollution in developing countries:
comparison of estimates. Int J Hygiene Environ
Health 2003 (in press).
known toxicological effects but now
increasingly relies on epidemiological
relationships.
TOXIC EFFECTS OF NITROGEN
DIOXIDE: EPIDEMIOLOGY OR
TOXICOLOGY?
Scientific confusion arises from the
different viewpoints of toxicologists
and epidemiologists which may be illustrated by considering NO2. Human
inhalation challenge studies have
shown that normal healthy individuals
do not show adverse effects to NO2
below concentrations of about 2000 ppb
(about 4000 mg/m3). Asthmatic subjects
may react to concentrations as low as
250 ppb (about 500 mg/m3), either by
alterations in bronchial reactivity or by
increased sensitivity to inhaled allergens. Such subclinical changes might
reasonably be expected to be associated
with occasional exacerbations of asthma
in very susceptible individuals in an
exposed population. However, it is
difficult to imagine that concentrations
less than half of this could be responsible for clinically measurable episodes
of illness, or that concentrations around
a fifth of this could cause chronic health
problems. While epidemiological studies
have sometimes been able to detect
associations that suggest health benefits
may accrue by adhering to standards set
at such very low concentrations, the
overall message from these studies is
confusing. For example, the WHO
review in 20003 concluded that ‘‘the
most consistent general impression is of
increased respiratory illness in older
children’’. The report goes on to speculate that such episodes may set the
scene for chronic lung disease in later
life. This conclusion was weighted by
consideration of studies of children
living in houses with and without gas
cookers. However, such studies have
shown equivocal results, one metaanalysis having shown a significant
effect4 and another not.5 6 As we have
shown, gas cooking may entail very high
acute exposures to both NO2 and particles.7 In fact, the heterogeneity of
epidemiological findings with respect
to NO2 led the UK Department of
Downloaded from thorax.bmj.com on 21 July 2007
1014
20000
10000
9000
UFP (/cm3)
8000
7000
6000
5000
4000
3000
2000
1000
4
5
6
7
8
9 10
20
NO
2
30
40
(ppb)
Figure 2 Relationship between mean outdoor air 24 hour counts of particles ,100 nm in
diameter (UFP) and nitrogen dioxide (NO2) concentrations in parts per billion. Data represent
6 months of continuous side by side measurement.
We are left to argue, from toxicological
considerations, which of these is
likely—at the known concentrations to
which individuals are exposed—to
cause the observed effects. At the
moment there is evidence for toxic
effects of ultrafine particles at quite
low concentrations in animals.17
Relatively few studies have related
particle numbers to cardiorespiratory
illness, the most detailed being those
of Wichmann’s group in Erfurt,
Germany. They have shown a somewhat
weaker correlation between gases and
particle numbers than us, but they have
shown associations between numbers,
NO2, SO2, CO and cardiorespiratory
deaths.18 19 It should be noted that, in
contrast to most UK cities, domestic
heating in Erfurt makes an important
contribution to particulate pollution in
the winter and SO2 concentrations are
higher. Wichmann and colleagues concluded that the apparent effects of the
gases were likely to be a result of
confounding.
PARTICLES AS MICROBES – AN
HYPOTHESIS
A plausible explanation for this toxicity
is as follows. We hypothesise that the
lung reacts to particle numbers rather
than mass, since its primary defensive
role is to counter invasion by microorganisms which may be inhaled in
large numbers but never in high mass.
The first requirement of the lung is to
kill organisms in situ and/or to transfer
them to lymph nodes where immune
responses may be concentrated, and
ingestion by macrophages is central to
this mechanism. Ultrafine particles,
however, may evade this and pass
directly through the alveolar wall, thus
being able directly to influence endothelial cell structures. Both macrophages
and endothelium release mediators that
have local and more general influences,
one of which is to signal that bloodstream invasion may be imminent; a
systemic reaction—the acute phase
response—is a consequence. If we
assume that the lung treats small
particles as microorganisms, it is reasonable to propose that its response relates
to numbers rather than mass. By altering blood coagulability and possibly by
destabilising atheromatous plaques, this
systemic response may be responsible
for the acute cardiac effects seen in
vulnerable individuals. It seems far
more plausible that these effects are a
response to the number of particles
rather than to NO2, for which no
comparable hypothetical explanation of
effects at such low concentrations has
yet been proposed.
EDITORIAL
The toxicity of microorganisms does
not, of course, depend entirely on the
numbers inhaled; their inherent ability
to initiate cell damaging reactions or to
resist defences is critically important.
Similarly, not all inhaled particles would
be expected to be equally toxic—for
example, quartz and titanium dioxide.
Thus, something other than particle
numbers needs to be invoked to explain
their effects, and this is likely to be the
nature of the surfaces they present to
the lung’s defences.12 17 A further step in
explaining toxicity therefore requires
consideration of surface properties.
However, in urban air the very smallest
particles make an overwhelming contribution to the total surface area, so
measurement of one represents the
other.
We propose that the observed associations between ill health and NO2 at low
concentrations in the ambient air are
the result of confounding by particle
numbers. We have earlier hypothesised
that a systemic response to particle
inhalation is responsible for the acute
cardiorespiratory effects,10 a suggestion
for which there is now considerable
support.20 This hypothesis also explains
the association between air pollution
and long term risk of heart disease,21
since it proposes that particles cause
inflammation and thus an increase in
the blood of markers such as C reactive
protein and fibrinogen that have been
associated with increased cardiac risk.
Here we propose that this is a consequence of the lung’s evolutionary system of defence against microorganisms.
From a practical point of view, we now
need to explore relations between particle numbers and illness in order to
obtain evidence upon which a number
standard might be considered. For the
moment, however, it seems likely that
in situations such as those in most UK
cities where motor vehicles are the main
source of pollution, measurement of
NO2 is the simplest means of assessing
exposures to particle numbers and,
conveniently for epidemiologists, this
can be done on a personal basis.
Thorax 2003;58:1012–1015
Table 1 Pearson correlation coefficients for the logged daily outdoor concentrations of
NO2, NO, particle numbers, PM2.5 and PM10 in Aberdeen
Particle numbers
PM2.5
PM10
0.86
(n = 115)
0.89
(n = 115)
0.56
(n = 124)
0.45
(n = 121)
0.55
(n = 121)
0.40
(n = 121)
0.39
(n = 117)
0.45
(n = 117)
No of particles ,200 nm diameter
Nitric oxide (NO)
Nitrogen dioxide (NO2)
Each box gives correlation coefficient and number of daily observations. All correlations were
significant at p,0.001.
www.thoraxjnl.com
..................
Authors’ affiliations
A Seaton, M Dennekamp, Department of
Environmental and Occupational Medicine,
University of Aberdeen Medical School,
Foresterhill, Aberdeen AB25 2ZP, UK
Correspondence to: Professor A Seaton,
Department of Environmental and
Occupational Medicine, University of Aberdeen
Medical School, Foresterhill, Aberdeen AB25
2ZP, UK; [email protected]
EDITORIAL
Downloaded from thorax.bmj.com on 21 July 2007
REFERENCES
1 Expert Panel on Air Quality Standards. Nitrogen
dioxide. London: The Stationery Office, 1996.
2 World Health Organization (WHO). Guidelines
for air quality. Geneva: WHO, 1999:29–31.
3 World Health Organization (WHO). Nitrogen
dioxide. In: Air quality guidelines for Europe, 2nd
ed. Copenhagen: WHO, 2000; chapter 7.1.
4 Hasselblad V. Synthesis of environmental
evidence: nitrogen dioxide epidemiology studies.
J Air Waste Manag Assoc 1992;42:662–71.
5 US Environmental Protection Agency (EPA). Air
quality criteria for oxides of nitrogen. Report No
EPA/600/8-91/049aF-cF.3v. Research Triangle
Park, NC: US EPA, 1997.
6 Basu R, Samet JM. A review of the
epidemiological evidence on health effects of
nitrogen dioxide exposure from gas stoves.
J Environ Med 1999;1:173–87.
7 Dennekamp M, Howarth S, Dick CA, et al.
Ultrafine particles and nitrogen oxides generated
by gas and electric cooking. Occup Environ Med
2001;58:511–6.
8 Committee on the Medical Effects of Air
Pollutants. Quantification of the effects of air
pollution on health in the United Kingdom.
London: The Stationery Office, 1998.
1015
9 Watt M, Godden D, Cherrie J, et al. Individual
exposure to particulate air pollution and its
relevance to thresholds for health effects: a study
of traffic wardens. Occup Environ Med
1995;52:790–2.
10 Seaton A, MacNee W, Donaldson K, et al.
Particulate air pollution and acute health effects.
Lancet 1995;345:176–8.
11 Seaton A, Soutar A, Crawford V, et al. Particulate
air pollution and the blood. Thorax
1999;54:1027–32.
12 Brown DM, Wilson MR, MacNee W, et al.
Size-dependent proinflammatory effects of
ultrafine polystyrene particles: a role for surface
area and oxidative stress in the enhanced activity
of ultrafines. Toxicol Appl Pharm
2001;175:191–9.
13 Peters A, Liu E, Verrier RL, et al. Air pollution and
incidence of cardiac arrhythmia. Epidemiology
2000;11:11–7.
14 Le Tertre A, Medina S, Samoli E, et al. Short-term
effects of particulate air pollution on
cardiovascular diseases in eight European cities.
J Epidemiol Community Health 2002;56:773–9.
15 Katsouyanni K, Touloumi G, Samoli E, et al.
Confounding and effect modification in the shortterm effects of ambient particles on total mortality:
Annual report
.......................................................................................
Annual report October 2002 to
September 2003
J A Wedzicha, S L Johnston, D M Mitchell
...................................................................................
has increased, particularly from March
2003, with a total of 1260 submissions
for the 12 months from October 2002 to
30 September 2003, representing an
overall increase of around 33% on the
previous year (tables 1 and 2). The
number of original research articles
submitted to the journal has increased
by a similar amount. We have also seen
an increase in submissions from outside
the UK, especially from North America
and Canada (from 74 in 2001–2 to 126
for the past year) and a doubling in the
number of submissions from Asia
(table 3). The median time to the first
decision on a paper is 38 days. However,
5
4
3
2
1
0
the increased number of submissions
means that our acceptance rate for
original research papers now stands at
only 12.4%.
This year we have published some
important original papers and useful
management guidelines for common
conditions including the new BTS/
SIGN (British Thoracic Society/Scottish
Intercollegiate Guidelines Network)
guidelines for the management of
asthma in February 2003,6 7 BTS guidelines for the management of pulmonary
embolism,8 9 BTS guidelines for the
management of pleural disease,10 and
BTS guidelines on respiratory aspects of
fitness for diving.11 We have also published the Year in Review 2002,12 and have
completed the review series on the
pulmonary physician in critical care,13–17
continued the series on important
aspects of COPD,18–28 and started a series
on lung cancer.29–37
A number of new features have
started in Thorax, primarily aimed at
increasing the educational value of the
journal. Every month we now produce
our Airwaves section at the front of the
journal with short paragraphs highlighting the key messages of some of
Impact factor
I
n January 2003 the Editorship of
Thorax changed and it is with great
privilege and considerable awe and
trepidation that we took over as
Editors.1 Under the editorship of John
Britton and Alan Knox Thorax has
achieved high standards and increased
its impact factor, which now stands at
4.078 (fig 1). Thorax is currently the
most successful European respiratory
journal and the third among all respiratory journals (behind the two American
Thoracic Society publications). The
readership of Thorax, together with the
whole respiratory community, owes an
enormous debt of gratitude to John and
Alan and the previous editorial team for
their outstanding achievement.
With the advent of the new editorial
team, Thorax changed to an online
submission
system
using
Bench.Press.5 Although there were
some initial difficulties with the change
over from a paper based system to
complete online submission, this is
now running very well and authors,
reviewers, and all our editors seem to
have adapted very well to the change.
The number of submissions to Thorax
results within the APHEA2 project. Epidemiology
2001;12:521–31.
16 Spix C, Anderson HR, Schwartz J, et al. Shortterm effects of air pollution on hospital admissions
for respiratory diseases in Europe: a quantitative
summary of APHEA study results. Arch Environ
Health 1998;53:54–64.
17 Donaldson K, Stone V, Seaton A, et al. Ambient
particles and the cardiovascular system: potential
mechanisms. Environ Health Perspect
2001;109(suppl 4):523–7.
18 Peters A, Wichmann H-E, Tuch T, et al.
Respiratory effects are associated with the
number of ultrafine particles. Am J Respir Crit
Care Med 1997;155:1376–83.
19 Wichmann H-E, Spix C, Tuch T, et al. Daily
mortality and fine and ultrafine particles in Erfurt,
Germany part I: role of particle number and
particle mass. Res Rep Health Effects Inst
2000;98:5–86.
20 Schwartz J. Air pollution and blood markers of
cardiovascular risk. Environ Health Perspect
2001;109(suppl 3):405–9.
21 Hoek G, Brunekreef B, Goldbohm S, et al.
Association between mortality and indicators of
air pollution in the Netherlands: a cohort study.
Lancet 2002;360:1203–9.
1996
1997
1998
1999
Year
2000
2001
2002
Figure 1 Thorax impact factor 1996–2002.
www.thoraxjnl.com
Scaricare