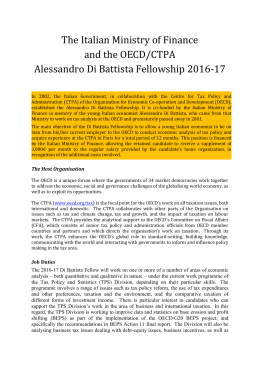
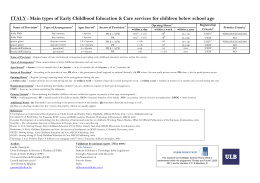
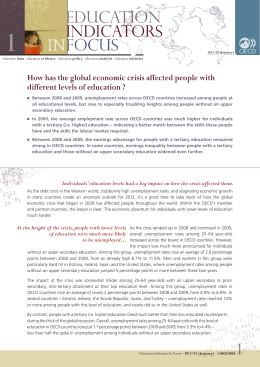
Measuring Innovation in Education Italy Country Note In this country note: Background on the 2014 OECD Measuring Innovation in Education report (p. 1) Key report findings on innovation in education (p. 1) Report approach to measuring educational system innovation (p. 2) Italy’s top five organisational education innovations, 2003-2011 (p. 3) Italy’s top five pedagogic education innovations, 2003-2011 (p. 4) The purpose of the Measuring Innovation in Education report The ability to measure innovation is essential to an improvement strategy in education. Knowing whether, and how much, practices are changing within classrooms and educational organisations, how teachers develop and use their pedagogical resources, and to what extent change can be linked to improvements would provide a substantial increase in the international education knowledge base. The OECD Measuring Innovation in Education report offers new perspectives to address this need for measurement in educational innovation through a comparison of innovation in education to innovation in other sectors, identification of specific innovations across educational systems, and construction of metrics to examine the relationship between educational innovation and changes in educational outcomes. This country brief provides a short overview of the key findings of the report, as well as the top five Italian pedagogic and organisational innovations identified by this report. Key findings on innovation in education – did you know? Overall composite innovation index, 2000-2011 Overall Innovation 40 35 30 25 20 15 10 5 0 MIE Figure 17.1 In education, innovation can take place through either significant changes in the use of a particular educational practice or the emergence of new practices in an educational system. Contrary to common belief, there is a fair level of innovation in the education sector, both relative to other sectors and in absolute terms. Within education, innovation intensity is greatest in higher education, with secondary and primary education approximately equal. Compared to other sectors, knowledge and method innovation is above average in education, product and service innovation is below average, and technology innovation is at the average sectorial level. In Europe, higher education stands out in terms of speed of adopting innovation compared to the economy average as well as the rates in primary and secondary education. 1 Measuring Innovation in Education Italy Country Note There have been large increases in innovative pedagogic practices across all countries studied for this report in areas such as relating lessons to real life, higher order skills, data and text interpretation and personalisation of teaching. In their pedagogic practice, educators have innovated in their use of assessments and in the accessibility and use of support resources for instruction. Educational organisations have innovated in the areas of special education, creation of professional learning communities for teachers, evaluation and analytics and relationship building with external stakeholders, such as parents. In general, countries with greater levels of innovation see increases in certain educational outcomes, including higher (and improving) 8th grade mathematics performance, more equitable learning outcomes across ability and more satisfied teachers. Innovative educational systems generally have higher expenditures than non-innovative systems; however, their students are no more satisfied than those in less innovative systems. Approach to measuring system innovations While Measuring Innovation in Education identifies and analyses hundreds of innovations at the classroom and organisational levels, this brief identifies the top five Italian innovations in pedagogic and organisational practices between 2003 and 2011. To determine each educational system’s top five innovations in pedagogic and organisational practices, data from three international education datasets – Trends in International Mathematics and Science Study (TIMSS), Progress in International Reading Literacy Study (PIRLS), and the Programme on International Student Assessment (PISA) – were analysed to identify the areas in which each education system has demonstrated emerging or changing organisational and pedagogic practices over a specific period. For a full description of the data and methods used for analysis in this report, see report Annex A: Data Sources and Methods. Please cite this publication as: OECD (2014), Measuring Innovation in Education: A New Perspective, Educational Research and Innovation, OECD Publishing. http://dx.doi.org/10.1787/9789264215696-en This work is published under the responsibility of the Secretary-General of the OECD. The opinions expressed and arguments employed herein do not necessarily reflect the official views of OECD member countries. This document and any map included herein are without prejudice to the status of or sovereignty over any territory, to the delimitation of international frontiers and boundaries and to the name of any territory, city or area. © OECD 2014 You can copy, download or print OECD content for your own use, and you can include excerpts from OECD publications, databases and multimedia products in your own documents, presentations, blogs, websites and teaching materials, provided that suitable acknowledgment of OECD as source and copyright owner is given. All requests for commercial use and translation rights should be submitted to [email protected]. Note regarding data from Israel The statistical data for Israel are supplied by and are under the responsibility of the relevant Israeli authorities. The use of such data by the OECD is without prejudice to the status of the Golan Heights, East Jerusalem and Israeli settlements in the West Bank under the terms of international law. Country Note Authors: Dara Fisher [email protected] Stéphan Vincent-Lancrin [email protected] Questions can be directed to: Stéphan Vincent-Lancrin [email protected] 2 Measuring Innovation in Education Italy Country Note Italy’s top five innovations in organisational policy and practice: (1) More use of assessments for national or district benchmarking… Percentage of 15-year old students in schools where assessments are used for comparing school to district or national performance and change over time % 2000 2003 2009 Negative change Positive change OECD (average absolute change) 100 -24 -23 -8 -2 +1 +2 +2 +3 +4 +5 +5 +8 +8 +9 +10 +11 +11 +12 +12 +13 +14 +17 +18 +21 +21 +23 +24 +27 +28 +29 +54 90 80 70 60 50 40 30 20 10 0 % point 55 50 45 40 35 30 25 20 15 10 5 0 MIE Figure 14.1 In recent years, innovation in educational monitoring has resulted in less use of student assessments for between-school comparisons and more use for comparison with district or national benchmarks. In Italy, the proportion of 15-year old students in schools where assessments are used in this manner increased by 13% points between 2000 and 2009, above the OECD average gain of 11% points. (2) More use of assessments for classroom improvement… Italy also demonstrated innovation in the use of student assessments for instructional or curriculum improvement over the period analysed in this report. From 2003 to 2009, the percentage of Italian 15-year olds in schools where assessments are used to identify instructional or curriculum improvement increased from 81.8% to 86.7%, a net change of 4.9% points. (3) More enrichment education in primary schools… Another top organisational innovation in primary schools in Italy is the availability of enrichment education for 4th grade students. While the level of enrichment science provision in Italy saw no significant change between 2003 and 2007, the percentage of 4th grade students in schools that offer enrichment mathematics increased over this period from 24.7% to 30.4%. Despite this gain, Italian schools still underperformed the OECD average for this metric, which was 58.1% of students in 2007. (4) More tracking of secondary achievement data… Between 2006 and 2009, the percentage of 15-year old students in Italy in schools where achievement data is tracked over time by an administrative authority increased by 5% points, from 20.2% to 25.2%. Over this same time period, other OECD countries experienced no significant change in this metric. (5) More peer discussions amongst secondary school teachers… Finally, Italy demonstrated innovation in education through changes in the prevalence of peer discussions amongst secondary school teachers. Between 2003 and 2011, the percentage of Italian 8 th grade mathematics students who have a teacher who discusses with other teachers how to teach a particular topic one or more times per week increased by 5% points; the same metric for science students increased by 6% points. 3 Measuring Innovation in Education Italy Country Note Italy’s top five innovations in pedagogic practice: (1) More relating of academic subjects to everyday life… Percentage of 4th grade science students whose teachers ask them to relate what they learn in class to their daily life in at least half of their lessons and change over time % 100 90 80 70 60 50 40 30 20 10 0 2003 -7 -0 +3 2007 +3 +5 2011 +5 +7 +7 Negative change +8 +8 +9 Positive change OECD (average absolute change) +11 +13 +17 +19 +22 +24 +26 +28 +31 +32 +32 +36 +45 % point 50 45 40 35 30 25 20 15 10 5 0 MIE Figure 6.6 Italy’s top pedagogic innovation is the practice of relating learning to students’ daily life. According to 4th grade teachers, between 2003 and 2011, the percentage of Italian science students whose teachers ask them to relate what they learn in class to their daily lives in their lessons increased by 45% points. This metric for 8th grade students also increased over the same period, with increases by 22% points for science and 31% points for mathematics (as reported by teachers). (2) More use of textbooks as primary resources… Between 2003 and 2011, the percentage of 8th grade science students in Italy whose teachers use textbooks as a primary basis for instruction increased from 63.1% to 78.9%, for a total change of 15.8% points. Similarly, use of textbooks as primary resources also increased in secondary mathematics classes over this same period, with an increase from 10.6% in 2003 to 45.1% in 2011. This change was the largest in this metric for any of the educational systems included in this report. (3) More self-direction in primary reading lessons… Between 2001 and 2011 the percentage of 4th grade students whose teachers give them time to read books of their own choosing at least once a month increased in Italy by 24% points according to teacher reports; however, 4th grade students in Italy reported a 4% point decrease in this metric over the same period. (4) More use of computers as reference resources in primary school science… Italy also saw innovation in the use of computers to look up ideas and information in primary school science classes. Between 2003 and 2011, the percentage of 4th grade science students in Italy using computers to look up ideas and information increased by 9.5% points, from 18.4% to 27.9%. Over this same period, the OECD average net increase was 3.4% points, from 48.2% to 51.6%. (5) More use of computers in primary science experiments… Finally, primary teachers in Italy reported significant increases in the extent to which students use computers to study natural phenomena through simulations in 4th grade science. From 2003 to 2011, the percentage of Italian 4th grade students using computers to analyse data increased by 14% points, a change far above the OECD mean difference of 5% points over the same period. 4
Scaricare