CONSIGLIO
DELL'UNIONE EUROPEA
Bruxelles, 18 dicembre 2007 (11.01.08)
(OR. en)
16714/07
ADD 2
ECOFIN 519
COMPET 442
SOC 543
ENV 721
EDUC 224
RECH 433
ENER 326
NOTA DI TRASMISSIONE
Origine:
Signor Jordi AYET PUIGARNAU, Direttore, per conto del Segretario
Generale della Commissione europea
Data:
17 dicembre 2007
Destinatario:
Signor Javier SOLANA, Segretario Generale/Alto Rappresentante
Comunicazione
della Commissione al Consiglio europeo
Oggetto:
Relazione strategica sulla strategia di Lisbona rinnovata per la crescita e
l'occupazione: il nuovo ciclo (2008-2010) - Documento di accompagnamento
(Parte III/V)
Si trasmette in allegato, per le delegazioni, il documento della Commissione COM(2007) 803
definitivo (Parte III).
________________
All.: COM(2007) 803 definitivo (Parte III)
16714/07 ADD 2
sv
DG G I
IT
COMMISSION OF THE EUROPEAN COMMUNITIES
Brussels, 11.12.2007
COM(2007) 803 final
PART III
COMMUNICATION FROM THE COMMISSION TO THE EUROPEAN COUNCIL
Strategic report on the renewed Lisbon strategy for growth and jobs: launching the new
cycle (2008-2010)
Companion document
EN
EN
TABLE OF CONTENTS
I. Macro-economic part ........................................................................................................... 5
Summary and conclusions.......................................................................................................... 5
1.
Economic performance during the 1st Lisbon cycle (2005-07) and prospects for the
2nd cycle (2008-10)....................................................................................................... 7
2.
Assessing progress with reforms that contribute to macroeconomic stability........... 14
II. Micro-economic part......................................................................................................... 27
Summary and conclusions........................................................................................................ 27
1.
Economic effects of microeconomic reforms ............................................................ 29
2.
Three years in the new reform agenda: an assessment of progress by policy area.... 30
3.
Implementing priorities for action ............................................................................. 48
III. The Commission Draft of the Joint Employment Report 2007/8................................ 51
Summary and conclusions........................................................................................................ 51
1.
Progress in achieving the objectives of the European Employment Strategy............ 52
2.
Implementing priorities for action ............................................................................. 55
IV. THE GENERAL APPROACH USED BY THE EUROPEAN COMMISSION TO
ASSESS PROGRESS WITH STRUCTURAL REFORMS................................. 63
V. THE EUROPEAN GROWTH INITIATIVE ................................................................. 65
EN
1.
The improved framework for investment – Preliminary results ................................ 66
2.
The Growth Initiative within the Lisbon Strategy for Growth and Jobs.................... 68
2
EN
INTRODUCTION
In March 2005, the Lisbon strategy was re-launched placing growth and jobs at the top of
European political priorities. This focus stemmed from the recognition that economic growth
in Europe had been disappointing relative to the most dynamic economies in the world, and
that the Union faced major challenges in coping with globalisation and ageing populations.
Euro area countries faced the additional challenge of improving the capacity of their
economies to adjust to economic shocks in the absence of national monetary or exchange rate
policies.
The re-launched Lisbon strategy provides a comprehensive framework for reform efforts to
raise growth and jobs potential, encompassing measures which promote macroeconomic
stability, increase labour utilisation and enhance labour productivity: The Lisbon strategy
places considerable emphasis innovation and promoting a knowledge-based economy,
through policies which enhance market entry and flexibility, plus higher investment in
education, training and R&D.
The end of the revised strategy's first-three year cycle is an appropriate moment to draw some
conclusions about how well it is succeeding. Europe's economic situation has improved
considerably since the Lisbon Strategy was re-launched in 2005, although recent months have
witnessed growing downside risks. Average annual real GDP growth since 2005 has been
2.6%. Growth has been increasingly driven by domestic demand, leaving Europe better placed
to cope with adverse external shocks. Budget deficits have been reduced from 2.5% of GDP
in 2005 to a forecasted 1.1% in 2007, whilst public debt has declined from 62.7% in 2005 to
just below 60% in 2007. Almost 6.5 million extra jobs have been created in EU27 in the last
two years, with 5 million more projected to be created by 2009. Unemployment is expected to
fall below 7%, the lowest level since the mid-80s. For the first time in a decade, robust
employment increases have gone hand in hand with robust productivity growth. In some
Member States, improving growth conditions have been accompanied by a gradual build-up
of imbalances with signs of overheating, as witnessed by large current account deficits, a loss
of competitiveness, increasing household indebtedness and rapidly increasing house prices.
The business environment has benefited from a series of structural reforms. The EU’s better
regulation agenda is gradually being put into place, although many Member States still need
to implement the necessary instruments, including impact assessments and methods to
measure and reduce administrative burdens. It is now much easier and cheaper to start a
business in almost all Member States. Europe, as a whole, however does not yet have a
dynamic, entrepreneurial culture. Too often, efforts to improve the business environment are
made in a piecemeal way as opposed to being part of an integrated approach geared towards
the growth of SMEs. Whilst Member States have set targets committing themselves to
significantly increasing R&D investments which would help the EU approach its 3% of GDP
target by 2010, the evidence does not yet reflect this ambition. The EU has made the first
steps towards transforming itself into a low carbon society. There is progress in meeting the
overall EU Kyoto target and at the Spring 2007 European Council the EU committed itself to
ambitious targets for greenhouse gas reduction and increasing the share of renewable energies
by 2020.
In some countries, unfortunately, reform seems to be slowing down. However, it is imperative
that reforms continue. Most Member States still lag behind leading economies, for example in
labour utilisation and labour productivity, and the challenges of globalisation and population
EN
3
EN
ageing will continue into the next decades. Moreover, structural reforms will not only help
enhance growth and jobs potential over the medium-run, they also play an essential role
helping economies adjust and cope with the shocks and pressures that sparked the recent
financial turmoil and heightened economic uncertainty.
A crucial question on the threshold of a new three-year Lisbon cycle is what part structural
reforms played in the improved economic performance. Commission analysis has found
evidence of structural improvement in the functioning of labour markets. In particular,
sustained increases in the employment rates of women and older workers seem partially due
to previously enacted policy reforms. The trend decline in productivity growth that entrenched
itself in the early 1990s seems to have halted in recent years; since mid-2005, labour
productivity growth has accelerated.
This Companion Document accompanies the Strategic report on the renewed Lisbon strategy
for growth and jobs: launching the new three-year-cycle. It aims at providing further detail on
the underlying rationale for carrying out coordinated policy reforms. It also takes stock of the
main developments in policy reform since the re-launch of the Lisbon strategy in 2005.
The paper is divided in five sections. The first, second, and third sections take stock of the
main progress, in terms of policy reforms, in the macroeconomic, microeconomic and
employment pillars of the Lisbon strategy. The fourth section outlines the Commission's
methodology in assessing structural reforms and the Implementation Reports. The fifth
provides a mid-term evaluation of the European Growth Initiative.
EN
4
EN
I. MACRO-ECONOMIC PART
Summary and conclusions
Overall, over the period 2005-2007, there has been some progress with macro economic
reforms, although the pace has slowed in the last 12 months.
Consolidation of public finances has advanced, though it remains a challenge in several
Member States. The nominal EU27 budget deficit was 2.5 % of GDP in 2005 and it is forecast
to drop to 1.1 % in 2007. This mainly reflects reduced government expenditures (as a share of
GDP), although revenues (as a share of GDP) have increased. At the start of 2006, twelve
countries were in excessive deficit, but only six by end-2007. However, fiscal adjustment
seems to have slowed somewhat in the last year; the opportunity to use relatively strong
growth conditions to reduce structural deficits by the 0.5% of GDP benchmark in the Stability
and Growth Pact (applicable to euro area and ERM II countries) has not been fully taken in all
Member States. Indeed, most countries still have some way to go to achieve medium-term
budgetary positions that would allow the budget to fully play its stabilising role.
Stability-oriented policies have made some positive contributions. Headline inflation in the
EU27 has hovered just above 2% over the last 3 years and is expected to remain at this level.
However, in some Member States, improving economic growth has been coupled with a
gradual build-up of imbalances with large current account deficits and signs of overheating:
poor competitiveness developments, increasing household indebtedness and rising house
prices. There is therefore a strong case for macro-economic policies to restrain demand in
several Member States as well as further reforms to improve adjustment capacity to shocks
and the functioning of the supply side of the economy.
The significant challenge in most countries of keeping intact the long-term sustainability of
public finances and the urgency takeoff taking additional measures has increased. At the same
time, better budgetary positions and several important pension and health care reforms in
some countries have improved the situation in the last few years. The EU27 debt/GDP ratio
has declined, from 63 % of GDP in 2005 to just below 60 % in 2007. Pressing ahead with
ambitious reform plans and avoiding damaging policy reversals is important.
A primary EU policy objective is to bring more of the working age population into work.
Policies need to support wages developing in line with productivity so as to achieve high
employment and contain inflation. In the aggregate, wage moderation has continued to
support price stability over the period 2005-2007, including the last 12 months, despite a
tightening labour market and the closing of output gaps. However, the situation varies across
countries. Within countries, across sectors and regions only partial progress has been made to
make wage dispersion reflect productivity differentials.
It is important to continue with policies that improve incentives to become employed. Several
Member States have indeed taken measures to improve incentives to work, from reforms in
the benefit system (both levels of benefits and availability criteria) to labour taxation.
However, less has been done to relax employment protection legislation. While many
countries have taken measures that go in the right direction, the overall impact is relatively
limited in many cases and thus there is a need to further pursue such strategies along the
EN
5
EN
principles of flexicurity. A challenge is how to lower labour taxes without endangering fiscal
consolidation.
This part of the annex focuses on the Integrated Guidelines package that addresses policies to
ensure a stable and sustainable macroeconomic environment. A first section takes a closer
look at economic developments during the three years of the 1st Lisbon cycle (2005 to 2008).
It examines whether the economic upturn is cyclical (transitory) or structural (potentially due
to the positive impact of past structural reforms) in nature. It also considers the reform agenda
facing the EU for the next three year cycle (2008-2010) in the face of challenges resulting
from globalisation and ageing populations, as well as the urgent need to address climate
change. A second part of the annex reviews progress with structural reforms in several key
macroeconomic domains, with a particular emphasis placed on reform efforts over the past
year.
EN
6
EN
1.
ECONOMIC
PERFORMANCE DURING THE
ND
PROSPECTS FOR THE 2 CYCLE (2008-10)
1ST LISBON
CYCLE
(2005-07)
AND
Economic performance has improved since 2005
Economic performances have improved considerably since the re-launch of the
Lisbon Strategy in 2005. Economic growth was 3.0% in the EU27 in 2006 compared
with 1.8% in 2005, and is forecast to remain at 2.9% and 2.4% in 2007 and 2008.
Thirteen million jobs have been created since 2000, and more than half of that after
2005, and unemployment has fallen steeply from 8.6% to 6.9% over the 2005-2007
period. An especially welcome development is that for the first time since 1997, job
creation and productivity improvements have occurred simultaneously1. As a result
of the improved growth performance, the Commission estimates the output gap is
merely -0.1 p.p. % in 2007 compared with 1 p.p. negative gap in 2005. Moreover, the
gap in GDP per capita with the US has closed slightly, from 65.4% of the US-level
for EU-27 and 72.1% in the euro area in 2005 to 67.1% and 73.5% respectively in
2007. Although it is difficult to disentangle the impact of cyclical and structural
factors on growth, it is an encouraging sign that the Commission's calculations
suggest that potential GDP growth, i.e. net of cyclical factors, has improved from
2.3% in 2005 to 2.5% in 2007 for the EU-27, and from 2.0 to 2.2% for the euro area.
The three Baltic states, Slovakia, Slovenia and the Czech Republic have experienced
an especially rapid convergence. The recovery has also spread to EU15 countries,
most remarkably to Germany, which seems to have overcome its role as growth
laggard in the EU.
In addition to higher growth rates, the composition of growth has become more
favourable to domestic drivers over time, which bodes well for increased resilience
to adverse external factors. As shown in Table 1, the contribution to growth of fixed
capital investment had been particularly weak in the first half of the decade. Since
2005, it has strengthened, returning to growth rates comparable to the ones observed
in the late 1990s which raise hopes that firms' higher investment, through the
diffusion of technological progress, translates into higher productivity growth.
Though private consumption contributed less to growth in 2005-2007 than in the late
1990s, an upward shift in the contribution of private consumption spending is now
clearly evident from the data on consumer expenditures as well as from the recovery
in consumer confidence underpinned by the declining rates of unemployment.
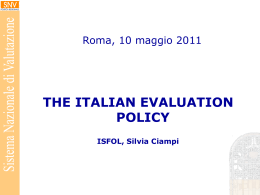
Moreover, as can be seen from a more detailed breakdown of the growth
performance (Graph 1) productivity gains accounted for more than half of the
average economic growth recorded in EU27 2005-2007, with labour inputs
accounting for the remaining part. Labour inputs benefited from net migration, and to
a lower extent an increasing native population, while the rise in participation rates,
especially of women and older workers, was partly offset by the decline in average
hours worked per person employed and the decline in youth participation. As regards
1
A recent Commission publication entitled Moving Europe's productivity frontier reviews different
explanations of the trade-off between productivity and employment growth and provides an empirical
assessment of the size of this trade-off and of how it has been changing over time, see the EU Economy
2007 Review:
http://ec.europa.eu/economy_finance/publications/european_economy/2007/the_eu_economy_review2007_en.htm
EN
7
EN
labour productivity, technical progress appears to have been a stronger driving force
than capital accumulation and rise of labour initial education. Compared to the 20002004 period a key difference is the positive contribution to growth from the reduction
in unemployment rates, which should be partly attributed to the cyclical recovery.
Due to sound economic fundaments, most Member States are in a good position to
withstand the strains from the financial turbulence witnessed in summer 2007.
According to the autumn 2007 forecast of the European Commission2, growth in the
EU-27 is predicted to be 2.9% in 2007 and 2.4% in 2008. For a few Member States
(LV, LT, EE), however, accumulated macroeconomic imbalances such as high
inflation, large current account deficits and excess housing price increases bear
important risks in the current juncture. Also in BG and RO, external deficits are large
and inflation high. In other countries such as EL, ES and PT deteriorating economic
growth is likely to jeopardise the sustainability of competitiveness, foreign debt or
households' indebtedness. Such countries need to closely survey financial stability
and, in case of a further widening of the external deficit, vigorous structural reforms
to restore cost competitiveness.
Table 1. Economic developments 2000-2009, key figures, EU27
2000-04
2005-2007
2007
2008-09
GDP growth
2.2
2.6
2.9
2.4
Consumption growth
2.2
2.0
2.2
2.2
Investment growth
1.6
4.8
5.6
3.4
Employment growth
0.9
1.4
1.6
1.0
Unemployment rate (% labour force)
8.8
8.1
7.1
6.7
Inflation rate
2.7
2.3
2.3
2.3
Government balance (% of GDP)
-1.8
-1.7
-1.1
-1.1
Government debt (% of GDP)
61.5
61.4
59.7
57.8
Current Account (% of GDP)
0.0
-0.6
-0.8
-0.9
Source: Commission Autumn Forecast
2
EN
See the 2007 Autumn Economic Forecast of the European Commission,
http://ec.europa.eu/economy_finance/publications/european_economy/forecasts_en.htm
8
EN
Graph 1. Real GDP growth and its components in EU27, 2000-2004 and 2005-2007
EU-27 , 2000-2004
2.5%
Labour productivity
Labour input
2.0%
1.5%
1.0%
0.5%
0.0%
-0.5%
-1.0%
Real
Total
Capital
Initial
Average
Native
Net
GDP
Factor
Deepening
education
Hours
Population
Migration
of labour
Worked
Productivity
Share of
Youth
Working age Participation
Population
25-54
25-54
55-64
Unemploy
Male
Female
Participation
ment
Participation
Participation
Rate
EU-27 , 2005-2007
3.0%
Labour productivity
Labour input
2.5%
2.0%
1.5%
1.0%
0.5%
0.0%
-0.5%
Real
Total
Capital
Initial
Average
Native
Net
Share of
Youth
25-54
25-54
55-64
Unemploy
GDP
Factor
Deepening
education
Hours
Population
Migration
Working age
Participation
Male
Female
Participation
ment
of labour
Worked
Participation
Participation
Productivity
Population
Rate
Are past reforms starting to pay dividends?
One of most important questions as the EU enters a new three-year Lisbon cycle is
whether the improved economic performance is in part due to the effects of structural
EN
9
EN
reforms. Establishing a causal link between the progresses made in the Lisbon
agenda and economic performance is not straightforward. This is because the
observed changes in economic variables can be due to several factors, some of which
are beyond the direct or immediate influence of government policies, e.g. the
economic cycle, globalisation, technological developments and demographic
changes. Also, analysis suggests that reforms need a considerable time before their
benefits become visible in growth numbers, and thus relevant reforms may pre-date
the revision of the Lisbon strategy. Moreover, it is difficult to establish the extent the
new Lisbon governance structures have contributed to overcome reform resistance in
individual Member States, as many reforms have a clear domestic rationale and
governments may have undertaken them independently of co-ordination efforts at
EU level.
EN
10
EN
Graph 2: Employment and labour productivity growth, actual and structural, 1997-2009
Actual and Structural unemployment, EU27
11
Unemployment
NAWRU
% of labour force
10
9
8
7
6
5
1997 1998 1999 2000 2001 2002 2003 2004 2005 2006 2007 2008 2009
Labour Productivity, actual and trend, EU27
3.0
Annual change
2.5
2.0
1.5
1.0
0.5
1997 1998 1999 2000 2001 2002 2003 2004 2005 2006 2007 2008 2009
Notwithstanding the caveats mentioned above, analysis by the Commission suggests
that, there is a structural component linked to past structural reforms enacted by EU
Member States and in a number of policy areas there are a visible EU level
dimension which is expressed through common targets and actions.
EN
11
EN
There is evidence of structural improvement in the functioning of labour markets3.
As regards labour utilisation, employment grew by more than 1% each year since
2005, leading to almost 6.5 million new jobs in the EU by 2007. Although sustained
efforts will be required to bring the employment rate of 70% by 2010 closer, female
employment rates have increased from 54% in 2000 to 56% in 2005 to about 58%4 in
2007, and the Lisbon employment target of 60% is within reach. There has also been
a substantive increase in the employment rates of older workers (aged 55 to 64) from
37% in 2000 to 42% in 2005 and 44%4 in 2007. Moreover, the effective retirement
age has increase by 1 year between 2001 and 2005, which is welcome reversal of
long standing historical trends. Analysis suggests that part of this is due to lagged
effects of pension reforms: preliminary econometric estimates5 suggest that the
participation rates of older workers (55-64) increased by about 1.5 percentage point
after 5 years that a pension reform has been enacted.
Employment has not increased on average in the group of low-skilled workers, with
the employment rate being around 55% over the 2000-2006 period. Given the fact
that this labour market segment performs rather badly in comparison to other skill
groups (employment rates of medium- and highly-skilled workers stand at around
73% and 84% respectively) many Member States have nevertheless focused their
policies in this direction. In particular, there has been a general trend towards
reducing the tax burden for low skilled workers. As a result, there has been a drop in
the total tax wedge (including social security contributions by employees and
employers) for the low-skilled workers of almost 4 percent over the period 2000 to
20066.
Further evidence of ongoing structural improvements in the functioning of labour
markets emerges from an analysis of unemployment rates. The rate of unemployment
declined from 8.7% in 2005 to 6.9 % in 2007. This is in stark contrast to previous
economic cycles when unemployment rates increased sharply and took a long time to
decline: it not only contributes to economic growth, but is equally important for
equity and welfare considerations as having a job is the single most important factor
in avoiding poverty and social exclusion. When only cyclical forces are at work, the
reduction in unemployment typically leaves a clear trace in higher wage growth. In
the current upturn, wage growth has hardly accelerated, implying also reduction in
the structural rate of unemployment. Structural unemployment, captured as the nonaccelerating wage rate of unemployment, NAWRU, is estimated to have been
reduced from 8.2% in 2005 to 7.4% in 2007. Similar calculations suggest that the
reforms between 2001 and 2006 that aimed at increasing the employability of
marginally attached people increased employment rates by 0.8 percentage points one
year after the reforms were enacted.
3
4
5
6
EN
For an encompassing description on EU labour market and wage developments See report "Labour
market and wage development in 2006", European Economy no.4, 2007,
http://ec.europa.eu/economy_finance/publications/european_economy/labour_mkt_wage2007_en.htm
2007 estimate based on the average of data for the first two quarters.
Arpaia, A.F. Pierini and P. Braila "Tracking labour market reforms in the European union using the
LABREF database" paper presented at the IZA-Fondazione Rodolfo Debenedetti Workshop
"Measurement of Labour Market Institutions".
Based on EuroStat data on single earner without children (EU27 minus CY, EE, MT, LV, SI, BG, RO)
and OECD Working paper (2004-5) on 2004 distribution on family types and earning levels for selected
countries.
12
EN
Positively, since mid-2005 productivity growth in the EU has picked up. Labour
productivity growth is estimated at 1.4% in EU-27 in 2007, slightly lower than the
1.5% in 2006 but better than the 1.0% recorded in 2005. An additional positive
feature of this is that in 2006, rising employment took place in an environment of
accelerating productivity growth: this was the first time since 1997 that both
employment and labour productivity accelerated in tandem. Indeed, a central policy
goal of the Lisbon strategy is higher structural labour productivity growth given the
need to close the gap in the productivity performance vis-à-vis the USA that emerged
since mid 1990s. For now, however, it is early to assess whether the welcome
acceleration in productivity growth is not only due to cyclical factors, but also linked
to structural improvements. .
Aggregated data suggest that the trend decline in productivity growth, which has
become entrenched since the early 1990s, has come to a halt in the last years. While
statistical tests broadly confirm the bottoming out of the decline in trend productivity
growth at the start of this decade, evidence of a turning point beyond that date
indicating a recent pick-up in trend productivity growth remain weak.
The challenges for the 2nd Lisbon cycle, 2008-10
The Lisbon strategy is now entering a new three year cycle to cover the period 2008
to 2010. Notwithstanding the progress made since 2005, the diagnosis of the
underlying structural challenges facing the Union as regards growth and jobs remains
valid. As illustrated in Graph 4, large income per-capita gaps remain across
countries. In 2007, based on the Commission Autumn forecast figures, the average
per capita GDP of the EU27 was 10% below that of EU15 (and 33% below that of
the US). For EU15 and euro area countries, the gap is mainly due to lower labour
utilisation (i.e. the numbers of hours worked in the economy), whereas lower labour
productivity (measured in terms of output per hour) is the main explanatory factor for
Member States which joined in 2004 and 2007. The final column in Graph 3
indicates that over the 2005-2007 period, EU10 countries in particular have further
narrowed the income gap benefiting from the process of real convergence. However,
progress has been mixed, with some larger euro area countries doing less well.
These challenges may indeed become even more pertinent in the coming years as
short- and long-term pressures become more explicit. In the short term, based on the
Commission autumn forecast, the outlook for 2008-2009 indicates (see Table 1) a
slow-down in growth albeit moderate, towards potential rates at around 2.5% per
year. The projected slowdown mainly finds its roots in a slower forecasted pace of
investment growth, while employment growth is also forecasted to decelerate (even
though unemployment rates will continue to decline somewhat). In the longer term,
pressures both from demographics and increased international competition are set to
strengthen:
• projections indicate that in the coming decades potential GDP growth rates is set
to gradually decline and to reach, by 2050, levels of about half of today's7. This
7
EN
See "Long-term labour productivity and GDP projections for the EU25 Member States: a production
function framework", European Economy, Economic Papers, No 253, June 2006,
http://ec.europa.eu/economy_finance/publications/economic_papers/2006/economicpapers253_en.htm
13
EN
downward trend results from the future negative contributions to growth from the
working age population due to demographic factors, leaving labour productivity
as the key growth driver. The implication is that reform efforts contributing to an
increase in labour productivity rates will become increasingly important over
time;
• the trend towards increased competition through globalisation is set to continue.
While deeper international trade links is expected to be beneficial for growth and
employment in the aggregate, it will nevertheless risk in the short term to increase
pressures on certain groups of the labour force and thus require a high degree of
adaptability for a successful response8.
Graph 3: Overview of the income gap in the EU25 Member States
Percentage gap with respect to
EU-15 GDP per capita
Effect of labour
resource utilisation
(Hours worked per capita)
Effect of labour
productivity
(GDP per hour worked)
Change in gap
2005 - 2007
Luxembourg
Ireland
Sweden
Denmark
Finland
Austria
Netherlands
United Kingdom
Belgium
France
Germany
Euro area
Italy
EU-25
EU-27
Spain
Greece
Slovenia
Cyprus
Czech Republic
Portugal
Malta
Estonia
Hungary
Slovak Republic
EU-10
Latvia
Lithuania
Poland
Bulgaria
EU-2
Romania
-80
-60
-40 -20
0
20
40
60
80
100 120 140
-80
-60
-40
-20
0
20
40
60
80
100
-80
-60
-40
-20
0
20
40
60
80
100
-10
-5
0
5
10
15
20
Note: the gap is measures relative to the average of EU15 Member States
2.
ASSESSING PROGRESS WITH REFORMS THAT CONTRIBUTE TO MACROECONOMIC
STABILITY
2.1.
Securing economic stability for sustainable growth
Macroeconomic stability is a key framework condition for sustainable growth as
expressed in Integrated Guideline N°1. Macroeconomic stability is secured by a
8
For an extensive analysis of globalisations by the Commission, see 'Rising international economic
integration: opportunities and challenges', in the EU Economy: 2005 Review",
http://ec.europa.eu/economy_finance/publications/european_economy/the_eu_economy_review2005_en.htm
EN
14
EN
sound mix of stability-oriented macro-economic measures and well designed
structural reforms in product and factor markets. Monetary policy contributes by
pursuing price stability. Sound budgetary positions allow the full and symmetric play
of the budgetary stabilisers over the cycle. Fiscal restraint, effective financial
supervision and the promotion of competitiveness help to contain external and
internal imbalances. Moreover, budgetary and wage restraint limit the risk of
domestic demand causing persistently higher inflation, potentially causing swings in
real exchange rates and a protracted loss of competitiveness. Against this
background, to assess how countries fare, and have made progress, in terms of
macro-economic stability and budgetary policies, it is useful to look at budgetary
positions, the fiscal stance and the extent to which medium-term budgetary positions
provide enough safety margins to allow automatic stabilisers to play freely.
Similarly, when looking at possible emerging macroeconomic imbalances it is
relevant to examine external balances of countries together with domestic
inflationary pressures, wage and labour market developments as well as asset price
developments.
Over the 2005-2007 period, the consolidation of public finances has moved forward,
even if further consolidation remains a challenge in several countries. The EU27
nominal budget deficit has been reduced from 2.5 % of GDP in 2005 to 1.1 % in
2007. According to the Commission forecast, on a "no policy change assumption", it
is expected to remain at this level over the coming two years. The same trend is also
reflected in structural budget positions which for 2007 are estimated to be -1.1% of
GDP in EU27 and -0.7% of GDP in the euro area. This improvement is mainly
driven by a reduction in government expenditures to GDP, although revenues as a
share of GDP have also increased. At the start of 2006 twelve countries found
themselves in a position of excessive deficit while at the end of 2007 only six
countries are still there (CZ, HU, IT, PL, PT, SK). However, the pace of fiscal
adjustment seems to have been reduced somewhat in the last year, and the
opportunity to use the relatively strong growth conditions to reduce structural deficits
by the 0.5% of GDP benchmark in the Stability and Growth Pact have not been fully
taken in all Member States (applicable to euro area and ERM II countries).
Moreover, a majority of countries still have some way to go to achieve medium-term
budgetary positions that allows the budget to play fully its stabilising role9.
Headline inflation in EU-27 has hovered just above 2% over the 2005-2007 period.
In 2007, favourable energy-price base effects have contributed to reduce inflation.
However, core inflation has continued to drift upwards and reached in 2007 levels
close to 2%. This confirms on the one hand that a more mature cyclical position of
the economy has been reached but on the other hand it also reflects some
administrative measures (such as the VAT increase in DE) and strong increases in
commodity prices. Service inflation continues to run at a relatively high rate. In the
euro area, inflation in 2007 stood at 2%, somewhat lower than in 2006. The inflation
differential between the three countries with highest inflation (IE, EL, SI) in the euro
area and the three with lowest inflation (F, MT, FI) was 1.7%-points, similar to 2006.
9
EN
See the report "Public Finances in EMU-2007", European Economy No 3, 2007.
15
EN
In 2007, five countries are projected to record an external deficit of at least 10% of
GDP (LV, LT, EE, BG, RO). These countries display signs of overheating,
characterised by excess aggregate demand evidenced by labour shortages, rapid
increases in household borrowing, inflationary pressures and very high external
imbalances. Among other Member States, EL, ES and PT have in 2007 external
deficits between 8 and 10% of GDP; their external deficits owe mainly to structurally
poor competitiveness, although robust growth in Greece and Spain is also a factor. In
two other countries, HU and SK, the current account deficit was of a similar
magnitude in recent years but has been on a declining trend, with the deficit expected
to reach between 3 and 4% of GDP in 2007. It should be noted that in a catching-up
country, even a widening external deficit need not be a cause for concern if there is a
concomitant rise in productive potential in tradable goods and services and thus in
the future export earnings generating capacity sufficient to service the external debt.
However, to the extent that the widening external deficit reflects unrealistically
optimistic expectations regarding future growth reflected in an excessively rapid
increase in expenditure relative to income, an attitude of caution is warranted.
EN
16
EN
2.2.
Safe-guarding economic and fiscal sustainability
Europe’s ageing population poses a serious challenge to the long-term financial
sustainability in EU countries, which is recognised in Integrated Guideline N°2. In
the absence of appropriate reforms, this could lead to increasing debt burdens, lower
potential output per capita due to the reduction in the working age population, and
pressure for significant increases in public spending on pensions and health care. The
economic, budgetary and social implications of ageing populations can be addressed
by pursuing a three-pronged strategy, that encompasses an appropriate mix of
policies to reduce debt at a fast pace, to raise employment rates especially amongst
older workers (so that working lives are extended), and to reform pension and health
care systems. Reforms to social protection need to be well designed so as to ensure
that they are financially viable in the face of the population ageing and uncertain
economic developments, while ensuring that social protection systems fulfil their
goals in terms of access and adequacy.
In this context, when assessing how Member State's fare and have made progress in
this regard it is relevant to look at debt and deficit developments and to what extent
there has been consolidation efforts bringing medium-term budgetary positions in
line with the medium-term budgetary objectives (MTO) within the Stability and
Growth Pact. This should also take into account the projections of age related
expenditures, carried out or planned reforms to pension and health care systems and
how these are integrated in an overall assessment of budgetary sustainability.
In the EU over the 2005-2007 Lisbon cycle, some progress has been made to ensure
sustainable public finances, although progress has been mixed across countries. The
debt/GDP ratio has declined in EU27 over the 2005-2007 period, from 63 % of GDP
in 2005 to just below 60 % in 2007. In the euro area, the debt ratio has been reduced
from 70.4 % of GDP to 66.7% over the same period. The debt ratio both in Greece
and Italy remains above 100% of GDP and in Belgium debt is close to 85% of GDP.
Taking into account also projections of age related expenditures, a number of
countries remains at what can be called high risk (CZ, EL, CY, HU, PT, SI). A
number of countries progressed with the implementation of pension reforms. Rather
comprehensive measures to reform the pension system have been conducted in recent
years in some countries, in particular MT and PT.
Recently, additional measures, albeit at a lower scale, was introduced in some
countries including progressing with on-going reforms (BE, DE, PL, UK). In other
countries, where reforms are most needed, progress have been limited (EL, IT, CY,
HU, SI). Health care measures were on the policy agenda in a number of countries
(DE, CY, MT, LV, RO). In particular, in 2005 and 2006 progress has been shown in
terms of increasing the participation rates for older workers which had increased by
more than 3% over 2005-2006 in several countries (DE, EE, IE, CY, LV, AT, SI,
SK, FI).
Overall, budgetary positions have improved since 2005, and there have been reforms
to pension and health care systems in some countries. Nonetheless, important risks to
the sustainability of public finances remain in many countries, and there is a need to
press ahead with reform efforts, not least the effects of ageing on the size of the
EN
17
EN
working-age population will become more pronounced in the next three-year Lisbon
cycle.
EN
18
EN
2.3.
Ensuring that wage developments contribute to stability and growth.
Appropriate wage developments contribute to macro-economic stability and growth,
highlighted in Integrated Guideline N°4. Provided that real wage increases are in line
with the underlying rate of productivity growth over the medium term, they
contribute to stable macroeconomic conditions and an employment friendly policy
mix10. Variation in productivity caused by cyclical factors, or one off changes in the
headline rate, should not cause an unsustainable shift in wage growth. In addition,
relative wage developments that reflect local or sectoral labour market conditions
help adaptability and counteract regional disparities. In this area, when assessing how
countries fare and have made progress, it is necessary to examine wages and
productivity developments, i.e. what this implies in terms of nominal unit labour
costs (NULC) and to assess whether the latter are in line with price stability and
competitiveness. It is also useful to look at real unit labour costs (RULC) and how
these relate to labour market developments. Moreover, to the extent that regional
unemployment is a serious problem, wage developments and measures that improve
the adaptability to local conditions is relevant. Overall, the absence of wage pressure
in the euro area and EU27 during the economic rebound has been a positive feature
over the last few years. Wage moderation in the euro area and EU27 as seen in
nominal and real unit labour costs has generally continued to support price stability
over the 2005-2007 period, including the last 12 months, despite a tightening labour
market and the closing of output gaps. In 2007, the annual growth rate in
compensation per employee is forecast at 3.0% in EU27 and 2.5% in the euro area
while the increase in labour productivity is 1.4% and 1.1% respectively. This implies
that nominal unit labour costs increase by 1.7% in EU27 and 1.4% in the euro area
which is somewhat higher than in 2005-2006 but in the aggregate remains in line
with price stability objectives. More evidence of wage restraint in the face of
stronger international competition is that real unit labour cost decreased by roughly
1% in 2006 and 2007, both in the euro area and in the EU as a whole. However, this
may also reflect other structural factors, such as a gradual reallocation of value added
towards sectors with a lower share of labour.
However, this overall assessment of favourable aggregate behaviour conceals
sizeable differences between countries, with fairly divergent growth rates in nominal
unit labour costs contributing to differing patterns in competitiveness and widening
current account imbalances among EU members. At Member State level, two aspects
warrant further attention:
• The catch-up process has triggered very high nominal wage growth, in excess of
relatively high labour productivity, which has lead to deteriorating price
competitiveness. This is particularly notable in EE, LT, LV, RO and BG (see also
see section 3 on macro-economic stability where this is put in the context of
external imbalances). Also, real unit labour costs have increased markedly over
the last few years in EE, LV, RO and in 2007 in BG. Nevertheless, this has been
coupled with above average employment growth and falling unemployment.
10
EN
Provided that they are also consistent with a rate of profitability allowing for productivity, capacity and
employment-enhancing investments.
19
EN
However, in HU increasing unit labour costs have been coupled with weak labour
market developments.
• Wages adjust slowly over time to changing cyclical conditions, especially in some
countries of the euro area, which means a long-lasting impact of shocks on
economic activity. Indeed, the experience with adjustment to shocks in the early
years of the euro area calls for flexibility despite a general background of marked
wage moderation11. While wage moderation has been supportive of price stability
in the aggregate, the continuously high-rates of long-term unemployment and the
persistence of regional differences in employment performance suggest that there
may be some lack of wage differentiation in some Member States (BE, DE, IT).
Progress in terms of wage dispersion that reflects productivity differentials across
sectors and regions has only been partial even though in some countries wage
bargaining outcomes that better reflect local conditions can be observed.
Additional flexibility seems however to have been achieved as regards working
time organisation and greater opt-outs from collective agreements (AT, FR, DE,
IE, NL, ES).
11
EN
See the "EU Economic review: 2006" which investigates how adjustment has been proceeding in the
euro area and how the efficiency of adjustment could be improved. European Economy No 6, 2006.
20
EN
2.4.
Policies to make work pay
Policies to improve the financial incentives to work are largely recognised as being a
key element of that comprehensive set of measures (macro, micro and employment),
which is most needed to raise labour utilisation, and therefore contribute to the
general objectives of the Growth and Jobs strategy (see in particular Integrated
Guideline N°5). Improving the adaptability and adjustment capacity of economies
helps respond to changes in both cyclical economic conditions and longer term
trends such as globalisation and technology. In this regard, policies to "make-work
pay" are particularly pertinent as they aim to attract more people into the labour
market and to make the underlying incentive structure in the tax and benefit systems
supportive to employment. This implies modernising tax (direct taxation on labour
income and social security contributions paid by employers and employees) and
benefit systems (unemployment insurance, in-work benefits, disability and sickness
schemes, means-tested benefits and other forms of social assistance), so that they
reduce benefit dependency and provide effective incentives to take up jobs, and
remain in work, by making work economically attractive and rewarding relative to
staying on benefits. Moreover, providing the right incentives to increase employment
and hours worked is particularly important to improve labour utilisation, also in the
light of budgetary challenges stemming from ageing populations.
Against this background, when assessing how Member States fare and have made
progress in this regard, it is useful to look at performance indicators such as labour
participation, employment and unemployment rates. Moreover, it is also important to
take policy outcomes into account, measured by different tax wedges and marginal
effective tax rates that give an indication of the size of unemployment, inactivity and
low-wage traps.
In those Member States where employment and participation rates are relatively low
(BE, BG, EL, MT, IT, PL, RO), or in those where labour market participation is
higher but where generous welfare systems require extensive financing (SE, DK,
NL), it is particularly challenging to improve incentives to work and hours worked.
In other countries, the incentives to work embedded in their tax and benefit systems
appear to be significantly low, as also results from their labour market situation (BE,
PL). However, it can be observed that in several Member States a fair wealth of
measures has been taken to improve the incentives to work, both as regards reforms
in the benefit system, and in particular labour taxation, while in general much less
has been done in the field of employment protection legislation.
In the area of unemployment and welfare-related benefits, some countries passed
major reforms over the years of this Lisbon cycle (CZ, SE in 2007; BG, FR, SI in
2006; HU, NL in 2005; DE in 2004). In other Member States, policy action has been
taken to promote labour market transition from unemployment and inactivity to work
through stricter work availability criteria, the use of sanctions for non-compliance
with rules, the strengthening of control mechanisms and streamlining the financing
for labour market subsidies and income support (GR, NL, PT, SI in 2007). Many
reforms that do not appear to directly target the financial incentives to work, such as
strengthening the enforcement of rules and tightening up eligibility and workavailability requirements, may in fact well improve the overall incentive structure of
the benefit system. However, risks remain of low-wage, unemployment and
EN
21
EN
inactivity traps for the unskilled and low income earners in a consistent number of
Member States.
As regards labour taxes, many Member States have lowered the level of taxation on
labour in recent years, either through general tax reductions, mainly focused on
cutting the tax-wedge on low income groups (AT, FR, HU, SI, CZ, IT, MT, LT, SE),
or by a straight reduction of the tax burden on low incomes (DK, FI, GR,NL, SL),
there including extensions of the tax-free range of income or tax credits for lowincome earners (LV, SE, FR, GR, IRL, NL, SK). In 2007, measures to this end was
taken in FI, SI, BG, IT, CY, GR, LT, LV, IR, MT, NL and the UK. Also, a general
trend towards reducing social security contributions for both employers and
employees was recorded over recent years, often aimed at boosting labour demand
and creating incentives to hire specific target groups (see for instance BE, SE, MT in
2007). Some convergence therefore appears to have taken place, as countries with
highest tax rates in 2001 are those that have reduced most over the last years.
Nonetheless, tax wedges on low wages remain high in a number of Member States
(see in particular BE, DE, FR, AT, SE, HU, PL).
To favour labour attractiveness especially for the lowest earners, i.e. to prevent
people from being discouraged to accept work because it could adversely affect their
income, a consistent number of Member States have also introduced over recent
years various sorts of in-work benefits schemes (BE, FR, PL, AT, CZ, SK, DK, UK).
Other countries have taken actions to reduce the use of benefit schemes – either
unemployment or disability schemes – as an alternative route for early retirement
(see HU in 2007 and UK in 2006). The sickness system was also largely reformed in
CZ and SE in 2007 and in the NL in 2006.
Overall, many countries have taken measures that go in the right direction, but the
overall impact remains limited in many cases and thus there is a need to further
pursue "making work pay" strategies along the principles of flexicurity. A further
challenge in this respect is how to lower labour taxes further without endangering
fiscal
consolidation.
EN
22
EN
Table 2. Overview of situation in EU Member States on securing economic stability
Performance
Budget
balance
Fiscal
stance
Inflation
rate
External
balance,
2007
2005-07
2007
2005-07
Areas where CSR have
been proposed
March
Dec.
2007
2007
2005
NRP
Key
challenge
BE
BG
CZ
DK
DE
EE
IE
EL
-0.3
3.0
-3.4
4.0
0.1
3.0
0.9
-2.9
-0.2
1.1
-1.9
-1.3
2.4
1.7
0.2
2.4
1.7
6.7
3.0
1.7
2.2
6.2
2.7
2.8
3.1
-14.3
-2.7
2.4
5.3
-11.2
-4.0
-8.8
ES
FR
IT
CY
LV
LT
LU
HU
MT
NL
AT
PL
PT
RO
SI
SK
FI
SE
UK
1.8
-2.6
-2.3
-1.0
0.9
-0.9
1.2
-6.4
-1.8
-0.4
-0.8
-2.7
-3.0
-2.7
-0.7
-2.7
4.6
3.0
-2.8
0.6
1.0
2.0
2.1
0.6
-0.4
0.6
2.9
0.8
-1.0
-0.1
1.1
2.8
-1.7
-0.3
-1.9
0.7
0.6
0.5
2.6
1.4
1.9
1.8
9.5
5.7
2.4
7.6
0.7
1.6
1.9
2.3
2.4
4.5
3.4
1.6
1.5
1.6
2.4
-7.8
-2.0
-1.5
-5.9*
-17.8
-9.2
10.9*
-5.2
-3.4
6.9
3.6
-2.0
-8.3
-10.3
-2.6
-6.7
5.4
6.4
2.8
Council
Comm.
Prop.
C
S
R
C
S
R
P
T
W
X
X
X
X
X
X
X
X
X
X
X
X
X
X
X
X
X
X
X
X
X
X
X
X
X
X
X
X
X
X
X
X
X
X
X
P
T
W
X
X
X
X
X
X
X
X
Note: CAB: cyclically-adjusted budget balance; Fiscal stance: measured as the change in the structural budget
balance over 2005-2007 (a positive figure implies tightness, a negative looseness); CSR: country-specific
recommendation; PTW: point to watch
EN
23
EN
Table 3. Overview of situation in EU Member States
sustainability.
Policy Performance
Sustaina
bility
gap
Sustaina
-bility
risk
classification
Empl.
rate
older
worker
2007
2007
2007
2006
85
19
30
25
65
3
25
94
36
64
104
61
10.
18
7
66
63
47
60
47
64
13
26
31
36
41
45
2.7
n.a.
8.0
0.3
3.3
-3.2
2.4
1.3
2.8
3.2
3.0
7.0
1.2
2.4
9.3
12.3
-0.1
2.4
-0.1
-1.4
8.3
n.a.
7.0
4.1
-0.7
-1.5
4.2
Medium
High
Low
Medium
Low
Medium
High
Medium
Medium
Medium
High
Low
Low
Medium
High
Medium
Low
Low
Low
High
High
Medium
Low
Low
Medium
32
45
61
48
59
53
42
44
38
33
54
53
50
33
34
30
48
36
28
50
33
33
55
70
57
Debt
ratio
BE
BG
CZ
DK
DE
EE
IE
EL
ES
FR
IT
CY
LV
LT
LU
HU
MT
NL
AT
PL
PT
RO
SI
SK
FI
SE
UK
on securing long-term
Areas where CSRs have
been proposed
2005
March
Dec.
NRP
2007
2007
Council
Key
Challenge
X
X
X
X
X
C
S
R
X
X
X
X
X
X
X
X
X
X
X
P
T
W
Comm.
Prop.
C
S
R
X
X
P
T
W
X
X
X
X
X
X
X
X
X
X
X
X
X
X
X
X
X
X
X
X
X
X
X
X
X
X
Note: the S2 indicator measures the budget adjustment necessary to ensure sustainability given government debt
and projections of age related expenditures. The sustainability risk class takes the S2 indicator into account as
well as additional information: ource: Public Finances in EMU 2007, European Economy N°. 3, 2007. CSR:
country-specific
recommendation;
PTW:
point
to
watch.
EN
24
EN
Table 4. Overview of situation in Member States on wage developments and bargaining
systems
Policy Performance
BE
BG
CZ
DK
DE
EE
IE
EL
ES
FR
IT
CY
LV
LT
LU
HU
MT
NL
AT
PL
PT
RO
SI
SK
FI
SE
UK
Nominal
Unit
Labour
Cost
Real
Unit
Labour
Cost
2007
2007
1.1
10.5
2.2
4.4
0.8
12.7
3.6
2.6
2.0
2.1
1.3
1.1
21.0
7.9
3.3
3.0
1.1
1.8
0.8
4.2
1.1
10.2
2.3
0.4
0.8
2.8
1.7
-1.0
2.8
0.1
2.0
-1.0
3.7
1.5
-0.4
-1.0
0.2
-1.3
-1.4
4.6
0.1
-0.3
-2.8
-1.4
0.4
-1.4
1.3
-1.7
2.3
-0.5
-2.1
-1.2
0.4
-1.4
Diversity
of
regional
unemployment
47
47
47
20
45
34
17
30
33
36
63
n.a.
23
21
n.a.
30
n.a.
26
41
22
30
42
31
42
29
16
34
Areas where CSRs have
been proposed
2005 March
Dec.
NRP 2007
2007
Key
Chall
-enge
*
Council
C
S
R
*
*
*
P
T
W
Comm.
Prop.
C
S
R
*
X
*
*
P
T
W
*
*
X
*
*
X
*
X
*
X
X
Note: Diversity of regional unemployment is measured by the coefficient of variation of 2005 regional
unemployment (source Eurostat). as a benchmark, 44% equals the EU average plus one standard deviation.
CSR: country-specific recommendation; PTW: point to watch.* in "policy orientations" column refers to a policy
orientation dealing with regional unemployment disparities rather than directly mentioning wages per se.
EN
25
EN
Table 5. Overview of situation in Member States regarding policies for "making work
pay".
Policy Performance
Participation
rate
BE
BG
CZ
DK
DE
EE
IE
EL
ES
FR
IT
CY
LV
LT
LU
HU
MT
NL
AT
PL
PT
RO
SI
SK
FI
SE
UK
Unempl
oyment
trap
Inactivity
trap
Tax
wedge
2006
2005
2005
2006
66.5
64.5
70.0
80.6
75.0
72.4
71.8
67.0
70.9
69.4
63.0
73.0
71.3
67.4
66.6
62.0
59.2
77.4
73.7
63.0
73.9
64.1
70.9
75.0
75.6
78.8
75.5
85
74
66
90
75
65
74
62
80
82
72
63
87
80
88
55
59
83
67
81
81
61
93
75
77
87
68
65
n.a.
56
88
67
48
74
16
43
62
23
63
61
39
69
44
59
83
65
58
38
n.a.
60
67
74
78
68
49
31
40
39
47
40*
16
35
36
44
41
19*
42
41
31
43
18*
41
44
42
32
42
36
36
39
46
30
Areas where CSRs have
been proposed
March
Dec.
2005
2007
2007
NRP
Council
Comm.
Prop.
C
S
R
P
T
W
C
S
R
P
T
W
X
X
X
X
X
X
X
X
X
Key
Challenge
X
X
X
X
X
X
X
X
X
X
X
X
X
X
X
X
X
X
X
X
X
X
X
X
X
X
X
X
X
X
X
X
X
X
X
X
X
X
X
X
Note: Unemployment and Inactivity traps are calculated on the basis of marginal effective tax rates The "tax
wedge" is the difference between the costs of a worker earning 67% of the average wage and the amount of net
earnings received (* =2005 figure): sources: Eurostat CSR: country-specific recommendation; PTW: point to
watch
EN
26
EN
II. MICRO-ECONOMIC PART
Summary and conclusions
Micro-economic reforms are the heart of the reform efforts of the Member States under the
revised Growth and Jobs Strategy. Half of the main challenges, as identified by the Member
States themselves in their National Reform Programmes for 2005-2008, are in the microeconomic area. Nearly half of the country specific recommendations and 'points to watch'
which the Commission proposed and which the Council adopted in spring 2007, relate to
micro-economic reforms (Graph 2).
The key challenges and country specific recommendations in the micro-economic area are
strongly concentrated on research and innovation; competition; the regulatory environment
and entrepreneurship/SMEs. Despite the focus on several micro-pillar issues, it is important to
keep in mind that they form part of an integrated strategy: microeconomic reforms will be
deprived of much of their effectiveness if complementary measures are not taken within the
macroeconomic and employment pillars.
This chapter takes stock of the reform efforts under the microeconomic pillar of the Growth
and Jobs strategy. Section 1 presents some of the theoretical and empirical evidence in
support these efforts and Section 3 overviews progress achieved so far in the various policy
areas. Section 4 draws some forward looking conclusions. This section shows that significant
progress has been made in a number of areas with the implementation of the microeconomic
reform agenda. Around half of all Member States have shown a strong policy response in the
areas of R&D and ICT, and most others have at least made some progress in these areas.
Regarding the aim to unlock the business potential, particularly of SMEs, where concrete
objectives have been targeted for end-2007, a clear majority of Member States have shown at
least a fairly good or strong policy response. About a third of Member States show a strong
policy response with regard to energy and climate change. However, the uneven
implementation record across Member States implies that progress overall could still be
better. This stock-taking exercise concludes that measures in different policy areas call for a
higher degree of policy coordination and integration, in order to maximise positive
externalities. This does not apply only to the micro-pillar policies – where an integrated
approach to the ‘knowledge triangle’ of research, innovation and education policies is called
for – but also to the reform design across the three pillars of the renewed Lisbon strategy.
EN
27
EN
Graph 1. Number of key challenges in the microeconomic pillar in the National Reform
Programmes of the Member States
25
22
20
18
15
13
12
10
8
7
5
2
1
1
0
Infrastructure
Enterpreneurship &
SMEs
Better Regulation
Competition
Internal Market
Environment
Industrial Policy
ICT
R&D and Innovation
Note: Number of EU27 Member States having identified the issue as a key challenge.
Graph 2. Number of country-specific recommendations and points to watch in the policy
areas of the microeconomic micro-pillar
25
20
20
19
15
15
10
10
4
3
5
4
3
Infrastructure
Entrepreneurship
& SMEs
Bettter regulation
Competition
Internal market
Environment
Indusrtrial policy
ICT
R&D + Innovation
0
0
Note: Number of Member States for which the Council made a specific recommendation or raised a 'point to
watch'.
EN
28
EN
1.
ECONOMIC EFFECTS OF MICROECONOMIC REFORMS
Raising the long-term economic potential by increasing productivity growth is one of
the fundamental objectives of the renewed Lisbon strategy. A large part of the
reforms, in pursuit of this objective, are being undertaken in the microeconomic
policy pillar of the strategy.
Given what is known about the relationship between microeconomic structural
reforms and productivity growth, the present section undertakes a broad assessment
of whether the types of reforms engaged by Member States since 2005 are likely to
have the desired effects on growth in total factor productivity12. Some estimates of
the size of these effects are presented in a separate staff working paper on spillovers
and complementarities in the context of the Lisbon Strategy13. However, as the
results of productivity-enhancing structural reforms can rarely be captured in the
short term and since the measurement of their effects is complex and fraught with
both methodological and empirical problems, a note of caution is in order.
Europe's success in achieving sustained economic growth during the post WWII era
is associated mainly with capital accumulation and the imitation or adaptation of
innovations made elsewhere. Once the catching up process was complete by the
1980s, this strategy was no longer sufficient to boost growth; increasing home-grown
innovation had become a necessity. The required transition can be described as
moving from the investment-driven phase of economic development to the
innovation-driven phase. Which policies are likely to support this transition?
The adoption and use of ICTs are regarded as salient among the factors determining
productivity growth. Against this background, detailed analyses have attributed the
widening of the gap in productivity growth between the United States and Europe
since the mid-1990s mainly to innovations in the ICT sector and their rapid spread
across all sectors of the economy. Contrary to the United States, Europe has failed to
keep up with regard to both the production and the use of ICT. ICT investment, in
order to bring the desired productivity gains, needs to be accompanied by
organisational change and the retraining of the workforce.
Many economic studies indicate that there is a significant relationship between
market structure, and hence competition, and innovation. In general, competition is
found to have a positive effect on innovation14.
The design of growth-enhancing policies may need to change once countries move
closer to the technological frontier. For instance, stringent protection of intellectual
property can be more important for productivity growth in countries close to the
frontier which are more heavily engaged in innovation rather than imitation.
12
13
14
EN
This section draws on the analysis developed in Chapter 2 of the European Competitiveness Report
2007 - SEC(2007) 1444, 31.10.2007.
Spillovers and complementarities in the context of the Lisbon Growth and Jobs Strategy including
economic effects of the Community Lisbon Programme - SEC(2007) 1689.
See OECD - Economic Policy Reforms: “Going for Growth”; of 9th February 2006; by Jean Philippe
Cotis; at
http://www.oecdwash.org/PDFILES/gfg2006_cotis_washington.pdf#search=%22OECD%202006%20
Going%20for%20Growth%22
29
EN
Most empirical evidence suggests a negative relationship between the intensity of
regulation and indicators of economic performance such as innovation or
productivity. Reducing administrative burdens can boost GDP by freeing resources
for more productive uses. This also underlines the importance of structural reforms in
the labour market to facilitate the reallocation of production factors.
Studies on the links between regulation and productivity suggest that labour
productivity has accelerated since the mid-1990s in lightly-regulated economies
while it either grew more slowly or declined in highly-regulated countries. In
addition, lower barriers to trade and less regulation appear to have increased the level
and rate of productivity growth by stimulating business investment and promoting
innovation. Studies on the impact of product market reforms on innovation in the EU
find that intensifying competition tends to increase R&D investment, but mainly
through increased innovative activity by incumbents rather than by new entrants.
Policy synergies
Claims that labour market reforms and product market reforms are complementary
have been corroborated by simulations which indicate clear synergies between
product and labour market policies. As an example, increasing skills and R&D raises
real wages, which in turn is expected to lead to an increase in participation rates. The
reduction of administrative burdens, through lower mark-ups, has synergies with the
employment target due to a reduction in equilibrium unemployment. There are also
clear synergies between the skills policy and R&D policies: without a sufficient
supply of graduates in mathematics, science and technology, additional R&D
expenditures will increase wages for these workers but will not impact output
substantially.
2.
THREE
2.1.
Knowledge and innovation
2.1.1.
Research and innovation
YEARS IN THE NEW REFORM AGENDA: AN ASSESSMENT OF PROGRESS BY
POLICY AREA
Investment in knowledge (R&D and education) is the basis of innovation and
technological progress. Raising the level and effectiveness of expenditure on
knowledge is crucial for the EU to make the shift towards a knowledge based
society. Following the re-launch of the Lisbon strategy in 2005, all Member States
except BG have set national targets for R&D intensity and most of them have
developed ambitious R&D and innovation strategies and accompanying measures to
increase R&D intensity and the innovative capacity of their economy.
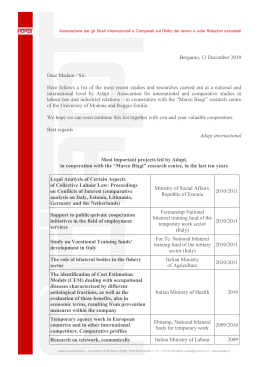
However, progress as concerns EU R&D intensity has so far been unsatisfactory,
standing in 2006 at 1.84% GDP, a considerable way off the 3 % R&D target (see
graph 3). Moreover, in 2007, France and Greece postponed their 2010 targets
whereas Hungary, the Slovak Republic and Poland revised their targets towards
lower levels of ambition. Should all Member States achieve their national targets, EU
R&D expenditure is now forecasted to be 2.5% of GDP by 2010.
EN
30
EN
Graph 3: Gross domestic expenditure on R&D (GERD) as % of GDP – 2006 levels1
(provisional data) & targets
4.5
Situation 2006 (1) - Provisional data
%
Target 2010 (2)
4.0
3.5
3.0
2.5
2.0
1.5
1.0
0.5
Sw
ed
e
Fi n
nl
a
n
G
er d
m
an
Au y
s
D tria
en
m
ar
Fr k
an
Be ce
lg
iu
m
N
U
et
.
K
he
rla .
n
Sl ds
o
Lu ven
xe i a
m
b
C urg
ze
ch
R
Ire .
la
nd
Sp
a
Es in
to
ni
a
I
H taly
un
ga
Po ria
rtu
Li ga
th
l
ua
ni
a
La
tv
i
G a
re
ec
Po e
la
nd
M
al
Sl ta
ov
a
Bu kia
lg
R aria
om
an
C ia
yp
ru
EU s
-2
7
0.0
Notes:
(1) IT, LU, PT, UK: 2005.
(2) EL: 2015; FI: 2011; FR: 2012; IE: 2013-GNP; SK: 2015; UK: 2014; EU27 = DG RTD est. for EU26
(3) Member States have been ranked according to the current level of R&D intensity from left to right.
Source: Eurostat, Member States
In general, Member States have followed up on their commitments by announcing
increases in government budgets for R&D in nominal terms; however, concurring
increases in GDP have led to budgets remaining either stable for many Member
States or even slowly decreasing (FR, IT, NL, SK) in % GDP terms. On the other
hand, public R&D spending has significantly increased in several Member States
(CZ, EE, IE, ES, LT, SL, RO, LU, PT), showing that progress can be made when
effectively prioritising R&D investment. Business R&D remains low in the EU and
has seen no positive evolution since 2000, clearly indicating that improving the
framework conditions for private R&D investments and the leverage of public R&D
policy should remain policy priorities.
Tax incentives continue to be a major instrument for governments to stimulate
private R&D investment. Over the past years, a clear EU wide shift has taken place
in the direction of strengthened fiscal incentives. This trend continued throughout
2007 with a number of Member States (NL, UK, BE, FR, CZ, IE, PT, AT, RO, IT)
EN
31
EN
further developing their incentive systems while others undertook to evaluate their
effectiveness.
In this context, the increasing role of Cohesion Policy in financing R&D can be
clearly noticed, especially in some of the new Member States. The effective use of
Structural Funds earmarked for research is an important opportunity for many
countries that still have a low level of funding.
Assuring adequate levels of human resources will be a critical factor in raising R&D
expenditure and is being addressed through measures such as increasing the number
of scholarships or making researchers' career prospects more attractive. A recent
trend has seen the setting up of programmes aimed at stimulating the recruitment and
re-integration of excellent expatriate and foreign researchers. The planned Structural
Funds interventions should provide an important contribution to develop the
European human potential for research and innovation.
Reforms in R&D policies have up to now been designed almost exclusively from a
national perspective. As R&D systems are, however, increasingly interconnected, it
is important that national policy makers take explicit account of the European
perspective in their national policies, in order to maximise the benefits from
synergies and spillovers. This would increase the effectiveness of national systems
and would, in the context of the European Research Area initiative, make a
significant contribution towards developing the EU's research system as a whole to
be a competitive player on the global scene.
However, increasing investments in research is not enough for bolstering the
innovative capacity of the economy as around half of innovative firms in the EU do
not conduct any formal R&D. At national level, improving science-industry linkages
continues to receive significant policy attention. Setting up public-private
partnerships to stimulate innovation is the most prominent approach. Measures range
from improving the legal framework governing science-industry interaction, to
networking, the establishment of technology transfer mechanisms, or the promotion
of inter-sector mobility of researchers. Policy focus has recently shifted from
traditional 'technology push' -type measures towards a more systemic approach to
build innovation support mechanism. However, Member States still give a low
priority to demand side issues, such as public procurement, faster commercialisation
of innovative ideas and faster growth of innovative start-ups. In particular, better
access to domestic and international finance by innovative SMEs remains an
important challenge in most EU Member States.
There has been some progress in the EU's innovation strategy. In 2006, the
Commission outlined an innovation strategy15 for the years 2006 to 2008. This
strategy is broad-based in that it brings together policies and measures from several
different areas, and is complementary to regional and national measures foreseen in
the context of the National Reform Programmes of the Lisbon process. On this basis,
the December 2006 Competitiveness Council adopted nine strategic priorities for
innovation action at EU level. Initiatives so far have covered areas of Intellectual
15
EN
Commission communication “Putting knowledge into practice: A broad-based innovation strategy for
Europe” - COM(2006) 502.
32
EN
Property Rights, standardisation in support of innovation,, public procurement in
support of innovation. Joint Technology Initiatives, lead markets, the European
Institute of Technology (EIT), clusters, innovation in services and risk capital
markets.
2.1.2.
Information Society
Throughout the first three years of the revised Lisbon agenda, there has been an
increasing focus on mainstreaming ICT policies. The most frequent initiatives in the
Implementation Reports relate to the spread of eGovernment, broadband and digital
skills in education.
Member States have seen e-Government and the use of ICT in administrations as
instrumental in improving government efficiency and service delivery. Online public
services in the EU are moving rapidly towards the stage where a whole process can
be conducted on-line.
Austria has been leading the online public service league. Other top performers are
Malta and Slovenia, while Portugal has made major progress since 2006. Businesses
are still being better served than citizens, although the gap between the two is
closing. In general, Implementation Reports show continued commitment to the
development of e-government policy, with increasing attention devoted to one-stop
shop government portals in all countries, digital signature, electronic identity cards,
and the use of e-government for back-office re-organisation with a view to the
modernisation of the public sector. The trend is very strong in the new Member
States but also in large countries like Italy which need to catch up with the most
advanced Member States.
In the area of broadband, take-up is progressing fast. The average penetration rate
(number of subscribers per population) has increased from 10.5% in July 2005
(EU25) to 18.2% in July 2007 (EU27) (see graph 4 below). Although some European
countries are world leaders in terms of broadband access, there is a growing gap
between the best and worst performers. The main reasons for this are the lack of
infrastructures in some Member States and the need for a more consistent and
effective implementation of the existing e-communications regulatory framework.
Most Member States are stimulating take-up through the implementation of the
regulatory framework and are extending broadband coverage in rural areas. The most
significant gaps can be found in the rural areas of PL, EL, LV, SK but also in IT and
DE. Actions in these areas are mostly funded through Cohesion policy programmes
(mostly in the new Member States) and the European Agricultural Fund for Rural
Development16 (EAFRD).
16
EN
About one-third of the Rural Development Programs 2007–2013 take on board broadband initiatives.
33
EN
Graph 4: EU Broadband penetration rate (July 2007)
40
35
30
25
% 20
15
10
5
Denmark
Finland
Netherlands
Sweden
Belgium
Luxemburg
U.K.
France
Germany
Austria
Estonia
E.U. 27
Italy
Spain
Ireland
Slovenia
Portugal
Malta
Lithuania
Czech R.
Latvia
Hungary
Cyprus
Slovakia
Poland
Greece
Romania
Bulgaria
0
Source: Communications Committee
In general, there is a need to bring forward more concrete and innovative policies,
speeding up action on the interoperability of cross-border eGovernment services,
stimulating business take-up and including e-skills strategies in life-long learning and
skills policies.
2.1.3.
Industrial competitiveness
The industrial competitiveness of Europe depends to a great extent on setting the
appropriate framework conditions for the entire economy. Therefore, actions
undertaken in other policy areas, such as R&D and innovation, reinforce industrial
competitiveness in Europe. Yet, industrial competitiveness can require industry
specific horizontal and sectoral initiatives.
The majority of Member States addressed industrial competitiveness over the period,
notably through measures to increase the technological content of industry, to
address the sustainability of industry, to promote sectoral competitiveness and to
favour the internationalisation of companies by supporting exports or attracting
foreign investments. In 2007 more emphasis was put on investment in environmental
technologies.
EN
34
EN
2.2.
Energy and climate change
The Lisbon strategy aims at strengthening the link between sustainable use of
resources, environmental protection, climate and energy policies and growth. Many
Member States have included environmental sustainability among their key priorities
or challenges and report important new policy measures. However, recent analysis
shows that tackling climate change, improving resource and energy efficiency, and
halting biodiversity loss will remain key challenges for the period until 2011 and
more efforts will be needed. Recognising this, new cohesion policy programmes plan
a total investment of €50.6 billion under the heading of environmental protection and
risk prevention. Further investment of €9.6 billion is planned in the area of energy.
Energy efficiency and conservation is a key issue in reducing greenhouse gas
emissions and curbing energy demand. A majority of Member States is reporting
progress in this area and outline a number of policy measures already implemented
or in the planning stage. In addition, the EU average energy intensity had decreased
at 0.4% annually from 2002 to 2005. While the data suggest general room for
improvement in this area, notably through gains in energy generation or in buildings,
a direct comparison of performance between Members States is hindered by the
unique structure of the economy in each Member State. Improvements of
performance against sectoral benchmarks are a key requirement for the future.
Renewable energy has an important role in reducing CO2 missions, improving
sustainability and the security of energy supply as well as creating new job
opportunities, in particular in rural areas. According to the most recent data, nine
Member States (DE, DK, ES, FI, HU, IE, LU, NL, SE) are on track to meet existing
indicative targets for renewable electricity in 201017. As a result of support schemes,
including feed-in tariffs, the share of wind power and biomass in electricity
production has increased significantly in some Member States. The corresponding
industries have become world-class, allowing not only an improvement of the energy
situation inside the EU but also exporting equipment and know-how.
Also promotion of eco-innovations and environmental technologies could have
received more attention in the implementation reports. Most of the Member States
reporting new, specific measures have already a strong competitive edge in the
development and application of environmental technologies such as Sweden,
Denmark, Austria, or Finland. Some Member States also report measures under
consideration, for example, the expansion of the Environmental Fund in Slovenia for
financing high risk investments in environmental technologies. Further promotion of
environmental technologies would increase competitiveness in one of the fastest
growing markets and has the potential to promote efficiency across all industries and
generate new employment.
Some Member States report on measures to halt biodiversity loss, taking into
account environmental and economic role of ecosystems. These measures include
adoption and implementation of national biodiversity strategies, completion of
17
EN
Directive 2001/77/EC.
35
EN
Natura 2000 network, providing economic incentives to biodiversity protection and
rural development policies.
Efforts to break existing trends in resource use and unsustainable consumption
patterns have generally not been highlighted in the Member States reports.
However, some Member States report progress in implementation on green public
procurement and resource management (e.g. waste, water and forestry) as well as on
internalising the environmental costs through market-based instruments.
Nevertheless, the average policy response on internalisation appears weak and slow,
with a number of countries lagging behind expectations. Even when internalisation
and the "polluter pays" principle are mentioned by Member States as policy
priorities, concrete measures are missing in terms of environmental reform
initiatives. Positive examples in this area include the environmental tax and fee
systems of Denmark, Luxembourg, Netherlands and UK as well as a new
environmental tax in Belgium partially offsetting the tax reduction on labour. An
environmental tax reform shifting the tax burden from welfare-negative taxes (e.g. on
labour) to welfare-positive taxes (e.g. on environmentally damaging activities) can
be a win-win option to address both environmental and employment issues, and
could be explored further by all Member States. Tax exemptions to promote biofuels,
incentives for low emission vehicles, road charging reforms, use of market-based
instruments, traffic management and shifts to more environmentally friendly modes
of transport by several countries will help reduce external costs from the transport
system.
The issue of climate change represents a long-term challenge which, if left
unaddressed, would bring about major economic costs for the European Union.
According to the Stern Report18 the overall costs and risks of climate change could
be as much as 5-20% of global GDP, with the costs of strong and early action to
reduce greenhouse gas emissions to avoid the worst impacts of climate change
estimated at 1% of global GDP.
The EU has committed itself early to lead the global combat against climate change.
Under the Kyoto Protocol, the European Community (EC) has agreed to reduce its
greenhouse gas emissions by 8% by 2008–12, from base year levels. Through the
burden sharing agreement this joint target has been distributed to individual Kyoto
targets for the EU 15 Member States. All new EU Member States, except for Cyprus
and Malta, also have agreed on targets for reducing greenhouse gases. While the EU
overall has made progress in reaching the targets set the fight for climate change
continues to be a real challenge, involving significant investments and potentially
structural changes.
Progress in the implementation of measures against climate change so far is mixed.
Several Member States will have to implement additional policies to comply with
Kyoto targets (Austria, Finland, France, Greece, Luxembourg, Portugal and
Slovenia), while most recent projections indicate that Italy, Spain and Denmark may
not meet their targets even with additional policies (Graph 5).
18
EN
Stern (2006).
36
EN
-60.0%
-40.0%
EN
-30.0%
-33.7% -29.0%
-20.0%
-20.8%
-17.8%
-22.7%
-22.5%
-22.2%
-27.8%
-23.9%
-22.4%
-4.7%
3.5%
2.0%
0.9%
-0.1%
0.0%
2.7%
0.5%
0.2%
0.6%
0.0%
-0.9%
-0.4%
-2.0%
-4.7%
-1.4%
-3.4%
-0.7%
-0.5%
-4.1%
-3.9%
-10.0%
-15.3%
-12.2%
-10.4%
-11.2%
-3.4%
10.0%
9.7%
20.0%
17.9%
15.4%
12.7%
14.2%
an
of
37
the
Kyoto
target
With all measures, KM and carbon sinks
overachievement
With existing measures, KM and carbon sinks
Percentage points over-delivery (-) or shortfall (+) of respective emission targets
-50.0%
-51.9%
-48.6%
-40.6%
-38.2%
Note:
A
negative
sign
(-)
indicates
Source: Draft Kyoto progress report 2007 pg. 9 Fig. 5
-70.0%
Slovenia
Slovakia
Romania
Poland
Lithuania
Latvia
Hungary
Estonia
Czech Republic
Bulgaria
EU-15
United Kingdom
Sweden
Spain
Portugal
Netherlands
Luxembourg
Italy
Ireland
Greece
Germany
France
Finland
Denmark
Belgium
Austria
while
30.0%
a
40.0%
positive
sign
(+)
a
shortfall
Graph 5: Relative distance between GHG projections for 2010 and the respective 2010 targets based on ‘existing’ and ‘additional’
domestic policies and measures, the use of Kyoto mechanisms and carbon sinks
EN
Several EU-wide common and coordinated policies and measures have been
implemented, most notably the EU Emissions Trading Scheme (ETS), the RES-E
directive, the directives on the energy performance of buildings and on biofuels, the
promotion of co-generation (combined heat and power), and energy taxation. On
average 10,800 installations participated in the first two years of the trading scheme
(2005 and 2006) emitting approximately 2,020 Mt CO2/yr. Two thirds of all
installations are classified as combustion installations and are responsible for 72% of
overall emissions. The assessment process for the second National Allocation Plans
(NAP) started in 2006. On average, the proposed caps were reduced by 7% compared
to the 2005/2006 verified emissions, which should bring an estimated emission
reduction of 2.4% for the EU-27 compared to base year.
For the future, tackling climate change needs a long-term view. The European
Council has set ambitious targets for 2020 to reduce greenhouse gas emissions by at
least 20% and to increase the share of renewables in energy consumption to 20%. In
addition, energy efficiency is to increase by 20% compared to the base trend and the
share of biofuels in overall transport petrol and diesel consumption is to reach to
10%. This confirms the EU leadership in internalising the adverse effects of CO2
emission at the global level. It is essential to reach these targets in a cost-effective
way to maintain the competitiveness of the EU economy. Furthermore early action
on adaptation to climate change will minimize risks to economic development,
health, property, and infrastructure. If managed well, the challenge can create
additional opportunities for innovative EU businesses that lead in developing new
technologies and strategies.
2.3.
Making Europe a more attractive place to invest and work
2.3.1.
Internal Market and Competition
Internal Market and competition are complementary policies: the former focuses on
the regulatory framework of the Internal Market and its effective implementation
while the latter aims to ensure open and competitive markets, thereby enhancing
consumer welfare. Since 2005, the policy attention given to these two areas has
varied widely across the Member States.
As regards the Internal Market, the Member States in general have not identified
concrete policy actions in their National Reform Programmes. Nonetheless, the
transposition deficit of Internal Market legislation has improved considerably over
the last period in a number of Member States.
As regards competition, the measures were often general in scope and rarely linked
to quantitative indicators; often (in particular as regards network industries)
references were simply made to the implementation of the existing acquis. The
second most frequent measures – after network industries – were reforms relating to
the enforcement of competition policy.
2.3.1.1. Progress on particular internal market and competition issues
• Transposition of internal market directives is mentioned as a specific issue in a
number of NRPs but in the majority of cases it is not being dealt with in an
operational way. There is however a considerable improvement in a number of
EN
38
EN
Member States of the transposition deficit over the last two years; but at the same
time the number of infringements is increasing, indicating a deteriorating quality
of transposition. As a follow up to the 2007 Spring Council conclusions the
Member States concerned will need to address the question of how they intend to
reduce their deficit to 1% by 2009 at the latest. There is also a need for a more
qualitative approach, including by reinforcing the problem solving capacity of
Member States in addressing incorrect application of internal market law.
• In spite of their economic importance, only very few NRPs address at present the
issue of better functioning of public procurement markets. The key challenge is
to make sure that Member States comprehensively transpose and implement the
new public procurement framework adopted in 2004 in a correct, timely and
coherent way.
• Experience so far is largely positive in the field of competition policy
enforcement. Several Member States have taken measures contained in their
NRPs strengthening national enforcement regimes (e.g. extending the powers and
resources of national competition authorities) in line with the Modernisation of
EC competition law in 200419. Also, most if not all Member States and their
national competition authorities are engaged in the screening of markets with the
aim of removing obstacles to competition (a fact which is reflected in several
NRPs). DK has a particularly advanced system in this respect. Rather large
divergences in terms of ambition seem to exist. Less emphasis seems to have been
put on the actual removal of obstacles identified.
Looking forward, ensuring convergence and uniformity in the application of EC
competition rules through the European Competition Network (ECN)20 remains a
challenge. In programmes foreseeing immunity from or reduction in fines for
undertakings revealing cartels (leniency) convergence is of key importance21. The
role of national courts in ensuring convergent enforcement of EC competition law
should be stressed. Further efforts should be undertaken to accelerate judicial
proceedings in competition cases. Member States could in line with the existing case
law of the Court22 be encouraged to undertake procedural reforms facilitating
antitrust damages actions.
• In its APRs the Commission has attached particular importance to the need for
national action to remove unnecessary and disproportionate restrictions on
competition in professional services. While some Member States are taking
positive steps to remove restrictions, in some cases yielding rapid positive effects
(IT), significant reforms are still needed on the part of other Member States
(reflected in a number of country specific recommendations and points to watch).
19
20
21
22
EN
Regulation No 1/2003.
Comprising the Commission and the national competition authorities of the EU Member States.
See e.g. the ECN Model Leniency Programme. The OECD (see "Hard Core Cartels – Third Report on
the Implementation of the 1998 Recommendation") refers to recent research estimating that the average
overcharge is somewhere in the 20-30% range (with higher overcharges for international cartels).
The case law of the Court of Justice already today obliges Member States to guarantee effective
procedures for obtaining damages in case of an antitrust infringement (see e.g. C-295/04 to C-298/04,
Manfredi, paragraph 62).
39
EN
The reforms should focus on the most severe restrictions (e.g. price regulation and
unjustified barriers to entry).
• The persistence of barriers to competition combined with the economic
significance of this sector justify that professional services remains a priority for
the upcoming Lisbon cycle. Indeed, roughly one fifth of cases concerning
infringements of competition results reported within the framework of the
European Competition Network has related to professional services. Moreover,
the Services Directive will oblige Member States to review and to assess the
proportionality of their national legislation on requirements affecting inter alia
professional service activities (e.g. fixed tariffs, multidisciplinary partnerships,
numerus clausus) in addition to ongoing screening by national competition
authorities of existing regulation and practices.
• Some NRP contain measures aimed mainly at removing public barriers to market
entry and expansion in the retail sector (e.g. opening hours). Some measures have
already produced positive effects in terms of prices in this area (IE). Given the
economic importance of the retail sector (not least as a productivity driver) there
would seem to be more scope for action (e.g. zoning laws, planning restrictions).
Improving entry to and competition at the retail and distribution levels would also
be helpful in ensuring that trade liberalisation agreed to by the EU feeds through
to end consumers23.
• Generally speaking Member States are making progress in shifting state aid to
horizontal purposes (e.g. environment, R & D) ("better aid") while efforts to
reduce the overall aid level has stagnated in recent years ("less aid"). As far as the
NRPs are concerned, only a few Member States have included specific measures
to reduce State aid or have reported on progress in reducing overall levels and
shifting aid towards horizontal objectives24. Important complementary
Community level measures under the State Aid Action Plan has been undertaken
to promote better aid while reducing burdens on companies and Member States.
• The main challenge ahead is the timely and consistent implementation of the
Services Directive, which will contribute to achieving a genuine Internal Market
in services. By removing legal and administrative barriers to the development of
services activities, it will facilitate the freedom of establishment and the freedom
to provide cross-border services. The implementation process is a complex and
challenging task both for the Member States and the Commission. Close
cooperation is required, and the Commission has taken the commitment to provide
guidance and to coordinate Member States' efforts until the December 2009
implementation deadline. To ensure that the necessary legislative measures can be
adopted in 2009, Member States should aim at completing the screening and
assessment of national legislation before end 2008. In parallel, the setting up of
23
24
EN
See '4. Conclusion – lessons to be drawn from the Irish experience of globalisation. European Economy
No 6.
The overall level of State aid less agriculture, fisheries and transport stood at € 45 billion for the EU in
2005. There is a slight downwards trend from an annual average of € 52 billion in the period 2001-2003
to an annual average of € 47 billion in the period 2003-2005. There is a clear move towards "better
targeted aid" with more than half of Member States now awarding more than 90% of their aid to
horizontal objectives.
40
EN
points of single contact, procedures by electronic means and of an effective
system of administrative cooperation will require Member States to make a
number of decisions and preparations in 2008.
• The importance of integration of financial markets is underlined in a number of
NRPs; however in most of the cases without setting out concrete actions.
Nevertheless, the transposition of the Financial Services Action Plan measures is
well under way, even if the process should be accelerated in some Member States.
As explained in the post-FSAP White Paper, the focus has now to be put from
adopting new regulation to ensuring correct implementation and effective
enforcement of existing measures and to removing remaining barriers to the
further integration of financial markets.
2.3.1.2. Network industries
While many Member States address competition in network industries, notably in
gas and electricity and electronic communications, from a growth and jobs
perspective greater efforts (going beyond existing legal commitments) are needed in
many countries in respect of issues such as unbundling (notably in the gas, electricity
and rail sectors) as well as the need for clearly mandated and independent regulatory
authorities with adequate levels of resources.
The focus on improving the functioning of network industry markets should be
sharpened. The importance of network industries from a competitiveness perspective
as well as from the point of view of citizens/consumers extends well beyond their 68% share of EU value added).
A common key challenge (in particular for gas, electricity, rail and electronic
communications) is the need to ensure independent, clearly mandated and well
resourced regulators (as well as intensified cooperation between the regulators
themselves and with the Commission.
Continuous efforts should be made at finding the optimal balance between sectorspecific regulation on the one hand, and general competition and internal market
policy principles on the other hand. To the extent that competition intensifies,
regulation may be progressively lifted.
Developments in the various network industries are as follows:
• Promoting competition in gas and electricity markets remains a key challenge and
concern for most Member States. While it is undeniable some progress in opening
up gas and electricity markets has been made in recent years, it is also true that in
many Member States a real competitive European market for electricity and gas
still needs to develop. Yet, the benefits to consumers and users of an effective
liberalisation are clear (see a comparison of price developments between
unbundled and integrated transmission system operators (TSOs) in graph 6). High
levels of market concentration, vertical foreclosure and lack of transparency
continue to characterise gas and electricity markets.
EN
41
EN
Graph 6: Electricity price evolution in EU-27 for the period 1998-2006 according to
ownership structure of TSO
Industry: MS with ownership unbundling
Industry:MS with integrated TSOs
Households: MS with ownership unbundling
Households: MS with integrated TSOs
100
19
98
1s
19
th
98
a
2n lf
d
19
ha
99
lf
1
s
19
99 t ha
lf
2
20 nd
ha
00
1s lf
20
th
00
a
2n lf
d
20
ha
01
1s lf
20
th
01
a
2n lf
d
20
ha
02
lf
20 1st
ha
02
2n lf
d
20
ha
03
1s lf
20
th
03
a
2n lf
d
20
ha
04
1s lf
20
th
04
a
2n lf
d
20
ha
05
lf
1
st
20
ha
05
2n lf
d
20
ha
06
1s lf
20
th
06
a
2n lf
d
ha
lf
100
Source: Eurostat, European Commission calculations
The key problems to be addressed are well known (vertical integration and the need
for more effective unbundling (preferably ownership unbundling). A particular
problem is a tendency for Member States to maintain or impose price regulation.
• Competition in electronic communications markets is governed by the
regulatory framework adopted in 2002. This is an innovative construction
involving harmonisation legislation based on competition policy principles. The
experience with the regulatory framework during its first three years of operation
is positive. More competition has led to innovation and investment by both new
entrants and incumbent operators as well as to significant retail price declines, for
example, of around 40% for local fixed telephony costs on average. The
independence of the national regulatory authorities both from ownership interests
in the sector and from undue political interference, and transposition issues (in
particular secondary legislation and amendments of existing laws) remain an
issue.
• While competition in the rail sector is addressed in some National Reform
Programmes, few Member States envisage concrete measures to tackle the key
problems limiting competition (such as the insufficient separation between the
infrastructure manager and the incumbent rail operator) and to ensure that the rail
EN
42
EN
regulators are independent and adequately endowed with resources. The major
event in terms of Internal Market and competition regulation in the railway sector
was the complete market opening for all kinds of rail freight services on the EU
railway network on 1 January 2007 according to Directive 2004/51/EC of 30
April 2004 (part of the second railway package). The legal possibility of open
access traffic has led to new market entry and the development of competition in
rail freight services in a number of Member States. The number of new entrants
and their market share has risen, for instance, in Poland, Romania, the Czech
Republic and France. Strengthening the power of institutions on which the
organisation of the sector depends, i.e. the rail infrastructure manager, the rail
regulatory body and the safety authority, will be of crucial importance. On 23
October 2007, the European Parliament and the European Council adopted the 3rd
railway package, which includes Community law on market opening for
international rail passenger services by 2010, passenger rights in rail
transportation and on the certification of train drivers.
• While all Member States have transposed the current directives, only a number of
Member States have addressed postal services in their National Reform
Programmes. Liberalisation has progressed well. Member States have embraced
liberalisation as agreed thus far and most of them have taken steps to prepare their
postal services sectors for further liberalisation. The actual level of competition in
the sector however remains low. Looking ahead, the Commission proposal for
liberalisation is expected to be adopted by EP and Council first semester of 2008.
Objectives of the proposed action are to achieve an internal market for postal
services through the removal of exclusive and special rights in the postal sector,
safeguard a common level of universal services for all users in all EU countries
and set harmonised principles for the regulation of postal services in an open
market environment, with the aim of reducing other obstacles to the functioning of
the internal market. The transposition and effective implementation of the
directive will be an important challenge.
2.3.2.
Better Regulation
In general, Member States have expressed their commitment to the key Better
Regulations objectives in their National Reform Programmes, while implementation
in the daily policy making processes has stalled. Moreover, Better Regulation has
been treated as a reform measure rather than as an underlying principle of efficient
public administration delivering effective, coherent and less burdensome
legislation25. So far, action at national level has been limited to the eventual setting
up of better regulation tools, without a real change in regulatory conditions and with
limited impact on the business environment. The lack of specific targets, compliance
incentives and monitoring and enforcement mechanisms has taken its toll in slowing
down the implementation of announced measures as well as the process of cultural
change in policy making.
The European Council has invited Member States to set their own national
administrative burdens reduction targets by 2008 of comparable ambition to the
25
EN
BG and RO have not been included in the analysis, as they are at the very beginning of developing their
approach to Better Regulation.
43
EN
target set by the Commission, i.e. a 25% reduction. To this date, ten Member States
(AT, DE, DK, EL, ES, IT, NL, SE, SK, UK) have set a 25% national reduction
target, while another two Member States (CZ, FR) set a target of 20%. In comparison
with last year this is considerable progress as the number of Member States with a
quantitative target has doubled. However, there is still a considerable effort to be
done in this regard by the end of next year.
The Commission and Member States will be entering a crucial phase next year when
first results from the measurement will provide indications of how administrative
burdens can actually be reduced. The key step was taken when most Member States
opted for the same measurement methodology (standard cost model). Four Member
States have so far carried out baseline measurement of administrative burdens (CZ,
DK, NL, and UK); while another four are currently conducting them (AT, DE, FR,
SE).
However, reduction of administrative burdens is only one of the regulatory
simplification elements. Despite initial progress in developing systematic
simplification programmes, the pace has slowed down with only two Member States
advancing in this area in the course of last year (PL and LU). It is worth mentioning
that in fourteen Member States (BE, CZ, CY, DK, IE, LU, MT, NL, PL, PT, SE, SI,
SK and UK), stakeholders are involved in setting regulatory simplification priorities
under existing programmes or ad-hoc measures.
Limited progress has been made in implementing impact assessment systems.
Rigorous impact assessments analysing economic, social and environmental impacts
of new legislative proposals are being carried out by a handful of Member States,
(AT, DK, DE, IE, NL and UK). Moreover, only two out of these six Member States
make their impact assessments publicly available (DK and UK). Overall, impact
assessment quality among Member States varies widely and there is room for
substantial improvement. Rather worrying remains the fact that very few institutional
structures which would allow for a rigorous implementation of the impact assessment
system and its quality control have been created (DE, IE and UK), while promising
steps in this direction are being taken (EL, LT and LV).
Regular consultation of stakeholders remains the least developed Better Regulation
tool in Member States. Even for those Member States which report on a formal
obligation incorporated in their law making procedures (AT, BE, CZ, DE, DK, FI,
IE, LT, LU, PL, SE, SI and UK), there is still scope for further improvement towards
a systematic implementation of clear, consistent and transparent consultation rules
across the board. Moreover, the understanding of the contribution that stakeholders
could bring into the policy making process substantially differs across the Member
States, as evidenced by the differences with regard to the stage in the law making
process at which the stakeholders become involved and with regard to the methods
used to reach them.
Lastly, progress in developing Better Regulation strategies has decelerated, with
only one Member State (CZ) developing a strategy in 2007. Some of the originally
promising plans have not yet resulted in explicit Better Regulation programmes
which would ensure a coherent approach to policy making. This stalemate, in
conjunction with the above mentioned lack of progress in the area of impact
assessments and legislative simplification, holds back progress in increasing the
EN
44
EN
efficiency of public administration and in creating favourable regulatory conditions
for businesses.
2.3.3.
Entrepreneurship and SMEs
Overall, the measures and initiatives in the area of SME policies undertaken by
Member States since the re-launch of the Lisbon partnership for growth and jobs in
2005 are going in the right direction. Progress has been particularly visible in
improving the start-up procedures but also in the integration of the "think small first"
principle into the policy-making process. In the area of entrepreneurship education,
SME access to public procurement and recruitment of the first employee, policy
actions have been initiated in almost all Member States while their results have not
yet materialised. Most of the priorities set at the Spring European Council 2006 –
start-ups, recruiting the first employee, entrepreneurship education, think small first –
need to be seen in a long term perspective, and related policy actions need to be
intensified.
Average time and cost to start up a private limited company is 12 days and cost is €
485 (see Table 1). This is substantially lower than the 24 days and € 830 for an
equivalent company in 2002. Many Member States have established a one-stop-shop
or equivalent arrangement even though in some cases they do not cover all types of
companies: only 2 out of 3 one stop shop systems offer the possibility to register a
private limited company. Member States that fully comply with all three objectives
(one-stop-shop, time and cost) are BE, DK, EE, FR, HU, PT, RO, SI and UK. In
general registration times have improved and in 13 Member States, it is now possible
to register a company within one week. It should be noted, however, that this
analysis only looks at the steps to get a company registered. In many countries there
are further administrative steps and more time is required before a new SME can
start its business operations26.
Table 1: Results of the objectives set by the Spring 2006 Spring Council conclusions One stop shop to start-up a company (1)
Name
Belgium
Bulgaria
Czech Republic
Denmark
Germany
Estonia
Ireland
Greece
Spain
26
EN
Cost to start-up
a company**
YES
NO*
Time required to
start-up a
company
1,5
12-30
NO*
42-56
€ 345 €
YES
3
€0
NO*
YES
6,5
2
€ 783
€ 190
NO*
2-5
€ 50
NO*
30
€ 1.366
YES
30-40
€ 617
Fully
operational
Guichet agreé d'entreprises
Central Registration Offices
(CRO)
Danish Commerce and
Companies Agency (DCCA)
Starter-Center
Notaries
Companies Registration
Office (CRO)
Directorate of Development
at the prefectures (KYE)
Ventanilla Única Empresarial
(VUE) + PAIT for Ltd.
€ 517
€ 155
In this context, the timely implementation of the points of single contact foreseen in the Services
Directive, to be implemented by end 2009, will also be an important task for Member States.
45
EN
France
Italy
Cyprus
Latvia
Lithuania
Luxembourg
Hungary
Malta
Netherlands
Austria
Poland
Portugal
Romania
Slovenia
Slovakia
Finland
Sweden
United Kingdom
Centres de formalités des
entreprises (CFE)
“Sportello unico”
OSS at Ministry of
Commerce, Industry and
Tourism
Register of Enterprises
Centre of Registers
Guichet unique d'entreprises
County Courts
Registrar of Companies –
Malta Financial Services
Authority (MFSA)
Chambers of Commerce
WKO Gründerservice
Tax Offices
Enterprise Formality Centres
(CFE)
Counties Trade Registers
VEM
Trade licence offices,
companies register
Trade Register
Företagsregistrering
Companies House &
Business Link
YES
4
€ 84
YES
4
€ 2.673
YES
7
€ 265
NO*
YES
YES
YES
4
6
14
2-3
€ 205
€ 130-€ 289
€ 1000
€ 392
NO*
7-10
€ 450
NO*
YES
NO*
3
7-30
30
€ 1.040
€ 400
€ 735
YES
1
€ 300-€ 360
YES
YES
3
3
€ 100-€ 125
€ 250
NO*
14
€ 330
YES
YES
14
21
€ 330
€ 222
YES
1
€ 54
AVERAGE
12 days
€ 485
Notes
(1) All figures on cost and time based on information provided by Member States which have not been fully
validated. Calculation methods as described in Commission Staff Working Document SEC(2007)129.
*NO means that the services offered by the one-stop-shop are not sufficient to consider it a fully functional
one-stop-shop.
**Cost: numbers in bold for countries with cost above the threshold.
Member States are increasingly integrating the "think small first" principle into the
policy-making process. While only few have set up a specific body to represent
SMEs interests, almost all of them consult SMEs representatives. A number of
Member States (for example BE, DK, ET, MT, NL, SE, FI, UK) evaluates or is
planning to evaluate the impact of new legislation on SMEs. Examples of specific
provisions to alleviate the administrative burden on SMEs go from the simplified
conditions for accessing subsidised finance (FR) to longer payment time for VAT
(DK) or development of dedicated electronic services (FI). However, further national
efforts are needed in the application of this principle in order to meet the specific
needs of micro and small enterprises but also to maximise its positive contribution to
the target of reducing by 25%, at EU level, the administrative burden by 2012.
Awareness of the need to enhance entrepreneurship education at school is
constantly increasing in the Member States and in the last couple of years new plans
and individual initiatives have been flourishing in this area. However reforms
planned in a number of countries are sometimes described in rather generic terms and
their implementation in practice will have to be monitored. In a few Member States,
entrepreneurship is already a recognised objective of the education systems and is
embedded explicitly in national framework curricula (ES, FI, IE, CY, PL, UK) but
implementing means (teacher training, teaching materials) still need to be stepped up.
EN
46
EN
In some cases, elements of entrepreneurship are found horizontally throughout the
curriculum, or entrepreneurship forms part of economic subjects (LV). Other
Member States are starting to implement or are planning reforms in the same
direction. However, Member States where entrepreneurship is well established in the
curricula are still a small minority.
Almost all Member States have already taken or are currently introducing measures
to raise SMEs’ awareness on public tenders and to provide them with easy access to
tender information (single electronic access points or electronic procurement,
training and counselling, etc.). However, only a handful of Member States report on
more specific measures to help SMEs’ to participate in public procurement (use of
prior information notices, dividing contracts into small lots) and only very few have
put in place a strategy or specific measures to help SMEs to participate in public
procurement (e.g. UK, IT, FR). A study published by the Commission in November
200727 showed that 42% of the value of public procurement contracts above the EU
Directives’ thresholds goes to SMEs. This share is smaller than the economic
importance of SMEs in the EU, but above the SME quota for federal public
procurement in the US (23%).
Since 2005, some limited progress has taken place in the simplification of procedures
for recruiting a first employee. Overall, the average number of mandatory external
contacts (social security organisations, tax offices, labour offices, etc.) has been
reduced from 3 to 2.5 and the average number of procedures (filing forms, etc.) from
3.5 to 3. However, the target of having no more than one public administration point
in that process is still far and the situation varies significantly from a Member State
to another. Only three Member States (e.g. ES, MT, and PT) have a special one-stopshop system for recruitment of first employee or one-stop-shops for start-ups that can
also take care of recruitment. Several other Member States have procedures that are
so simple that only one contact with a public administration is required (e.g. BG, FR,
IE, LV, LT, SE). In others, at least the social security registration is organised as a
one-stop-shop or one-window-system, i.e. one branch of the social security collects
the registration and distributes the information to the other branches (e.g. DE, SK or
the UK). BE is a special case where "social secretariats" take care of all employment
related procedures for businesses, including the registration of new employees etc.
but have to be paid by businesses.
2.3.4.
European infrastructures in the transport sector
In 2007 the rate of progress towards the key objective of completing the TransEuropean transport network has been high. The measures taken jointly by the
Member States and the Community in support of the TEN-T and the 30 priority
projects in particular, have resulted in an annual investment (EU 27) of € 40 billion,
with approximately € 20 billion of this going to priority projects. PP 4, the Highspeed railway axis east (section Paris-Bodrecourt) and PP6, the dedicated rail freight
Betewe line, were completed during 2007, and PP 2 the High-speed railway axis Paris-Brussels-Cologne-Amsterdam-London is now almost complete, while
27
EN
Evaluation of SME Access to Public Procurement Markets in the EU, Final Report by GHK and
Technopolis, available at:
http://ec.europa.eu/enterprise/entrepreneurship/public_procurement.htm
47
EN
substantial progress has been made on other projects including PP 3 the High-speed
railway axis of south-west Europe - Madrid-Barcelona, Madrid-Valladolid.
Looking to the future, the Community institutions support the introduction of a
higher Community co-financing rate, in particular for cross-border projects, for those
having a transit function, or those involving the crossing of natural barriers. The
Multi-annual Programme will allocate between 80 and 85 % of the TEN-T financial
reference amount of € 8,013 million for the period 2007-2013 to projects presenting
the highest value to the Community (in particular cross-border projects), to the
deployment of the European rail signalling system ERMTS/ETCS and to the
development of Intelligent Transportation Systems. In the same period, new cohesion
policy programmes plan to invest for the development of railways more than EUR 22
billion and more than EUR 17 billion for the development of TEN-T motorways.
3.
IMPLEMENTING PRIORITIES FOR ACTION
The potential contribution of microeconomic structural reforms to the European
Union's long-term economic performance through achieving stronger productivity
growth is well established in the theoretical and empirical literature. An important
part of the task to enhance total factor productivity growth consists of bringing about
more propitious framework conditions. Well functioning markets and competition
are a key condition for higher R&D spending to translate into innovation and better
results in terms of productivity.
The previous section summarises the evidence on the implementation of microeconomic reforms since 2005, drawing on Member States' implementation reports
throughout the first cycle of the strategy for Growth and Jobs. It shows that the types
of reforms engaged by Member States in the last years have the potential to
strengthen Europe's productivity performance and thereby make a key contribution to
the objectives of the growth and jobs strategy. Full implementation of the reforms in
the microeconomic area remains the most important condition for realising their
potential in terms of productivity growth.
The analysis shows that significant progress has been made in a number of areas with
the implementation of the microeconomic reform agenda. Around half of all Member
States have shown a strong policy response in the areas of R&D and ICT, and most
others have at least made some progress in these areas. Regarding the aim to unlock
the business potential, particularly of SMEs, where concrete objectives have been
targeted for end-2007, a clear majority of Member States have shown at least a fairly
good or strong policy response. About a third of Member States show a strong policy
response with regard to energy and climate change. However, the uneven
implementation record across Member States implies that progress overall could still
be better.
There are also important policy areas where overall progress across Member States
has been not satisfactory and where significant implementation deficits remain
despite the strong performance of some Member States. In the area of R&D, current
efforts will probably not be sufficient to reach the established target. In the area of
competition policy only few Member States have registered a good policy response,
while overall progress has been limited. At the start of a new cycle these
EN
48
EN
implementation deficits give rise to concern. Member States commitment to the full
implementation of their National Reform Programmes is important for the credibility
of the strategy overall. It will be important to take any implementation deficits from
the first cycle into account when defining the ambition of the National Reform
Programmes for the new three-year cycle.
• In the area of R&D, innovation and industrial policy, Member States have given a
high priority to the measures to enhance research and innovation. While all
Member States have set a target for research spending and despite progress made
in many Member States, important implementation gaps remain overall. The
slight decline in R&D expenditure in 2006 after broadly stagnating levels in the
years before is a sore reminder that one of the flagship objectives of the renewed
Lisbon strategy—the 3% R&D expenditure target—may not be reached by 2010.
More than insufficient public spending on R&D, this outcome reflects weaknesses
in the existing framework conditions and in policy design. Going forward it will
therefore be crucial to set up coherent R&D and innovation strategies where they
are not yet in place and to address issues such as innovation in services
organisational innovation, intellectual property rights, ensuring the availability of
qualified researchers, and overcoming skills shortages.
• Regarding ICT, implementation gaps remain regarding the availability of digital
content and related policies (IPRs), digital skills requirements, standardisation,
next generation networks, and security of electronic payments, privacy, and
interoperability.
• The implementation record in the areas of functioning markets and competition
policy has been mixed across the Member States. While there is clear progress
with transposition of internal market legislation, more attention to the quality of
transposition, implementation and enforcement of internal market legislation is
needed. More also needs to be done to ensure the good functioning of public
procurement markets and, at the Community level, the development of a well
balanced framework for intellectual property rights. The integration of financial
markets, in particular in the area of retail financial services, has so far remained
inadequate.
• State aid and competition in professional services have not been prominent on the
Member States' reform agenda. Particular implementation deficits remain in the
area of external openness, professional services and some network industries, in
particular gas, electricity, and rail. It is telling that the more country-specific
recommendations and points to watch have been proposed in the field of
competition policy than in any other micro-economic area. This shows that this
policy area constitutes a key challenge for most Member States also for the new
three-year cycle.
• In the area of Better Regulation, the main progress has been reaching consensus
on prioritising this policy area and in creating the necessary tools to serve it.
However, implementation has been slow and the objective of embedding Better
Regulation in every-day policy making is far from secured. Despite the recent
progress, there is a need for more action to achieve the SME start-up targets set by
EN
49
EN
the 2006 Spring European Council. Improving SMEs’ access to finance and
mainstreaming of SME issues into other policy areas deserve more attention.
• Implementation of policies to address climate change and sustainable use of
resources has been insufficient. Also, more action is needed to improve the
interconnections of national energy networks and to integrate the energy markets.
In the area of transport policy, interoperability and interconnection of the national
networks remain priorities, while not enough has been done to promote the
efficient use of infrastructure.
A general conclusion of this stock-taking exercise is the recognition that policy
measures in the different policy areas need to be better integrated, so as to maximise
their positive externalities. This does not apply only to the micro-pillar policies –
where an integrated approach to the ‘knowledge triangle’ of research, innovation and
education policies is called for – but also to the reform design across the three pillars
of the renewed Lisbon strategy, i.e. the macro-economic, micro-economic and
employment policy areas.
In order to ensure continued progress toward bringing about a better productivity
performance in the European Union, it will be important that Member States in their
National Reform Programmes for the new three-year cycle of the strategy take
account of the microeconomic implementation deficits of the first cycle that have
been outlined here. R&D and innovation policies as well as enhancing competition,
market functioning and sustainable use of resources will remain key challenges in the
period ahead both for both most Member States and the European Union as a whole.
A sustained effort will be needed to narrow the EU's productivity gap vis-à-vis the
global top performers.
EN
50
EN
III. THE COMMISSION DRAFT OF THE JOINT EMPLOYMENT REPORT 2007/8
Summary and conclusions
The favourable economic environment has left positive traces on the European labour
markets. 2006 saw employment–intensive growth for the first time in almost a decade. The
laast two year have seen the creation of almost 6.5 million new jobs and unemployment has
reached the lowest levels in years. Part of this is cyclical but there are good reasons to believe
that the European Employment Strategy and the integrated Lisbon strategy are showing
results and that structural reform are starting to pay off. One of the most obvious sign of this
is the recent decline in structural unemployment.
Despite the relatively favourable labour market outlook a number of serious concerns persist
The most pressing is youth unemployment that continues to be a severe problem in many
Member States. Young people have not benefited proportionately from the economic
upswing; in 2006 they still remained exposed to unemployment more than twice as much as
the overall work force. Today nearly one in six young people in the EU, or almost 7 million,
still leave the education system prematurely and there has been virtually no increase in levels
of educational attainment.
Further efforts are needed to reach the European employment targets. Moreover, the
responsiveness of European labour markets to the challenges of globalisation and ageing
remains insufficient. Structural unemployment still remains too high and more needs to be
done within comprehensive flexicurity approaches to improve the functioning of European
labour markets and to facilitate transitions with the aim of eliminating barriers to
employment.
It is very encouraging that about half of the Member States have now developed or are
developing comprehensive flexicurity approaches but the performance within the various
underlying components is less positive. Labour market segmentation remains a significant
problem in many Member States and the focus of the policy response still tends to be more on
easing labour market regulation for new entrants and facilitating more contractual diversity
than on reforming existing mainstream labour legislation. Reforms of social security systems
have tended to be limited to pension reforms. Active labour market policies, although
becoming more personalised, have been subject to a decline in expenditures since 2000 both
as a share of GDP and per worker. Finally, participation in lifelong learning in the EU barely
increased between 2005 and 2006, while it has actually decreased in half of the Member
States, and adult training remains unevenly distributed. These figures are disappointing and
worrying for the future. A substantial rise in the investments in human capital better targeted
towards labour market needs is essential to close the productivity gap with our key global
competitors.
Europe must continue labour market reforms for more and better jobs. People not working
and in precarious work need special attention. An ageing Europe in an intensely competitive
world needs more people working more productively.
EN
51
EN
1.
PROGRESS
STRATEGY
1.1.
Full Employment
IN ACHIEVING THE OBJECTIVES OF THE
EUROPEAN EMPLOYMENT
Employment targets
Helped by the strong economic expansion employment growth picked up in 2006
and recorded the strongest increase since the nineties with nearly 4 million jobs being
created during the year and the overall employment rate climbing to 64.3%. This
employment expansion notably took place in an environment of accelerating
productivity growth, not seen in a decade. Progress has been widespread but was in
particular driven by a handful of Member States. Labour market performance is
projected to continue at least next year and should lead to further progress towards
reaching the employment targets.
Despite the positive performance in 2006 Europe remains short of the 2010
employment targets. The current employment rate implies that another 20 million
jobs will have to be created by 2010 if the target is to be reached. Forecasts already
suggest that another 5.5 million new jobs could be created by 200828. With sustained
efforts, the 2010 overall target of a 70% employment rate becomes closer.
Older workers still represent one of the largest target groups for raising employment.
With a current employment rate of 43.5%, (6.5 pp from the 2010 target), there is still
significant untapped potential among older workers and their numbers will continue
to grow during the coming decades. Regarding gender, the employment rate for
women has increased in almost all Member States reaching 57.2 % in 2006, and
stands relatively close to the 2010 target of 60 %. With an employment rate of only
50%, people with disabilities also remain a potentially large untapped resource of
additional labour supply.
Unemployment dropped significantly from 8.9% in 2005 to 8.2% in 2006 and almost
all Member States contributed to this trend. Both women and men benefited as the
unemployment rate fell to respectively 9% and 7.6%. A notable indicator of the
robustness of the current labour market performance is that the long-term
unemployment rate fell for the second year in a row, from 4% to 3.6%.
Youth unemployment remains a severe problem in many Member States. The overall
youth unemployment rate did decrease over the last year but this was mainly
attributable to significant reductions in a small number of Member States. The
unemployment rate amongst young people has actually increased since 2004 in a
number of other Member States. So far young people have not benefited enough
from the favourable economic environment; they remain more than twice as exposed
to unemployment as the overall work force. Finally, many Member States still fall
short of the new activation targets. Despite also being a Lisbon priority since 2006,
and given the importance of the young generations in addressing the future
demographic challenges, these trends remain disappointing.
28
EN
European Commission, Economic forecast, Spring 2007.
52
EN
Structural reforms
There are a number of signs that structural labour market reforms in recent years are
having an impact29. The strongest evidence however, is the significant reduction in
structural unemployment throughout Europe30. While the period 1997-2003 was
characterised by rather stable and high structural unemployment, it has been reduced
by about one third since 2004 and is forecast to drop further in 2007. The level,
however, is still significantly higher than that of our principal competitors.
Together this points to the existence of significant barriers to employment. European
labour markets are not sufficiently responsive to the challenges of globalisation and
ageing. More needs to be done to improve their functioning and to facilitate labour
market transitions.
1.2.
Quality and productivity at work
Productivity
One of the most striking challenges of globalisation is the enhanced requirements for
productivity gains in order to ensure sustainable employment growth. Since the
eighties, average labour productivity growth in the EU has been decreasing from
around 2% a year in the second half of the 1990s, to around 1% between 2001 and
2003. Over the same time frame the US has sustained productivity growth rates of
some 2% on average. Since 2003 however, there has been evidence that the decline
in productivity growth in Europe is being reversed.
Table 1. GDP, employment and labour productivity growth (annual averages)
1997-2000
2001-2003
2004-2006
EU27
US
EU27
US
1. GDP
3.1
4.2
1.5
1.6
2.4
3.2
2. Employment
1.1
2.1
0.3
0.0
1.1
1.6
3. Labour Productivity (per worker)
2.2
2.1
1.1
2.0
1.5
2.1
2.1
1.6
2.7
1.4
2.3
4. Hourly Labour Productivity
EU27
US
One important means of improving labour productivity is through investment in
human capital, in particular by establishing comprehensive strategies for lifelong
learning throughout the life cycle. In this regard, Europe is behind schedule.
29
30
EN
One of them is the development in wages. In the current economic upturn, there has been no significant
pressure on wages which has been typical for cyclical driven expansions.
European Commission, AMECO database, DG ECFIN.
53
EN
Graph 2: Employment rates and participation in lifelong learning 2006
Employment rate, percent
80
DK
75
NL
SE
UK
70
PT
CZ
65
CY
EE IE
DE
LV
LT
FRLU
EL
60
BG
RO
55
AT
FI
SI
ES
EU27
BE
SK
HU
IT
PL MT
50
0
5
10
15
20
Sour ce Eurost at
25
30
35
Participation in Lifelong learning, percent
SE: 2005
The graph indicates that there may be some correlation between employment rates
and participation in lifelong learning. The graph might also indicate that to achieve
very high employment rates it is necessary to exceed a certain level of participation
in lifelong learning.
Clear progress has been made in recent years on reducing early school leaving, but in
2006, almost 7 million young people still left education prematurely. Progress is too
slow in increasing youth educational attainment levels; figures have only improved
moderately since 2000. The level of adult participation has remained stable or has
even decreased in 20 out of 27 Member States since 2004. Participation levels are
particularly low in Southern European countries and in most of the new Member
States. The lowest participation rates throughout the EU continue to be those of older
workers.
It is imperative that Europe steps up its investments in human capital31. Adequate
incentives and cost sharing mechanisms for enterprises, public authorities and
individuals must be developed.
Quality at work
Progress in the quest to increase quality at work again remains mixed32 and
implementation of policies to this aim is limited. In-work poverty still affects 8% of
workers in the EU. While 2006 saw some further improvements in youth education
31
32
EN
Currently US and Japan are for example spending twice as much as the EU on tertiary education.
For details of the 10 dimensions of quality at work see: Improving quality in work: a review of recent
progress - COM(2003) 728, 26.11.2003.
54
EN
levels there has been limited progress in other elements of quality at work, including
in particular the transitions from insecure to secure jobs, and the issue of reducing
labour market segmentation, the level of which is currently on the rise in many
Member States. Adult participation in lifelong learning, one of the key indicators for
quality at work shows stagnating or even declining trends.
1.3.
Social and territorial cohesion
Social cohesion is crucial for sustainable employment growth. In 2007 in the
framework of the open method of coordination in social protection and social
inclusion, Member States have continued focusing their policies on fighting and
preventing child poverty and promoting the active inclusion of people furthest from
the labour market through an approach combining income support with activation
policies.
In spite of the positive economic environment, in most countries there was no
reduction of relative poverty and employment rates increases for vulnerable groups
have been more limited than those for the labour force in general. In the EU, the
percentage of adults and children living in jobless households has remained
unchanged since 2000 at nearly 10%. Social protection reforms should in particular
improve, where required, the adequacy of social benefits linked to employment
activity. This is a pre-condition for a well functioning flexicurity approach.
The favourable economic environment has had significant impact on the magnitude
of regional disparities which continued to narrow in 2006, especially as concerns
unemployment. It is still characteristic that regional disparities on unemployment are
markedly larger than on employment, but the former has been reduced by one third
since 2001. Although this trend is observed in most Member States there is a handful
recording a strong negative trend in regional disparities.
2.
IMPLEMENTING PRIORITIES FOR ACTION
2.1.
Attract and retain more people in employment, increase labour supply and
modernise social protection systems
Promote a lifecycle approach to work
Still only very few Member States have a comprehensive lifecycle approach to work.
There has been some recent progress in encouraging active ageing strategies
especially through restricting eligibility conditions, while compensating for
particularly demanding or hazardous jobs, by increasing incentives to work longer
for employees and employees (AT, FR, ES, DK), by enhancing work opportunities
for older and particularly disabled workers and by improving working conditions
while and providing opportunities for skills upgrading and retraining. The current
average exit age from the labour market (60.9) still remains well below the 2010
target.
The progress in the field of gender equality has been mixed. The female employment
rate has increased strongly but is still under 50% in 4 Member States (EL, IT, MT
and PL). Only some countries (AT, CY, FR, EL, IE, LV, MT, PL, SE, SI)
EN
55
EN
systematically use statistics broken down by sex for reporting on employment. The
gender pay gap shows no sign of reduction over the last few years and is still at 15 %
overall in the EU. Few countries have taken concrete actions in this field (AT, BE,
FI, FR, LU, NL, SE, SK, UK) and no new targets have been set following the
Commission Communication on gender pay gap.
Box: Promoting the labour market integration of young people remains a key
challenge
Only about half of the Member States have seen an improvement in youth
unemployment between 2000 and 2006. There are still 17.5% of young men and 13.2
% of young women leaving school with at most a lower secondary education. Only
six Member States have reached the target of no more than 10%.
Despite relatively poor results, increased efforts to fight youth unemployment are
reported by many countries. Policy measures are pursued along 4 axes: Firstly,
through improved vocational education and training pathways (AT, BE, LU),
specific guidance and pathways for at-risk school leavers (BE, FR, DE, LU) and
specific contract schemes with a training component (LU). Secondly, through
intensified and personalised guidance and job-search support (PT) and creation of
employment pathways (MT). Thirdly, through reduction of employers' social security
contributions (BE, HU, SE), tax promotion for apprenticeship places (AT, FR), wage
support for recruitment of long-term unemployed (DE). Fourthly, through
strengthening the conditionality of social or unemployment benefits (CZ) and
reduced taxation of students' jobs (FR)
At the 2006 Spring European Council Member States agreed that they should
provide a "new start" for the young unemployed within 6 months by 2007 and 4
months by 2010. . According to the most recent EU data, only 15 countries manage
to have a timely new start offered to at least two thirds of young unemployed. In a
small lead group of countries nearly all young unemployed are offered a new start
during their first months of unemployment (AT, FI, SE). Seven countries have
reached an 80-90 % coverage (BE, FR, DE, IE, LT, NL, ES) while 4 countries only
provide a 70-80% coverage (HU, LV, LU, PT). For the remaining countries no EU
data are available.
The issue of reconciliation between work and private life is gaining some impetus in
Member States, mostly through the commitment to improve the provision of
childcare facilities (AT, DE, EL, LU, NL, PT, UK). However, many Member States
are far from reaching the childcare targets and most do not even refer to them in their
national strategies.
Ensure inclusive labour markets, enhance work attractiveness, and make work pay
for job-seekers, including disadvantaged people, and the inactive
Efforts have increased in integrating people at the margins of the labour market and
in an "active inclusion" approach. Low-skilled job seekers are subject to specific
activation measures or support for placement from the employment services (UK),
while financial incentives are created for employers to hire them (BG, DE) and train
them (NL). Some measures aim at providing specific training opportunities,
organised either through public employment services or on-the-job (AT, LT, BG, EE,
EN
56
EN
BE). A number of Member States have taken steps to develop and improve the
programmes for basic literacy and numeracy of adults (FR, DK).
Specific training measures and language courses are being offered to migrants (SE,
CY, DK, ES, AT, BE) and activation measures coupled with support from the
employment services (DK, ES, DE, AT, EE, UK) are specifically aimed at this
group. Wage subsidy schemes for employment of migrants and their descendents
have been introduced in SE and DK. Some Member States are taking steps to better
integrate children of immigrants into the educational system (LU, NL), while others
with large shares of immigrants are launching specific programmes for geographic
areas where migrants are highly concentrated (FR, UK). In a number of countries,
immigration is seen as an important element in answering labour market needs (ES,
DK, IE), and some Member States are planning to develop plans to attract highly
skilled migrants (NL, CY, DK, LT), and to simplify the procedures for work and
residence permits in sectors where there are labour shortages (SE, IE, AT, FI, EE,
MT, BE, CY, DK, ES, LU, SI).
Some Member States have increased spending and raised the effectiveness of their
active labour market policies (AT), notably by tightening eligibility conditions for
unemployment benefits ( EL), increasing the effectiveness of job-search assistance
(BE, SK), providing targeted training for the unemployed (AT) and introducing "inwork" benefits (SE). Some Member States also subsidize self-employment (DE, LT,
EL, SK, LV). An increasing focus is on the individual responsibility of job seekers
(BE, MT, NL, SI, LU, UK, SE, DK, HU), with increased conditionality of
unemployment benefits, increased monitoring of their job searching activities and in
some cases their contracts concluded between job seeker and employment service
defining rights and mutual obligations. The local or regional dimension of activation
is often emphasized, and many Member States aim at improving the internal
cooperation between the different agencies serving job seekers (NL, MT, HU, IE,
SK). However, Member States rarely report on the "new start" target for
unemployed, nor the activation target for long-term unemployed.
Some countries have lowered tax wedges in order to foster participation rates and job
creation either through general tax reductions, mainly focused on cutting the taxwedge on low income groups (AT, FR, HU, SI, CZ, IT, MT, LT, SE), or by a straight
reduction of the tax burden on low incomes (DK, FI, GR,NL, SL). Also, a general
trend towards reducing social security contributions for both employers and
employees was recorded over recent years (BE, SE, MT). .
Financial incentives are being created to increase the readiness of people with a
disability to take up work (IE, EE, SK), while subsidies are given to employers to
hire disabled people and to adapt their workplace to their needs (NL, SE, PL, IE, SI,
AT, BG, LV). Measures are also being taken to establish and develop guaranteed
jobs and supported employment opportunities (CZ, DK, ES, SE, SI, DE, LT, SK).
Improve the matching of labour market needs
Adaptation to economic change is stated as a relevant priority for all Member States,
although addressed through different tools at the level of the Public Employment
Services. Different areas have seen particular investments: training and vocational
qualifications (EE, IE, SI); skills upgrades (DK, PT, CY, IE) and involvement of
EN
57
EN
employers (EL, IT, UK); taxation measures to address disadvantaged social groups
(FR, FI); targeted services according to age group, education/qualification levels and
greater exposure to the risk of exclusion (PT); extension to a personal assistance
scheme and reinforcement of services for people with disabilities (SK); work-life
balancing (CY); actions for female and senior workers (LT) or young people (PL,
SE); public-private partnerships (BE, IT33).
However, with very few exceptions (BE, IT in particular), not much progress on
trans-national mobility has been achieved across Member States. Conversely,
concerning the anticipation of skills needs, several Member States (AT, EL, LT, LV,
MT, PT) are building infrastructures to forecast labour market needs and skills
shortages.
2.2.
Improve the adaptability of workers and enterprises
Promote flexibility combined with employment security and reduce labour market
segmentation, having due regard to the role of social partners
Whereas promoting the adaptability of workers and enterprises received little
attention in the first year of the new cycle launched in 2005, a careful examination
shows that the political prioritisation by the European Council and the wide debate
since then on flexicurity has brought about an important turn-around, and increased
the awareness of the benefits that flexicurity policies can bring. Flexicurity is now
acknowledged throughout the EU as a key approach to make labour markets more
responsive to the changes resulting from globalisation, as well as to reduce labour
market segmentation.
Box 2: The increasing role of flexicurity
About half of the Member States have now developed or are developing
comprehensive flexicurity approaches, and combining efforts on contractual
arrangements, lifelong learning, active labour market policies and social security
systems. This is a considerable improvement from only a handful in 2006. Various
Member States are reporting on their intentions, including initiatives to develop
national flexicurity pathways, seeking cooperation with or input from their social
partners (for example AT, FI, IE, IT, SI, FR).
On July 23rd 2007, the Italian Government signed an agreement with the Social
Partners on social protection, employment, competitiveness and sustainable growth.
The agreement covers the areas of pensions, social benefits, contractual
arrangements, work incentives, labour cost, and training. The agreement includes
steps towards a more universal coverage of social protection, independent of the
specifics of work contracts. It envisages limiting repetitive fixed term contracts,
promoting 'long' part-time contracts and improving protection of workers on on-call
contracts.
33
EN
The Italian NRP dedicates a specific section to PES and to the assessment of their reform process over
the last 7 years.
58
EN
Flexicurity measures are being implemented along two lines. On the one hand,
measures are being pursued to strengthen flexibility in order to make labour markets
more dynamic and responsive to change, both through internal and external
flexibility instruments. SI, EL, BG, RO for instance report on how they wish to
promote part-time employment. SK, PL, LU, LT, RO introduced tele-working as a
new form of work providing more flexibility. In some countries, the regulation of
permanent work contracts is allowing for more flexibility. Changes in employment
protection legislation (EPL) for workers on open-ended contracts are relatively
scarce. In LV, BG, NL, RO, attempts are being made to simplify EPL although
political outcomes are sometimes uncertain.
Initiatives are also underway in several countries to extend security. Labour code
reviews are quite frequent (AT, BG, CY, CZ, EE, FI, FR, HU, IT, LT, LU, NL, PL,
PT, RO, SK, SI, SE) but their character seems to be gradually changing. They are
tending to move away from focusing on increased flexibility through the introduction
of new types of contracts, and towards a more balanced approach including more
security for workers on temporary contracts. MT, SK, HU, NL, CY, IE, IT are
improving social protection provisions for workers in part-time or fixed-term
contracts. The regulation of temporary agency work is a policy focus in FI, AT, BG.
Some countries aim to limit the consecutive use of fixed-term contracts (CZ, FI, IT,
NL).
A move from passive to active labour market policies is slowly taking shape (e.g. by
increasing job search support, benefit conditionality or by reforming tax and benefit
systems to "make work pay"). Transition security for workers on open-ended
contracts is not really recognised as an issue. The traditional attitude, concentrating
on job security rather than on a broader concept of employment security, is still very
much alive though policy efforts are restricted to the management of larger company
restructurings. Standardised support for all workers faced with dismissal still remains
to be implemented (SE, FI, LU).
Targeting segmentation is also an explicit goal in some countries, with for instance
ES creating incentives for employers to transform time-limited contracts into
permanent ones. On the whole, however, segmentation of labour markets remains to
be addressed, especially for female workers, still affected by low quality jobs and
weaker employment and social security. Between 2000 and 2006, the share of
workers on temporary contracts in EU27 rose from 12.2% to 14.1%, whereas the
share of workers on part time contracts rose from 16.4% to 18.1%. A high level of
undeclared labour is another aspect of segmentation (IT, EL, SK, HU, LV, LT, SI,
RO, BG). Most countries suffering from high levels of undeclared work are paying
attention to this concentrating on reinforcing labour inspectorates or other control or
surveillance measures and incentives to legalise labour relations (HU).
Policies aiming to modernise work organisations receive rather little attention in
Member States (e.g. FI, IE, SE, LT, and LU). Innovations in working time
management are most widespread (DE, LU). Only few countries are developing a
comprehensive vision of high quality workplaces, combining greater demands and
responsibilities on workers with increased autonomy at work (FI, SE).
Ensure employment-friendly labour cost developments and wage setting mechanisms
EN
59
EN
Employment-friendly policies should support wage developments in line with
productivity in order to achieve high employment and contain inflation. Member
States are largely successful in ensuring this balance. Wage flexibility is not widely
addressed, although some countries, in cooperation with their social partners,
promote wage settlements that reflect productivity differentials at company level.
Efforts to reduce non-wage labour costs are widespread, and focus in particular on
young people and workers with disabilities.
2.3.
Increase investment in human capital through better education and skills
Expand and improve investment in human capital
Investing in human capital to achieve efficient and equitable outcomes is still a
challenge in most Member States. Total public expenditure on education as a
percentage of GDP increased in the EU between 2000 and 2003 from 4.7% to 5.2%,
but then decreased again to 5.1% in 2004. Similarly, progress on private expenditure
on educational institutions as a percentage of GDP slowed down in 2004. The
European Social Fund (ESF) will invest around 34.3 billion EUR in improving
human capital and life-long learning systems in the current programming period.
Most countries have made progress in defining comprehensive lifelong learning
strategies covering all systems and levels of education and training. It is essential that
those countries that have not yet adopted a lifelong learning strategy do so urgently.
All countries have measures addressing the areas for which EU benchmarks have
been set: reducing the number of early school leavers, and improving secondary
attainment and increasing adult participation in lifelong learning. However, most
countries have not set quantitative national targets (BE, DK, EE, EL, ES, FI, FR,
HU, IE, LT, LV, MT, NL, PL, PT, RO, SI, SK, RO have) and the modest progress
visible since 2000 is not sufficient to reach the EU targets set for 2010.
Every sixth young person (15.3%) aged 18-24 in the EU-27 still leaves school with
no more than lower secondary education (male: 17.5%, female: 13.2%) and does not
participate in any kind of education and training after this. Progress has so far not
been sufficient to reach the EU benchmark of 10% by 2010. Several countries (ES,
IT, MT, PT) still had very high levels (above 20%) in 2006 and in some countries
performance has actually worsened since 2000 (ES, LU, SE, SK). Similarly, there
has been some progress in improving upper secondary attainment levels, but not
enough to achieve the objective of at least 85% of 22-years-olds to complete at least
upper-secondary education by 2010.
Also adult participation in lifelong learning is no longer on track to achieve the EU
benchmark of 12.5% by 2010. In 2006, an average of 9.6% of Europeans aged 25-64
was participating in education and training activities (men: 8.8%, women 10.4%),
which is slightly less than in 2005. The participation rate remains lower for inactive
and unemployed persons, for older persons, and for persons with low educational
attainment. The participation of older workers is still only half of the overall rate and
adults with a high level of education are still more than six times as likely to
participate in lifelong learning as the low skilled.
EN
60
EN
A large part of the policy-making is focused on finding ways to encourage employers
to invest in training and motivate employees to take part in it. Several Member States
also see it as a particular challenge to motivate the less-educated and middle-aged
part of the workforce to acquire new skills. Many measures imply financial
incentives through tax reduction or grants for employers investing in training (MT,
EE, BG, DE, NL, IE, DK, BE, LV), but some countries have also taken initiatives to
simplify the conditions for educational leave (AT, LU). The role of agreements
among social partners about the implementation of lifelong learning strategies is
emphasized and stressed by some Member States (DK, FR, PL, NL).
Adapt education and training systems in response to new competence requirements
There is evidence suggesting that early education is receiving increasing attention in
many Member States particularly in establishing the basis for learning throughout
life and in facilitating access to education of citizens with a less favourable socioeconomic background, and migrants. Some are working on teaching content (DE,
DK), quality assessments (ES, LT), building the capacity of pre-primary teachers
(CZ) and increasing their numbers (DK, HU, MT, NL, SE, SK, UK). Others are
extending compulsory schooling to parts of the pre-primary level (CY, DK, EL, PL).
Strengthening pre-primary education is a key measure to improve the efficiency and
equity of education and training systems.
National qualifications frameworks in line with the European Qualifications
Framework are being developed by the majority of countries (AT, BE, BG, CZ, DE,
DK, EE, ES, FI, HR, HU, IT, LT, LU, LV, NL, PT, SI, SK), with a view to
facilitating international mobility as well as the transition between different
education and training sectors . They are an important means for ensuring flexible
learning pathways which are also facilitated by many countries setting up systems for
the validation of non-formal and informal learning (AT, BE, CZ, ES, IT, LT, LU,
PL, RO, SE, SK, UK). The challenge here is to move from experiment to full
application of such systems in national qualifications systems, including in access to
higher education
These improvements are running in parallel with a greater focus on learning
outcomes in learning programmes and qualifications which increases the relevance
of both vocational education and training and higher education for the labour market.
Despite renewed emphasis on apprenticeship and work-based learning, further work
must be done to improve the quality and attractiveness of vocational education and
training.
Little progress is visible in forecasting future skills and qualifications needs, despite
the efforts made by some countries to improve their infrastructures (AT, EL, LT, LV,
MT, PT). More also needs to be done by Member States to facilitate international
mobility. Mobility is still much more widespread in higher education than in
vocational education and training.
Given that the quality of teacher education is a prime factor influencing student
performance, more attention must also be given to teacher education and training, in
particular to continuing teacher training and professional development.
EN
61
EN
Finally, a number of countries are developing centres of excellence in higher
education (DE, EE, EL, FI, UK), but more needs to be done to address education
alongside research and knowledge transfer in the context of such initiatives, and to
improve university-business cooperation.
EN
62
EN
IV. THE GENERAL APPROACH USED BY THE EUROPEAN COMMISSION TO
ASSESS PROGRESS WITH STRUCTURAL REFORMS
The renewed Lisbon strategy marked a major change in the approach to the co-ordination of
structural reforms in the EU. A "partnership approach" between EU and national authorities
has been pursued to tackle the implementation gap between reform commitments and
concrete actions. Based on 24 Integrated Guidelines, Member States in a bottom up exercise
adopted National Reform Programmes covering the period 2005-07 period in which they
themselves identified their "key challenges" to raise the growth potential. There is also an
annual reporting and peer review process, which led to the adoption of policy
recommendations in February 2007 by the Council which pointed to areas where good
progress has been made as to areas where reform efforts as lagging. The recommendations
were graduated with "country-specific recommendations" (CSRs) addressed to countries on
policy areas where little progress was made and "points to watch" on policy areas where only
some progress was made.
The main focus of attention within the current Strategic Report is on implementation. While
account is taken of overall progress achieved since the re-launch of the Lisbon Strategy in
2005, the assessment mainly considers 2007 with a particular emphasis on tracking Member
States’ responses to country-specific recommendations (CSRs) or points to watch (PTWs)
adopted by the Council in April 2007. The Commission attaches considerable importance is
attached to having a robust and transparent framework for assessing progress with structural
reforms which is comparable across policy areas and Member States. The main elements of
the approach used by the Commission to arrive at its policy recommendations are outlined in
the box below.
It should be underlined that given the relatively short period since the re-launch of the Lisbon
Strategy, and given the inevitable time lags in adopting reforms and for them to have an
impact on the real economy, the assessment essentially remains a tracking exercise which
catalogues planned and enacted reform actions. There is only limited scope to evaluate indepth the significance of reform measures or to quantify their impact on growth and jobs
(although this is part achieved via a thematic review exercise on specific policy areas carried
out by the Economic Policy Committee and the Employment Committee) Over time, the
Commission will strive to enhance the evaluation exercise upgrade so that there are more
multi-annual in character, and include a greater reliance on quantitative as well as qualitative
analysis that is supported by modelling results.
The Commission services are investing considerable resources in developing robust
methodologies for systematically identifying the key policy challenges facing Member States
and for evaluating the impact of structural on growth and jobs. Much of this work is being
carried out jointly together with national authorities via a Lisbon methodology working group
(LIME) attached to the Economic Policy Committee34. Progress has already been made which
has supported the assessment in the Strategic Report. In particular, most Member States have
attached "streamlined reporting tables" to their National Implementation Reports submitted to
the Commission in October 2007: these tables systematically report the relevant reform
measures that according to the Member State contribute to the Lisbon process, and offer the
34
EN
See European Economy Research letter No 1., April 2007,
http://ec.europa.eu/economy_finance/publications/researchletter_en.htm
63
EN
potential of greater transparency on structural reform developments in real time. In addition,
the Commission has made considerable progress in developing institutional databases that
catalogue enacted structural reforms in a comprehensive and comparable manner across
Member States. The LABREF database, which records information on enacted labour market
reforms, has been backdated to 2000 and is starting to be actively used for analytical and
surveillance purposes35. The MICREF database collects similar information on reforms falling
under the microeconomic pillar of the Integrated Guidelines.
The approach used by the Commission to assess progress with structural reforms in the Strategic Report
In assessing progress with structural reforms, the European Commission took account of all relevant information
at its disposal, including the information contained in the National Implementation reports submitted to the
European Commission in 2007 along with the streamlined reporting tables. In broad terms, three considerations
were taken into account when arriving at policy conclusions, and in particular whether a CSR or PTW should be
issued to a Member States to signal the need for more progress in a specific policy area. They are:
•
the performance of a Member State in different policy areas: more weight will be attached to countries
where the starting level of performance is poor or lagging. In doing so, relevant policy and performance
indicators are considered
•
the adequacy of the policy response. This is the core element making use of information on structural
reforms gathered from Lisbon missions and the National Implementation Reports. In doing so, the
degree of responsiveness (whether a policy response has been approved and passed all the necessary
legislative/administrative procedures to start being implemented) is considered, the significance of a
policy measure (e.g. do they address core underlying problems, does the reform imply a significant
change relative to existing institutional settings, has an adequate allocation of financial and personnel
resources been foreseen to implement the policy, are targets/goals realistic), and the degree of follow-up
(e.g. whether the design of the policy response foresees monitoring mechanisms);
•
the relative priority of a policy area in terms of its potential contribution to growth and jobs in the
country concerned. The aim is to have a rounded view on the overall economic policy challenges
facing a country, and to concentrate on those policy areas where countries are especially lagging behind
the best-performer and which can contribute most to raising growth and jobs. In most instances, the
priorities are well defined in the key challenges identified by Member States.
Overall, by looking at performance, policy responses and priorities, a robust and transparent assessment is
arrived at which is comparable across policy areas and Member States. Naturally, all other relevant qualitative
considerations, including wider political issues, are also taken into account.
35
EN
For access to the LABREF database, follow:
http://ec.europa.eu/economy_finance/indicators/labref_en.htm
The information in LABREF has been used to feed into economic analysis on the impact of labour
market reforms, see papers from a Commission conference in March 2007on tracking and evaluating
the impact of labour market reforms in Europe
http://ec.europa.eu/economy_finance/events/2007/events_brussels_1403_en.htm .
64
EN
V. THE EUROPEAN GROWTH INITIATIVE
The European Action for Growth (or European Growth Initiative36) is an action plan endorsed
by the European Council in December 2003. It aims at stimulating the long-term growth
potential and the innovative capacity of the European Union by mobilising investment in
transport, energy and electronic communication networks, and in research, development and
innovation, with a particular focus on growth-enhancing technological areas.
At the European level, the initiative is supported by non-financial measures to improve the
regulatory, administrative and financial environment for investment, as well as Community
financial support, lending from the European Investment Bank (EIB) and venture capital from
the European Investment Fund (EIF)37, and innovative financing tools to mobilise private
investment. At the Member States' level, it relies on supporting national actions to promote
private investment, and on significantly redirecting public funding towards the areas of the
initiative with a special emphasis on infrastructure investments.
In order to focus efforts on key investment projects of European interest, the Commission
identified a list of TEN infrastructure projects and R&D technological areas, considered as
sufficiently mature to be turned into action in the short run. This process was carried out in
close collaboration with the EIB and was based on the explicit intentions of the Member
States. The selection criteria included, in addition to project maturity, their trans-frontier
dimension, the impact on growth and on innovation in an enlarged EU, and benefits for the
environment. The "Quick Start programme" was endorsed by the European Council in
December 2003. It was foreseen that the list might be updated, in the framework of the annual
cycle for reporting to the Spring European Council, if other projects fulfilled the same
criteria38.
The Commission and the EIB were asked to provide a mid-term evaluation of the initiative by
the end of 2007, on the basis of the following criteria: (i) effects on growth; (ii) impact on the
internal market and cohesion in the enlarged EU; (iii) mobilisation of private sector capital,
(iv) acceleration of the implementation of TENs and innovation and R&D projects including
environment projects; (v) progress in reducing regulatory barriers; (vi) the impact on the
environment and employment."
36
37
38
EN
This is an extract of the Commission Staff Working Paper "Mid-term review of European Action for
Growth - Stocktaking on progress of the implementation of the European Action for Growth" SEC(2007) 1695, 11.12.2007
The European Investment Fund (EIF) is part of the EIB group
The 31 Quick Start projects in the area of transport and the 17 projects in the area of energy are key
sections of the TEN-T and TEN-E priority projects whilst the 8 projects related to electronic
communications and knowledge reflect R&D, innovation and eEurope priorities within the Lisbon
strategy for Growth and Jobs.
65
EN
1.
THE IMPROVED FRAMEWORK FOR INVESTMENT – PRELIMINARY RESULTS
1.1.
Developments at European level
Almost all legislative measures identified by the Growth Initiative as necessary to
improve the conditions for investment have been adopted and have entered into force
(e.g. the TEN guidelines and financing rules, the Euro-vignette and cross-border
mergers directives). They aim at facilitating investment in large-scale or complex
cross-border infrastructure projects, and in research and innovation partnerships.
The Growth Initiative has given some initial impetus to set up new instruments and
initiatives coordinating better funding from public sources and encouraging private
investment in networks and R&D and innovation (e.g. nominating European
coordinators for transport and energy priority projects, establishing Joint Technology
Initiatives on nano-electronics and hydrogen and fuel cells).
The areas highlighted by the Initiative have benefited from significant funding over
2000-2006 and from increased budgets for the 2007-2013 period via the TEN-T and
TEN-E programmes, the Structural and Cohesion funds, the 6th and 7th research
framework programmes and the eTEN and Competitiveness and Innovation
Programme.
The EIB has been actively engaged in supporting the Growth Initiative as well as the
Lisbon reforms through increased lending facilities, the strengthening and
development of financial instruments (e.g. the TEN investment facility), and the
provision of technical expertise.
The EIB and the Commission have jointly developed new financial instruments, at
least in part as a result of the commitments made in the Growth Initiative (e.g. the
Loan Guarantee Instrument for TEN-transport LGTT, the Risk Sharing Finance
Facility RSFF and the JEREMIE and JASPERS funds). The Member States look
forward to using these new instruments to leverage private investments and improve
access to risk capital.
1.2.
Developments at national level
20 Member States replied to the Commission information request on the Growth
Initiative and related infrastructure investments (Austria, Belgium, Bulgaria, Cyprus,
Czech Republic, Denmark, Finland, France, Germany, Greece, Ireland, Italy,
Lithuania, Luxembourg, Poland, Portugal, Slovak Republic, Spain, Sweden, and the
UK). The information provided is mostly qualitative but gives an insight on the
national investment context onto which the Growth Initiative has developed its
effects. As public infrastructure spending is commonly included in long-term
strategies, it was difficult to analyse the influence of the Growth Initiative with a
limited hindsight.
Public investment in transport infrastructure has accelerated in recent years in most
Member States.
Investment in energy infrastructure is mainly market-driven. The need to modernise
energy infrastructures and to better integrate national networks into the EU market is
EN
66
EN
prompting investments in most Member States. The promotion of energy efficiency
and renewable energies, a new priority in many countries, also steadily necessitates
high investment level. Increased demand for mobile communication services enables
the private sector to invest in upgrading the networks to provide innovative high
speed mobile services.
Investment into ICT networks serving scientific needs presenting important public
good characteristics continue to be partly financed by national budget. The Member
States have renewed their commitment to develop spatial technologies from which a
wealth of applications with commercial or public services purposes will grow.
Hydrogen technologies and nanoelectronics have also gained a priority position in
the list of projects up for public R&D investment at the national level and national
research capacities in these key areas for long term growth and sustainability have
been reinforced.
1.3.
Progress on the implementation of the Quick Start Projects
The improved enabling framework both at the European and the Member States level
including the availability of financing has had significant knock-on effects on the
implementation of the Quick Start projects. However, these effects fell significantly
short of expectations voiced back in 2003, namely with respect to transport
infrastructure projects.
The Quick Start transport projects are sections of the TEN-T large priority projects
identified by the TEN Guidelines. They are spread over the entire territory of the EU,
including a majority of railway links, some road and waterway links, as well as
motorways of the sea, and the Galileo system. Some progress has been made in the
implementation of these projects, but the overall picture remains mixed. The new
instruments put in place by the TEN-T guidelines and financial regulations have
played a role in unlocking some problematic areas. The new financial instruments
have just become operational in 2007, so their effects on the implementation of
TENs and mobilisation of private investment will be felt in the coming years only.
Progress in completion of electricity connections has remained generally slow,
hampering the development of an efficient internal market, as shown in the
Commission Communication on the Priority Interconnection Plan adopted in January
2007. This overall assessment applies to the Quick Start projects as well as to other
projects of European interest. The main cause for delay is often not the lack of
financing but the complexity of coordinating planning and authorisation procedures
between several Member States. Conversely, the completion of the Quick Start gas
pipelines has proceeded satisfactorily, and none suffers from significant delays.
The substantial financial support mobilised on Quick Start ICT projects from a
combination of different sources of funding is one of the actions making tangible the
commitment of the EC and the Member States to speed up the delivery and the use of
high capacity communication networks. This continued commitment is already living
up to its expectations: creating improved access to ICT networks offering new ways
of creating and sharing knowledge for work, research and leisure.
For all Quick Start R&D projects, investments decisions proceed according to the
initial plans, while a tight integration of funding from different sources is clearly
EN
67
EN
taking place. The support to Nanoelectronics projects is in line with the original
targets of the Initiative. Adequate funding has been made available to set up the next
generation laser infrastructures key for Europe's research. Funding hydrogen and fuel
cell research at European level is playing, as expected, an important role reinforce
coordination between various sources of funding. Finally it is at least partly due to
the Growth Initiative if the critical mass of public and private resources (both
financial and technological) has been quickly and timely assembled to finalise the
design of the GMES satellites and to install a new spatial launch site.
2.
THE GROWTH INITIATIVE WITHIN THE LISBON STRATEGY FOR GROWTH AND JOBS
The European Growth Initiative operates on an instrumental level but within the
Lisbon Strategy's comprehensive approach.
The measures proposed in the European Growth Initiative are now being brought at
full speed by the Lisbon Strategy for Growth and Jobs. To name but a few examples,
improving the patent system in Europe, as longed for by the European Growth
Initiative, was taken over in 2005 as a key policy issue of the Strategy for Growth
and Jobs. The i2010 initiative, a European Information Society for Growth and
Employment addresses the challenges also mentioned in the European Growth
Initiative, but it is fully developed under the Lisbon Strategy. The European Growth
Initiative emphasised the need for updating the rules applied to State aid for R&D
and innovation to make them more conducive to investments. The new framework on
state aid for R&D and innovation has been adopted under the impetus of the Lisbon
Strategy where state aid control is a prominent issue. The Growth Initiative hinted at
the need for measures on risk capital investment to improve SMEs' access to finance
especially for innovation. These measures have actually been launched under the
main thrust of the Lisbon Strategy. In future, the instruments and projects of the
Growth Initiative will be merged even further in the Lisbon Strategy, with
corresponding repercussions for reporting on progress of implementation.
EN
68
EN
Scaricare