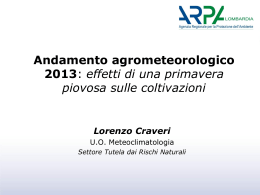
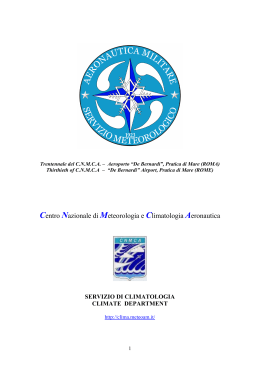
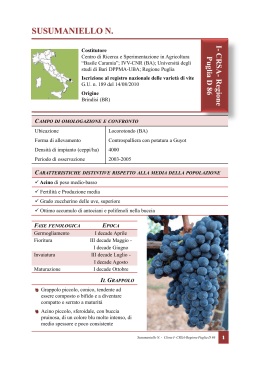
AERONAUTICA MILITARE
Centro Nazionale di Meteorologia e Climatologia Aeronautica
SERVIZIO DI CLIMATOLOGIA
Temperature, precipitazioni e attività
elettrica del mese di Maggio 2007 in
Italia.
Temperatures, precipitations and
electrical activity during May 2007 in
Italy.
I
dati
provenienti
da
87
stazioni
meteorologiche dell’Aeronautica Militare e
dell’ENAV sono stati utilizzati per confrontare
i valori medi mensili di Maggio delle
principali grandezze meteorologiche con i
valori della climatologia riferita al trentennio
1961-1990. Vengono evidenziati inoltre i
fenomeni di scariche elettriche verificatisi in
Italia e rilevati dalla rete del Servizio
Meteorologico dell’Aeronautica Militare.
Weather data from 87 meteorological stations
belonging to Italian Air Force and to ENAV
have been used to compare monthly mean
values of May of the main meteorological
parameters to climatic values referred to the
period 1961-1990. Electric discharges
occurred in Italy, detected by the Italian Air
Force Meteorological Service network, are
showed.
Temperature Massime. Dal grafico delle
temperature massime si evidenziano diffuse
anomalie positive di temperatura, con qualche
eccezione di lieve entità riferibile a zone
isolate. Un valore medio di anomalia è, a ogni
modo, stimabile intorno a 1.5°C al di sopra
della media del periodo, prendendo a
riferimento il CliNo6190.
Il riscaldamento più evidente si è avuto sul
medio versante Adriatico, sulla Sardegna
centro-occidentale,
nonché
sulla
parte
continentale dell’Italia centro-settentrionale. E’
da segnalare a riguardo la costa del Molise,
dove si è registrata una anomalia positiva di
quasi 4°C.
Anomalie leggermente negative, mediamente
dell’ordine di 1°C, si sono avute nel Lazio, in
una zona a Nord-Ovest al di sotto dell’arco
alpino, nella Calabria settentrionale, e nella
Sicilia occidentale.
I primi giorni del mese sono stati caratterizzati
Maximum Temperatures. The map of
maximum temperatures shows extended
positive anomalies of temperatures, with some
exception of moderate intensity to be referred
to isolated zones. A mean value of anomalies
is, however, estimated to be about 1.5°C above
the mean value of the period, referred to the
CliNo6190.
The most evident warming has occurred over
the medium Adriatic side, over the centralwestern part of Sardinia, and over the internal
part of the central-northern Italy. In this
respect it has to be signalled the coast of
Molise, where it has been registered a positive
anomaly of about 4°C.
Slightly negative anomalies, of the order of
1°C, have occurred over the region of Lazio, in
a zone at North-West under the Alps, over the
northern Calabria, and over the western Sicily.
The first few days of the month have been
characterized
by
lower
maximum
temperatures, with a warming over the
da temperature massime più basse, con un
riscaldamento sul Medio Adriatico e sulle
regioni settentrionali che ha avuto inizio
soltanto a cavallo tra la prima e la seconda
decade. I valori massimi si sono poi mantenuti
elevati un po’ su tutta la penisola fino alla fine
della seconda decade. Nella prima parte della
terza decade un ulteriore riscaldamento ha
interessato le regioni dell’Alto Adriatico e una
fascia
dell’Italia
centro-settentrionale.
Successivamente si è avuto un nuovo e diffuso
calo delle temperature massime su tutta la
penisola.
Sono da segnalare alcuni record storici di
temperature massime medie del mese (fra
parentesi si indica l’anno in cui si è verificato
il precedente estremo negli ultimi 56 anni e
l’incremento relativo in °C), registrate nelle
stazioni di Trieste con 24.6 (2001, 0.3),
Termoli con 24.4 (2005, 1) e Capo Bellavista
con 24.5 (2000, 0.1).
Temperature massime giornaliere record sono
state registrate invece nelle stazioni di San
Valentino alla Mutta (1521m) con 25.6 (1953,
0.1), Brescia/Ghedi con 34.0 (2001, 0.3),
Verona/Villafranca con 34.8 (2005, 1.6),
Sarzana/Luni con 32.4 (1986, 1), Monte
Argentario (632m) con 30.8 (2005, 1.4) e
Arezzo con 32.2 (2005, 1).
Temperature Minime.
La situazione delle temperature minime, come
illustrato nella relativa mappa di anomalie, si
presenta strettamente coerente con quella delle
massime, con una anomalia positiva
mediamente di circa 1.5°C sul territorio
nazionale. In particolare si riscontra anche
sulle minime il significativo fenomeno di
riscaldamento già menzionato che ha
interessato le regioni del medio versante
Adriatico, dove sono stati registrati, soprattutto
su Molise e Marche, picchi di anomalie
positive fino a 4°C.
Si evidenzia, tuttavia, nel caso delle minime,
una più marcata suddivisione delle penisola
nella sua parte centro-settentrionale e in quella
meridionale, in cui si sono avute temperature
minime più basse e molto vicine alla media del
periodo. In particolare, la parte occidentale
della Sicilia ha presentato una notevole
escursione termica rispetto alla norma
climatica, come pure, anche se più
medium Adriatic and over the northern regions
which has started only between the first and
the second decade. The maximum values have
been quite constant over all the peninsula, up
to the end of the second decade. In the first
part of the third decade a further warming has
interested the region of the upper Adriatic and
a zone of the central-northern Italy. Afterwards
it has occurred a new and extended lowering of
maximum temperatures over all the peninsula.
They have to be signalled some historical
records.
They have been registered some of historical
records of the mean maximum temperatures of
the month (in parenthesis they have been
indicated the year of the last 56 years extremes
and the related °C increment), measured by the
weather stations of Trieste with 24.6 (2001,
0.3), Termoli with 24.4 (2005, 1) and Capo
Bellavista with 24.5 (2000, 0.1).
Historical records of daily maximum
temperatures have been registered, instead, by
the stations of San Valentino alla Mutta
(1521m) with 25.6 (1953, 0.1), Brescia/Ghedi
with 34.0 (2001, 0.3), Verona/Villafranca con
34.8 (2005, 1.6), Sarzana/Luni with 32.4
(1986, 1), Monte Argentario (632m) con 30.8
(2005, 1.4) and Arezzo with 32.2 (2005, 1).
Minimum Temperatures.
The situation of minimum temperatures, as
illustrated in the relative map of anomalies, is
strictly coherent with that of the maximum
ones, with a positive anomaly equal, on the
average, to 1.5°C over the whole national
territory. In particular it emerges again from
the analysis of minima the significant
phenomenon of warming already discussed,
which has interested the regions of the medium
Adriatic side, where several peaks of positive
anomalies, up to 4°C, have been registered,
above all over Molise and Marche.
In the case of minima, however, it should be
evidenced a more marked division of the
peninsula into its central-northern part and its
southern part, in which they have occurred
lower minimum temperatures, very close to the
mean values of the period. In particular, the
western side of Sicily has presented a
significant thermal excursion with respect to
the climatic norm, as it has also occurred (but
more moderately) over the central-eastern part
moderatamente, si è verificato sulla Sardegna
centro-orientale.
Nel corso del mese le temperature minime si
sono mantenute all’incirca costanti, più basse
lungo le coste, con un solo innalzamento
significativo di circa 5°C, e successiva
diminuzione, da riferirsi alla prima parte della
terza decade e su tutta la penisola, eccetto che
in una vasta zona del Centro-Nord.
Non sono da segnalare record storici sulle
temperature minime.
Precipitazioni. La mappa delle anomalie di
precipitazione cumulata nel mese di Maggio
mostra una condizione complessiva sull’intera
penisola di un lieve deficit, con fluttuazioni
spaziali che sono state comprese nell’intervallo
(+1,-1) in unità dello scarto interquintile
(relativamente al CliNo 1961-‘90 del mese di
Maggio, corrispondente mediamente a 55mm).
Il deficit maggiore si è avuto sul Centro-Nord,
in particolare sulle regioni del Nord-Ovest,
rispetto al Sud e alle Isole maggiori. Sulle
prime, le anomalie sono state anche di 40 mm,
mentre al Sud le precipitazioni sono state più
vicine alla norma.
In contrasto con questo quadro, è da segnalare
una fascia dell’Italia centrale, oltre che buona
parte della costa toscana, Isola d’Elba
compresa, in cui si sono verificate
precipitazioni ampiamente più consistenti
rispetto alla norma, con scarti anche di 60mm
e oltre.
Riguardo l’andamento temporale, i primi
giorni del mese hanno visto precipitazioni
cumulate mediamente sui 50mm sul CentroNord, Sardegna compresa, la quale è stata
successivamente
interessata
solo
da
scarsissime precipitazioni sul settore nordoccidentale. In seguito, tra la prima e la
seconda decade, le stesse sono state molto
scarse su tutto il territorio nazionale, mentre
nell’ultima parte della seconda decade è
piovuto essenzialmente su Marche e Molise,
complessivamente per 50-100mm e, più
moderatamente, su parte delle regioni
meridionali. Nella terza decada, prima parte,
sono da registrare precipitazioni di un certo
rilievo (sui 50 mm) soltanto su Lazio
meridionale e Calabria centrale, con un
consistente aumento su tutto il Centro-Nord e
sulla parte tirrenica della Calabria.
of Sardinia.
In the course of the month minimum
temperatures have been quite constant, a bit
lower along the coasts, with a unique
significant warming of about 5°C, followed by
a lowering of the same entity, to be referred to
the first part of the third decade and to the
whole peninsula, except that in a large zone of
the central-northern Italy.
No historical records have to be reported
concerning minimum temperatures.
Precipitations. The map of cumulated
precipitation anomalies of May shows an
overall condition over the peninsula of a small
deficit, with spatial fluctuations comprised
within the interval (+1,-1) in units of the
interquintile range (relative to the CliNo 1961’90 of May, corresponding on the average to
55mm).
The most consistent deficit has occurred over
the central-northern regions, in particular over
the North-West, with respect to the South and
to the major Islands. Over the former,
anomalies have reached also 40mm of
cumulated precipitation, while over the
southern regions they have been closer to the
norm.
In contrast with the above picture, it has to be
signalled a band across the central Italy,
together with most of the coast of Toscana,
Elba Island included, in which more consistent
precipitations (with respect to the norm) have
occurred, with differences up to 60mm and
more.
Concerning the temporal behaviour, during the
first days of the month precipitations of about
50mm (on the average) have occurred, over the
central-northern Italy, Sardinia included,
which has been subsequently interested only
by very scarce precipitations over the northernwestern sector. Subsequently, between the first
and the second decade, they have been very
scarce over all the national territory, while in
the last part of the second decade it has rained
essentially over Marche and Molise, for a total
of 50-100mm, and, more moderately, over part
of the southern regions. In the third decade,
first part, they have been registered some
precipitations (about 50mm) only over the
southern part of Lazio and the central part of
Calabria, with a consistent increment over all
E’ da segnalare un solo record storico di
precipitazione giornaliera cumulata, registrato
dalla stazione dell’Isola di Ponza, con 28.6mm
(1970, 3).
Scariche elettriche. La mappa di densità delle
scariche elettriche evidenzia una attività
elettrica maggiormente concentrata sull’Alto
Adriatico, in particolare sulle coste del Veneto
e del Friuli Venezia Giulia. Da segnalare anche
le coste tirreniche meridionali, che hanno visto
una attività abbastanza intensa, oltre che una
fascia in direzione meridionale che ha
coinvolto principalmente le Marche.
L’attività temporalesca più intensa si è avuta
essenzialmente nella terza decade, mentre nel
corso della prima decade sono state registrate
isolate
scariche
distribuite
abbastanza
uniformemente sul Centro e Centro-Nord.
the central-northern regions and over the
tirrenic side of Calabria.
It has to be signalled only one historical record
of daily cumulated precipitation, regis. It has
been found only one historical record of daily
cumulated precipitation, as registered by the
station of Ponza Island, with 28.6mm (1970,
3).
Lightning discharges. The density map of
strokes evidences an electric activity
essentially concentrated over the Alto
Adriatico, in particular over the costae of
Veneto and Friuli Venezia Giulia. It has to be
signalled too the tirrenic side of the southern
Italy, and a narrow zone in the direction NorthSouth, which has mainly interested the region
of Marche.
The most intensive thunderstorm activity has
occurred essentially during the third decade,
while in the course of the first one they have
been registered isolated discharges, quite
uniformly distributed over the central and
central-northern regions.
Anomalie delle temperature massime
Maximum temperature anomalies
Anomalie delle temperature minime
Minimum temperature anomalies
Anomalie delle precipitazioni cumulate
Cumulated precipitation anomalies
Densità di scariche elettriche
Density of lightning discharges
I grafici delle temperature e delle precipitazioni
sono costruiti confrontando le medie mensili delle
temperature giornaliere (massime o minime) e le
precipitazioni cumulate mensili con i valori del
Climate Normals 1961-90 (CliNo: valori medi
costruiti sulle osservazioni dal 1961 al 1990). La
differenza tra il valore medio di Maggio 2007 e
quello del CliNo viene divisa per la deviazione
standard (nel caso delle temperature) o per lo
scarto interquintile Q4-Q1 (nel caso delle
precipitazioni) dello stesso CliNo.
Relativamente alle sole temperature, è possibile
quantificare
in
gradi
centigradi
l’entità
dell’anomalia
evidenziata
dai
grafici
semplicemente moltiplicando il valore mostrato
dalla barra delle intensità per i rispettivi valori
The above maps of temperatures and precipitations
compare the monthly average of daily temperatures
(maximum or minimum ones) and the cumulated
monthly precipitations to the Climate Normals
1961-90 (CliNo: mean values of weather
observations from 1961 to 1990 weather
measurements).
The difference between the parameter mean value
of May 2007 and the CliNo’s one is divided by the
standard deviation (about temperatures) or by the
interquintile range Q4-Q1 (about precipitations) of
the CliNo itself.
Concerning only temperatures, it is possible to
quantify the anomalies pointed out in the maps in
terms of centigrade degrees simply multiplying the
values shown in the colour bars of intensity by the
delle deviazioni standard. La deviazione standard,
che rappresenta lo scostamento delle misure dal
valore medio delle osservazioni (1961-1990), nel
mese di Maggio risulta in Italia mediamente pari ad
1.5 °C sia per le temperature massime e ad 1.2 °C
per le minime.
La mappa di densità relativa ai fulmini, invece,
rappresenta il numero di scariche per ogni unità di
superficie (quadrato di 10Km×10Km).
Per evidenziare i confronti specifici sulle singole
stazioni si rimanda al sito:
http://www.meteoam.it/modules.php?name=clino
standard deviations. On May the
standard
deviation, which represents the mean distance of
measurements from the parameter mean value
(1961-1990), averaged over Italy, is equal to 1.5°C
for maximum temperatures and to 1.2°C for the
minimum ones.
Besides, in the map of lightning discharges it is
depicted the number of strokes per unit surface
(10Km×10Km square).
To have more information about specific
comparisons on each station, please go to:
http://www.meteoam.it/modules.php?name=clino
Scaricare