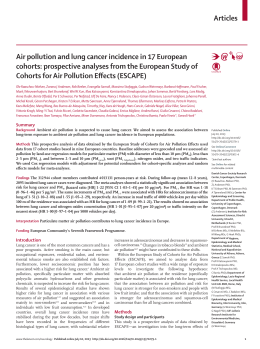
Int. J. Environ. Res. Public Health 2015, 12, 7667-7681; doi:10.3390/ijerph120707667 OPEN ACCESS International Journal of Environmental Research and Public Health ISSN 1660-4601 www.mdpi.com/journal/ijerph Article Secondary Particulate Matter Originating from an Industrial Source and Its Impact on Population Health Cristina Mangia 1,*, Marco Cervino 1 and Emilio Antonio Luca Gianicolo 2,3 1 2 3 Institute of Atmospheric Sciences and Climate, National Research Council, s.p. Lecce-Monteroni km 1.2, 73100 Lecce, Italy; E-Mail: [email protected] Institute of Clinical Physiology, National Research Council, s.p. Lecce-Monteroni km 1.2, 73100 Lecce, Italy; E-Mail: [email protected] Institute of Medical Biostatistics, Epidemiology and Informatics, Johannes Gutenberg-Universität, Mainz 55099, Germany; E-Mail: [email protected] * Author to whom correspondence should be addressed; E-Mail: [email protected]. Academic Editor: Paul B. Tchounwou Received: 13 May 2015 / Accepted: 29 June 2015 / Published: 8 July 2015 Abstract: Epidemiological studies have reported adverse associations between long-term exposure to ambient particulate matter (PM2.5) and several health outcomes. One issue in this field is exposure assessment and, in particular, the role of secondary PM2.5, often neglected in environmental and health risk assessment. Thus, the aim of this work was to evaluate the long-term environmental and health impact of primary and secondary PM2.5 concentrations originating from a single industrial source. As a case study, we considered a coal power plant which is a large emitter of both primary PM2.5 and secondary PM2.5 precursors. PM2.5 concentrations were estimated using the Calpuff dispersion model. The health impact was expressed in terms of number of non-accidental deaths potentially attributable to the power plant. Results showed that the estimated secondary PM2.5 extended over a larger area than that related to primary PM2.5 with maximum concentration values of the two components well separated in space. Exposure to secondary PM2.5 increased significantly the estimated number of annual attributable non-accidental deaths. Our study indicates that the impact of secondary PM2.5 may be relevant also at local scale and ought to be considered when estimating the impact of industrial emissions on population health. Int. J. Environ. Res. Public Health 2015, 12 7668 Keywords: health and environmental impact; air pollution; fine particulate; exposure assessment; dispersion modelling; coal power plant 1. Introduction Ambient particulate matter (PM) exposure has been associated with both short and long-term effects on mortality and morbidity for several causes [1–7]. PM has also been associated with adverse reproductive health outcomes like low birth weight, preterm birth and congenital anomalies [8–13]. Furthermore, the International Agency of Research on Cancer has classified outdoor air pollution as carcinogenic to humans (Group 1) and recently a meta-analysis of 18 studies has reported a Relative Risk (RR) of 1.09 for 10 µg/m3 of PM with aerodynamic diameters less than 2.5 µm (PM2.5), indicating a positive and statistical significant association between an increased risk of lung cancer and exposure to polluted air [14]. Questions arose regarding which particles characteristics in the PM mixture, such as size, number, source and toxicity, are responsible for the observed health effects and to what extent these effects are caused by particles directly emitted from combustion processes (primary PM) or by particles formed in the ambient air by the chemical reactions of gaseous precursors such as sulphur dioxide (SO2), nitrogen oxides (NOx) and ammonia (NH3) [15] during atmospheric transport (secondary PM). A sulphate component, in combination with others, was found to play a role as a modifying factor for the short-term association between PM2.5 and mortality in a 25-community US study [16]. Statistically significant short-term associations were found between primary PM2.5 components together with secondary sources of PM2.5 and all-cause and cardiovascular mortality in a five-year (2003–2007) case-crossover study in Barcelona, Spain [17]. This latter result confirmed findings of a previous study concerning a cohort of Californian teachers [18] and the strength of the association between organic carbon and sulphates with mortality, cardiopulmonary, ischemic heart and pulmonary diseases. Ostro and colleagues [18] discussed also several weaknesses so that the question of PM characteristics’ role in causing mortality and morbidity is still open. Since the 1970s coal power plants have been studied as significant sources of precursor gases (mainly SO2 and NOx) of downwind formation of fine particles. In cloud-free and summer daylight conditions, gas-phase oxidation of SO2 to sulphuric acid (H2SO4) by hydroxyl radicals (OH) and subsequent condensation represents the main mechanism by which SO2 is removed and PM2.5 forms [19]. Furthermore, in cooler night-time conditions, emitted sulphur and nitrogen oxides may be converted to secondary organic aerosols in the presence of nitrate (NO3) radicals. Then, besides relevant emission of SO2, emissions of NOx in the same plume and the ambient air content of OH, ozone (O3), ammonia (NH3) and volatile organic compounds (VOC) also play a role in the complex formation of inorganic (sulphates, nitrates) and organic secondary particulate matter. Since the formation of secondary PM2.5 is time-dependent, with NOx removal much quicker than SO2, two questions may arise: how large the impacted area is and how far from the source the secondary PM2.5 reaches its maximum ground level concentration. During and after the EXTERNE European project series [20], a major effort was made to understand on which scale (local, regional or Int. J. Environ. Res. Public Health 2015, 12 7669 hemispherical) atmospheric pollution caused from the thermoelectrical sector should be accounted for. Modelling the dispersion of emitted pollutants and the formation of secondary PM2.5 has been recognised as the key to addressing this issue. Since the first results from the project, it has become clear that the health damage and environmental impact might extend more than 500 km away from the sources. Nevertheless impacts and damages at local (<50 km) and regional (from 50 to 500 km) scales cannot be ignored, both for the emissions contribution from a single power plant [21–23] and from a regional thermoelectric power system [24,25]. Due to the complex non-linear gas-particle chemistry, modelling the formation of secondary PM2.5 from a single point source still presents significant challenges [23,26] and despite its contribution it is recognized as being relevant in respecting air quality standards, it is often disregarded in environmental and health impact assessments. The main aim of this work is to evaluate the long-term environmental impact of both primary and secondary PM2.5 from a coal plant and to quantify the health impact on the population at local scale of the two components by varying some assumptions of the dispersion model. 2. Material and Methods 2.1. Source Characteristics and Area of Study We considered the emissions of the coal power plant located in the municipality of Brindisi in southern Italy (Figure 1). Figure 1. Area of study. With its 4 × 660 MW groups, this power plant is one of the largest in Europe. It burns about 6 × 10⁶ tonnes per year (t/y) of pulverised coal and 1–2 × 10⁵ t/y of heavy fuel oil [27]. Emissions for Int. J. Environ. Res. Public Health 2015, 12 7670 the year 2006 were derived from the Inventario Nazionale delle Emissioni e delle loro Sorgenti‒ European Pollutant Emission Register (INES–EPER) database [28] and are: 10,175 t/y for SO2, 9282 t/y for NOx and 730 t/y for PM. Other basic information about the plant are the stack height (200 m), stack diameter (4 × 6.8 m), flue gas velocity (20 m/s), gas temperature (373 K) and flow rate of the flue gas (4 × 2,400,000 Nm3/h) [27]. The region is generally flat, with small hills (less than 200 m) in the south-eastern area and moderately high (about 500 m) in the northern part. When anticyclonic conditions affect the central Mediterranean basin, the area is dominated by a north-westerly synoptic wind (more than 50% of total wind events), intensified by the channelling effect of the Otranto Channel separating the south-eastern Italy from Albania. During weak synoptic conditions (less than 20% of total wind events), the region may be influenced by complex sea-land breeze systems caused by the diurnal heating cycle [29]. The study area 105 × 135 km2 comprises two towns, Brindisi (90,000 inhabitants) and Lecce (94,000 inhabitants), and 120 villages distributed over three provinces (Taranto, Brindisi and Lecce) with a total population of 1,188,311 individuals [30]. The area comprises industrial facilities such as a steel factory, two more power plants, a petrochemical plant and incinerators. Epidemiological studies have revealed critical situations in terms of high values for mortality and morbidity rates, consistent with environmental and occupational exposure to pollutants, for which the contributions of ports and the industrial sector have been hypothesized [31,32]. 2.2. Atmospheric Modelling Setup We used the Calmet/Calpuff modelling system to estimate the impact of the power plant emissions on air quality [33]. The modelling system is recommended by the Environmental Protection Agency for simulating long-range transport [34], it has been applied in previous power plant exposure studies [21,24,35–37] and has been already applied in the investigated area [38]. Calmet is a diagnostic meteorological model that generates an hourly three-dimensional meteorological field on a gridded modelling domain. Calpuff is a Lagrangian non-steady state puff model that allows for the handling of complex threedimensional winds in terrain as complex as the coastal areas, it can treat calm wind conditions. It includes parametrised chemistry modules for the formation of secondary sulphate and nitrate from the oxidation of the primary gas pollutants SO2 and NOx. The chemical mechanisms considered were: MESOPUFF, a five species scheme (SO2, SO4+, NOx, HNO3, NO3−); and RIVAD/ARM3, which treats the NO and NO2 oxidation process in addition to the NO2 to NO3 and SO2 to sulphate (SO4) chemical transformations. MESOPUFF is the preferred scheme of the US EPA and it is generally appropriate for most applications. RIVAD/ARM3 has been stated to be more appropriate in rural areas [33]. Constant night-time gas-phase SO2 and NOx conversion rates are specified as default values in the model. Daytime SO2 and NOx oxidation are hourly varying functions of background O3 concentration, solar radiation, atmospheric stability and plume NOx concentration. Two options are available for background O3 data: a single, typical background value appropriate for the modelling domain and O3 data from one or more monitoring stations. Int. J. Environ. Res. Public Health 2015, 12 7671 We considered a 105 km × 135 km Calmet/Calpuff modelling domain with a resolution of 1.5 km × 1.5 km and height of 3000 m with six levels (0, 19, 100, 300, 750 and 3000). Simulations were performed for the year 2006. Several modelling options drive the estimation of secondary PM2.5 formation in Calmet/Calpuff system (further details are available in Appendix A). Keeping in mind that the main goal of our work is not a complete sensitivity analysis of the model, but to underline how some different simulation choices may change the health impact estimations of secondary PM2.5 with respect to that caused by primary PM2.5 emissions, six model runs were carried out by varying the two gas-particle conversion mechanisms and key input variables such as background O3 and NH3 concentration. For background O3 data we assumed the Calpuff default value of 80 ppb constant in time and space and the ozone concentration data measured in two monitoring stations, whose statistics are reported in Table 1 [39]. For background NH3 values, we assumed the Calpuff default value of 10 ppb as in a previous work of Levy and coauthors [24]. Due to the unavailability of measured data, we selected an alternate lower value of 5 ppb, because even lower values (0.1–1 ppb) seemed appropriate for areas very far from any anthropogenic ammonia sources, but this is not the case for our area of study. Table 2 summarises the six model runs. Sensitivity on NH3 input were performed considering only the ozone measured data which are more reliable. Table 1. Location, minimum, maximum, average and standard deviation of hourly O3 concentration measurements at two monitoring stations located within the simulation domain. Year 2006. Station S1 S2 O3 Concentration Location Xutm (km) Yutm (km) 749.277 764.807 4503.418 4478.158 Min (ppb) Max (ppb) 2 4 79 115 Average (ppb) St. Dev (ppb) 32 38 14 15 Table 2. Characteristics of different Calpuff runs for the estimation of secondary particulate matter (PM2.5) emitted by the coal power plant located in Brindisi (Italy). Year 2006. Run A1 B1 C1 A2 B2 C2 O3 (ppb) NH3 (ppb) 80 Monitored data Monitored data 80 Monitored data Monitored data Chemical Mechanism 10 MESOPUFF 10 MESOPUFF 5 MESOPUFF 10 RIVAD/ARM3 10 RIVAD/ARM3 5 RIVAD/ARM3 2.3. Health Impact Up to now, no cohort study has been conducted in this area to estimate the long-term effects of air pollution exposure. Several meta-analyses were published on the association between exposure to ambient PM2.5 and non-accidental mortality [40–42]. However, in this work, in order to estimate the long-term impact of primary and secondary PM2.5 on mortality for non-accidental causes, a hazard ratio Int. J. Environ. Res. Public Health 2015, 12 7672 (HR) estimation of 1.07 (95% CI 1.02–1.13) for a 5 μg/m3 increment of PM2.5 was chosen based on a recent and large European multicenter study [7]. To estimate the number of non-accidental deaths potentially attributable to increased PM2.5 levels, we derived a three-step procedure [43]. First, we computed the baseline population frequency (P0i), i.e., the proportion of the population, for the ith municipality, that would experience the outcome assuming a null air pollution level: P0i ≅ Pei ( RR − 1) ⋅ E pm ] [1 + 5 (1) where Pei is the observed annual mortality in the area and RR is the HR observed by [7] for a 5 μg/m3 increase in PM2.5; therefore division by 5 was done. Epm is the observed population average PM2.5 exposure level, here assumed equal to 20 μg/m3, which is the rounded annual (2011) average value measured in the area [44]. The fixed baseline increment, D1i, of deaths per a reference population (e.g., 100,000) is calculated assuming a linear additive effect of air pollution above the zero level as the delta for a 1 µg/m3 increment in PM2.5. D1 i = 100,000 ⋅ P0i ⋅ ( RR − 1) 5 (2) To estimate a range of impact rather than a point estimate, the upper and lower 95% confidence interval values of the RR were used in the previous equation. Lower and upper P0i and D1i values could then be derived. Finally, the estimated number of additive attributable cases over the domain area is computed by estimating the annual average of PM2.5 concentration in air attributable to the power plant in each of the municipalities, together with their population, by summing: AC = i =1 120 D1i ⋅ Pi (RR − 1) / 5 ⋅ 120 N ⋅ X ; ⋅ Xi = i =1 i i 100,000 (RR − 1) 1 + ⋅ pm E 5 (3) where AC is the attributable additional deaths, Pi is the municipality’s population, Ni is the municipality’s number of deaths for natural causes and Xi is the annual average of PM2.5 concentration in the air attributable to the power plant. For each municipality in the study area, we used the resident population and the number of total deaths (11,571) reported by the National Institute of Statistics for 2006 [30,45]. Since it was not possible to obtain mortality for natural-cause at a municipal level, this was estimated by assuming a percentage of accidental causes equal to that observed at the provincial level. 3. Results Figure 2 shows the modelled annual average concentration of primary PM2.5. Int. J. Environ. Res. Public Health 2015, 12 Figure 2. Estimated annual average primary PM2.5 concentrations (µg/m3). Year 2006. Figure 3. Estimated annual average secondary PM2.5 concentrations (µg/m3) for different Calpuff runs. Year 2006. 7673 Int. J. Environ. Res. Public Health 2015, 12 7674 Figure 3 depicts the patterns and magnitudes of secondary inorganic PM2.5 obtained by varying O3 and NH3 background concentration values and the chemical mechanism (Table 2). Figure 4 shows the maximum concentrations as a function of the distance from the source. By comparing the primary PM2.5 concentration pattern with the overall secondary PM2.5 runs, the latter peak further from the source in a range between 12 and 32 km depending on key parameters choices and diminish more slowly with the distance from the source. It is also evident how the estimated secondary PM2.5 extended over a larger area with a greater spatial average between 0.07 to 0.12 μg/m3 (Table 3). Varying background O3 from 80 ppb to measured concentration data (Run A1–B1; A2–B2) decreased secondary PM2.5 maximum and average values for both chemical mechanisms. Separate computations for sulphates and nitrates (not shown here) attributed this decrease to a computed lower sulphate production. Decreasing background NH3 from 10 ppb to 5 ppb (B1–C1, B2–C2) also led to a decrease of secondary PM2.5, but in this case the decrease was brought by the nitrate component. Moreover, RIVAD/ARM3 produces maximum concentrations at a greater distance and a higher spatial average concentration with respect to estimates obtained with MESOPUFF chemical mechanism. Table 3. Minimum, maximum, average over the simulation domain PM2.5 concentration for the primary PM2.5 emission and six runs for secondary PM2.5 formation, along with the distance from the source of the location of the maximum value. Year 2006. Minimum (μg/m3) Run Primary A1 B1 C1 A2 B2 C2 Maximum (μg/m3) Average (μg/m3) 0.00 0.01 0.01 0.01 0.01 0.01 0.01 0.22 0.38 0.24 0.22 0.31 0.25 0.22 0.02 0.10 0.08 0.07 0.12 0.10 0.08 Distance of the maximum from the source (Km) 6 12 12 12 32 22 22 Table 4. Estimated number of non-accidental deaths and 95% confidence interval (95% CI) associated with different scenario of modelled exposure to primary and secondary particulate matter (PM2.5) emitted by the coal power plant located in Brindisi (Italy). Year 2006. Scenario Primary PM2.5 Absolute Number of Cases 95% CI Lower Upper Number of Cases per 100,000 Inhabitants 95% CI Lower Upper 4 1 7 0.4 0.1 0.6 Secondary and primary PM2.5—run A1 26 9 41 2.2 0.7 3.4 Secondary and primary PM2.5—run B1 20 7 31 1.7 0.6 2.6 Secondary and primary PM2.5—run C1 19 6 30 1.6 0.5 2.5 Secondary and primary PM2.5—run A2 28 10 44 2.4 0.8 3.7 Secondary and primary PM2.5—run B2 23 8 37 2.0 0.7 3.1 Secondary and primary PM2.5—run C2 21 7 33 1.8 0.6 2.8 Int. J. Environ. Res. Public Health 2015, 12 7675 The estimated number of non-accidental deaths annually attributable to primary PM2.5 was 4 inhabitants (IC95% 1–7) and increased, depending on different assumptions, to 19 (IC95% 6–30) and to 28 (IC95% 10–44) when the secondary PM2.5 was also considered (Table 4). Figure 4. Estimated maximum annual average PM2.5 concentrations (µg/m3) plotted against distance from the source for different Calpuff runs. 4. Discussion Our study showed that estimates of secondary PM2.5 originating from a facility with high emissions of SO2 and NOX extend over a larger area than those related to primary PM2.5, with peak concentrations of the two components well separated in space. On the other hand, secondary PM2.5 concentration values are still around half of the peak values even near the boundary of the simulation area in the direction of the prevailing winds. This is in line with similar studies [21–23] investigating the impact of a single source over a comparable extension area. The expected number of non-accidental deaths associated with the estimated exposure to primary PM2.5 was 4 in the entire area and increased to 19–28 events, when the secondary PM2.5 was also taken into account. Some limitations must be considered when interpreting the results of this study. These regard both the dispersion model and the analysis of mortality effects. First of all, gas-particle conversion is a nonlinear chemical process dominated by emitted and background values of several species but the Calpuff model uses a simplified linear mechanism with respect to gaseous precursors. Moreover, as the background concentration values of NH3 and O3 are key input parameters of the plume chemistry, uncertainties arise from the model assumption of constant values both in time and in the threedimensional spatial domain. Different sensitivity analysis showed the manner in which the estimated exposure to secondary PM2.5 depends on the assumption of the internal chemical mechanism as well as Int. J. Environ. Res. Public Health 2015, 12 7676 on the background inputs assumed for O3 and NH3. The average and maximum values of secondary PM2.5 ranged from 0.07 to 0.12 µg/m3 and from 0.22 to 0.38 µg/m3, respectively. Higher sensitivity was found for chemical mechanism and O3 input. The use of measured O3 data in place of the default Calpuff value of 80 ppb decreases secondary particulate. Similar results were found by Lopez and coauthors [21]. Lower sensitivity resulted by halving (from 10 to 5 ppb) the NH3 background value, with resulting secondary PM2.5 decreasing again. Even lower NH3 values seemed not appropriate due to surveying modelling results obtained for rural areas in the largest Italian valley (Po Valley) that have similar land use of the area under examination [46]. These limitations could be partially overcome by using more complex grid photochemical models. Nevertheless, detailed emission inventories in the area together with initial and boundary conditions [47] are needed but often not available in environmental and health impact assessments. However, simplified models are shown to provide an acceptable screening estimate [22,23]. Another limitation of the study is the relative small modelling area considered, 105 × 135 km2. Other studies [24,37] have shown that impacts from power plant emissions can extend over 300 km from the source. Thus, an underestimation of attributable deaths might have been occurred. Although exposure to PM2.5 has been shown to have adverse impacts on morbidity outcomes and reproductive health, we had to limit our analysis to mortality due to the data available. Furthermore, in order to estimate the mortality for non-accidental causes, we discounted the total mortality available at a municipal level using the percentage of accidental causes available at a provincial level. In the three provinces, these percentages ranged from 4.1% to 4.9% [45]. As already pointed out in other studies [21], due to differences in population characteristics, such as socio-economic status, sex and age distribution, uncertainty exists regarding the use of risk estimates generated in settings other than those under study. Therefore, whether or not the adopted risk estimate reasonably represents the investigated settings is unclear and has to be further researched. Even the confidence interval of the relative risk considered in our analysis might indeed not be suitable in our setting. The adopted risk estimate used is based on 22 European cohort studies involving a number of participants (367,251), which is one third of the residents in Brindisi-Lecce and Taranto provinces; we could have therefore overestimated the width of the confidence interval. In our analysis we assumed a linear relationship between PM2.5 exposure and mortality. This could limit our findings, although alternatives to a linear exposure-response model have been considered in other studies [5,48] and no evidence for an absence of linearity was detected. 5. Conclusions This study showed that the inclusion of secondary PM2.5 might significantly vary the environmental and health impact estimate of a coal power plant, large emitting source of SO2 and NOx. Although the predicted annual average values seem to be rather low (less than 1 µg/m3), exposure to primary and secondary PM2.5 are expected to be associated respectively from 4 to a maximum of 28 annual nonaccidental deaths. These figures ought to be considered in health protection policies. Furthermore, secondary particulate formation seems to be one of the pollution pressure that should not be ignored in environmental and health impact assessments. Int. J. Environ. Res. Public Health 2015, 12 7677 Acknowledgements We acknowledge Claudia Spix (Johannes Gutenberg-Universität, Institute of Medical Biostatistics, Epidemiology and Informatics, Mainz) and Oliver Bayer for useful discussions. We wish to thank Katherine Taylor for helping revise and edit the English. We thank the anonymous Reviewers for their constructive comments. Author Contributions Cristina Mangia, Marco Cervino and Emilio A.L. Gianicolo designed the research. Cristina Mangia performed the environmental data analysis and modelling. Emilio A.L. Gianicolo and Marco Cervino performed the health impact data analysis. All authors contributed to the interpretation of results and to the drafting of manuscript. Conflicts of Interest The authors declare no conflict of interest. Appendix A Modelling System Options Meteorological data input for Calmet were obtained by the prognostic meteorological model MM5, which ran on hour basis and on a 4 × 4 km grid size. Domain size and grid resolution were chosen to optimise the reproduction of sea breeze circulations and computing time. Emission rates were computed by assuming a constant power load over the year and PM was assumed entirely in the PM2.5 range. In modelling setup we use the default settings for Calpuff whereas measured data were not available. We assumed that secondary particles were entirely in the PM2.5 range, as SO4 and NO3 are predominantly observed in the fine mode and used the Calpuff default geometric mass mean diameter of 0.48 μm and geometric standard deviation of 2. We assumed a nighttime oxidation rates of 0.2 and 2.0 percent h−1 for SO2 and NOx, respectively. We modeled gas phase dry deposition (for SO2, NOx and HNO3) and particle phase dry deposition (for SO4, NO3 and primary fine particles) using the model option for full treatment of spatially and temporally varying gas/particle deposition rates predicted by a resistance deposition model. As input values to the resistance deposition model, we used the model default solubility, reactivity and diffusivity for gases (SO2, NOx and HNO3) and model default size distribution for particles (SO4, NO3 and primary fine particles). For wet deposition, Calpuff uses an empirically based scavenging coefficient method. We used Calpuff default scavenging coefficients for primary PM2.5, SO2, SO4 and NO3, with liquid precipitation coefficients of 1 × 10⁻⁴, 3 × 10⁻⁵, 1 × 10⁻⁴ and 1 × 10⁻⁴ s−1, respectively [33]. The RIVAD/ARM3 chemistry scheme treats the NO and NO2 oxidation process in addition to the NO2 to NO3 and SO2 to SO4 chemical transformations, with equilibrium between gaseous HNO3 and particulate NH4NO3. The chemical transformation scheme requires both NO and NO2 emissions rates. Typically, only NOx emission rate is known, and this is expressed in terms of NO2 mass equivalent. We assumed NO/NOx equal to 0.9. Int. J. Environ. Res. Public Health 2015, 12 7678 Total secondary PM2.5 were calculated summing secondary sulphate (defined as the mass of ammonium sulphate ((NH4)2SO4) and secondary nitrate (defined as the mass of ammonium nitrate (NH4NO3). References 1. Spix, C.; Anderson, H.R.; Schwartz, J.; Vigotti, M.A.; LeTertre, A.; Vonk, J.M.; Touloumi, G.; Balducci, F.; Piekarski, T.; Bacharova, L.; et al. Short-term effects of air pollution on hospital admissions of respiratory diseases in Europe: A quantitative summary of APHEA study results. Air Pollution and Health: A European Approach. Arch. Environ. Health 1998, 53, 54–64. 2. Pope, C.A. Mortality effects of longer term exposures to fine particulate air pollution: Review of recent epidemiological evidence. Inhal. Toxicol. 2007, 19, 33–38. 3. Andersen, Z.J.; Olsen, T.S.; Andersen, K.K.; Loft, S.; Ketzel, M.; Raaschou-Nielsen. O. Association between short-term exposure to ultrafine particles and hospital admissions for stroke in Copenhagen, Denmark. Eur. Heart J. 2010, 31, 2034–2040. 4. Rückerl, R.; Schneider, A.; Breitner, S.; Cyrys, J.; Peters, A. Health effects of particulate air pollution: A review of epidemiological evidence. Inhal. Toxicol. 2011, 23, 555–592. 5. Cesaroni, G.; Badaloni, C.; Gariazzo, C.; Stafoggia, M.; Sozzi, R.; Davoli, M.; Forastiere, F. Long-term exposure to urban air pollution and mortality in a cohort of more than a million adults in Rome. Environ. Health Perspect. 2013, 121, 324–331. 6. Hoek, G.; Krishnan, R.M.; Beelen, R.; Peters, A.; Ostro, B.; Brunekreef, B.; Kaufman, J.D. Long-term air pollution exposure and cardio-respiratory mortality: A review. Environ. Health 2007, 12, doi:10.1186/1476-069X-12-43. 7. Beelen, R.; Raaschou-Nielsen, O.; Stafoggia, M.; Andersen, Z.J.; Weinmayr, G.; Hoffmann, B.; Wolf, K.; Samoli, E.; Fischer, P.; Nieuwenhuijsen, M.; et al. Effects of long-term exposure to air pollution on natural-cause mortality: An analysis of 22 European cohorts within the multicentre ESCAPE project. The Lancet 2014, 383, 785–795. 8. Pedersen, M.; Giorgis-Allemand, L.; Bernard, C.; Aguilera, I.; Andersen, A.M.; Ballester, F.; Beelen, R.M.; Chatzi, L.; Cirach, M.; Danileviciute, A.; et al. Ambient air pollution and low birthweight: A European cohort study (ESCAPE). Lancet Respir. Med. 2013, 1, 695–704. 9. Ha, S.; Hu, H.; Roussos-Ross, D.; Haidong, K.; Roth, J.; Xu, X. The effects of air pollution on adverse birth outcomes. Environ. Res. 2014, doi:10.1016/j.envres.2014.08.002. 10. Vrijheid, M.; Martinez, D.; Manzanares, S.; Dadvand, P.; Schembari, A.; Rankin, J.; Nieuwenhuijsen, M. Ambient air pollution and risk of congenital anomalies: A systematic review and meta-analysis. Environ. Health Perspect. 2011, 119, 598–606. 11. Chen, E.K.; Zmirou-Navier, D.; Padilla, C.; Deguen, S. Effects of air pollution on the risk of congenital anomalies: A systematic review and meta-analysis. Int. J. Environ. Res. Public Health 2014, 11, 7642–7668. 12. Nieuwenhuijsen, M.J.; Dadvand, P.; Grellier, J.; Martinez, D.; Vrijheid, M. Environmental risk factors of pregnancy outcomes: A summary of recent meta-analyses of epidemiological studies. Environ. Health 2013, doi:10.1186/1476-069X-12-6. Int. J. Environ. Res. Public Health 2015, 12 7679 13. Gorini, F.; Chiappa, E.; Gargani, L.; Picano, E. Potential effects of environmental chemical contamination in congenital heart disease. Pediatr. Cardiol. 2014, doi:10.1007/s00246-014-0870-1. 14. Hamra, G.B.; Guha, N.; Cohen, A.; Laden, F.; Raaschou-Nielsen, O.; Samet, J.M.; Vineis, P.; Forastiere, F.; Saldiva, P.; Yorifuji, T.; Loomis, D. Outdoor particulate matter exposure and lung cancer: A systematic review and meta-analysis. Environ. Health Perspect. 2014, 122, 906–911. 15. Seinfeld, J.H.; Pandis, S.N. Atmospheric Chemistry and Physics: From Air Pollution to Climate Change, 2nd ed.; Wiley: New York, NY, USA, 2006. 16. Franklin, M.; Koutrakis, P.; Schwartz, J. The role of particle composition on the association between PM2.5 and mortality. Epidemiology 2008, 19, 680–689. 17. Ostro, B.; Tobias, A.; Querol, X.; Alastuey, A.; Amato, F.; Pey, J.; Pérez, N.; Sunyer, J. The effects of particulate matter sources on daily mortality: A case-crossover study of Barcelona, Spain. Environ. Health Perspect. 2011, 119, 1781–1787. 18. Ostro, B.M.; Lipsett, P.; Reynolds, D.; Goldberg, A.; Hertz, C.; Garcia, K.; Henderson, D.; Bernstein, L. Long-term exposure to constituents of fine particulate air pollution and mortality: Results from the California Teachers Study. Environ. Health Perspect. 2010, 118, 363–369. 19. Brock, C.A.; Washenfelder, R.A.; Trainer, M.; Ryerson, T.B.; Wilson, J.C.; Reeves, J.M.; Huey, L.G.; Holloway, J.S.; Parrish, D.D.; Hubler, G.; Fehsenfeld, F.C. Particle growth in the plumes of coal-fired power plants. J. Geophys. Res. 2002, 107, doi:10.1029/2001JD001062. 20. Bickel, P.; Friedrich, R. ExternE—Externalities of Energy—Methodology 2005 Update. Office for Official Publications of the European Communities: Luxemburg, Luxemburg, 2005. 21. Lopez, M.T.; Zuk, M.; Garibay, V.; Tzintzun, G.; Iniestra Fernandez, A. Health impacts from power plant emissions in Mexico. Atmos. Environ. 2005, 39, 1199–1209. 22. NACAA (National Association of Clean Air Agencies). PM2.5 Modeling Implementation for Projects Subject to National Ambient Air Quality Demonstration Requirements Pursuant to New Source Review. Report from NACAA PM2.5 Modeling Implementation Workgroup. 2011. Available online: http://www.epa.gov/ttn/scram/10thmodconf/review_material/01072011-NACAAPM2.5 ModelingWorkgroupReport-FINAL.pdf (accessed on 29 June 2015). 23 US EPA (Unites States Environment Protection Agency). Guidance for PM2.5 Permit Modeling EPA-454/B-14-001. Office of Air Quality Planning and Standards, Air Quality Assessment Division: Research Triangle Park, NC, USA, 2014; pp. 1–144. 24. Levy, J.I.; Spengler, J.D.; Hlinka, D.; Sullivan, D.; Moon, D. Using Calpuff to evaluate the impacts of power plant emissions in Illinois: Model sensitivity and implications. Atmos. Environ. 2002, 36, 1063–1075. 25. Li, Y.R.; MacDonald Gibson, J. Health and air quality benefits of policies to reduce coal-fired power plant emissions: A case study in North Carolina. Environ. Sci. Technol. 2014, 48, 10019–10027. 26. Guerra, S.A.; Olsen, S.R.; Anderson, J.J. Evaluation of the SO2 and NOX offset ratio method to account for secondary PM2.5 formation. J. Air Waste Manag. Assoc. 2014, 64, 265–271. 27. Ministero dell’Ambiente e della Tutela del Territorio e del Mare. Parere istruttorio centrale termoelettrica ENEL di Brindisi. 2012. Available online: aia.minambiente.it/Dettaglio AutorizzazionePub.aspx?id=4985 (accessed on 10 June 2015). Int. J. Environ. Res. Public Health 2015, 12 7680 28. ARPA Puglia. Le emissioni industriali in Puglia. 2009. Available online: www.arpa.puglia.it/ web/guest/feedrss/-/journal_content/56/10125/76762 (accessed on 10 June 2015). 29. Mangia, C.; Bruni, A.; Cervino, M.; Gianicolo, E.A.L. Sixteen-year air quality data analysis of a high environmental risk area in Southern Italy. Environ. Monit. Assess. 2011, 183, 555–570. 30 ISTAT. Data on Resident Population in the Italian Municipalities. 2014. Available online: http://demo.istat.it/index_e.html (accessed on 25 November 2014). 31. Gianicolo, E.A.L.; Mangia, C.; Cervino, M.; Bruni, A.; Andreassi, M.G.; Latini, G. Congenital anomalies among live births in a high environmental risk area—A case-control study in Brindisi (southern Italy). Environ. Res. 2014, 128, 9–14. 32. Gianicolo, E.A.L.; Bruni, A.; Mangia, C.; Cervino, M.; Vigotti, M.A. Acute effects of urban and industrial pollution in a government-designated “Environmental risk area”: The case of Brindisi, Italy. Int. J. Environ. Health Res. 2013, 23, 446–460. 33. Scire, J.S.; Stimatis, D.G.; Yamartino, R. CALPUFF Modeling System Version 6 User Instructions; Earth Tech, Inc.: Johnstown, PA, USA, 2000. 34. Unites States Environment Protection Agency (US EPA). Documentation of the Evaluation of Calpuff and Other Long Range Transport Models Using Tracer Field Experiment Data EPA 454/R12-003. 2012. Available online: http://www.epa.gov/scram001/reports/EPA-454_R-12-003.pdf (accessed on 9 May 2015). 35. Levy, J.I.; Wilson, A.M.; Evans, J.S.; Spengler, J.D. Estimation of primary and secondary particulate matter intake fractions for power plants in Georgia. Environ. Sci. Technol. 2003, 37, 5528–5536. 36. MacIntosh, D.L.; Stewart, J.H.; Myatt, T.A.; Sabato, J.E.; Flowers, G.C.; Brown, K.W.; Hlinka, D.J.; Sullivan, D.A. Use of CALPUFF for exposure assessment in a near-field, complex terrain setting. Atmos. Environ. 2010, 44, 262–270. 37. Zhou, Y.; Levy, J.I.; Hammitt, J.K.; Evans. J.S. Estimating population exposure to power plant emissions using Calpuff: A case study in Beijing, China. Atmos. Environ. 2003, 37, 815–826. 38. Mangia, C.; Cervino, M.; Gianicolo, E.A.L. Dispersion models and air quality data for population exposure assessment to air pollution. Int. J. Environ. Pollut. 2014, 54, 119–127. 39. Schipa, I.; Tanzirella, A.; Mangia, C. Differences between weekend and weekday ozone levels over rural and urban sites in Southern Italy. Environ. Monit. Assess. 2009, 156, 509–523. 40. Adar, S.D.; Filigrana, P.A.; Clements, N.; Peel, J.L. Ambient coarse particulate matter and human health: A systematic review and meta-analysis. Curr. Environ. Health Rep. 2014, 1, 258–274. 41. Shang, Y.; Sun, Z.; Cao, J.; Wang, X.; Zhong, L.; Bi, X.; Li, H.; Liu, W,; Zhu, T.; Huang, W. Systematic review of Chinese studies of short-term exposure to air pollution and daily mortality. Environ. Int. 2013, 54, 100–111. 42. Chen, H.; Goldberg, M.S.; Villeneuve, P.J. A systematic review of the relation between long-term exposure to ambient air pollution and chronic diseases. Rev. Environ. Health 2008, 23, 243–297. 43. Künzli, N.; Kaiser, R.; Medina, S.; Studnicka, M.; Oberfeld, G.; Horak, F., Jr. Health costs due to road traffic-related air pollution: An impact assessment project of Austria, France and Switzerland. (Air pollution attributable cases Technical report on epidemiology) Federal Department for Environment, Energy and Communications Bureau for Transport Studies: Bern, Switzerland, 1999. Int. J. Environ. Res. Public Health 2015, 12 7681 44. ARPA Puglia. Relazione sullo Stato dell'Ambiente. 2011. Available online: www.arpa.puglia.it/ web/guest/rsa2011 (accessed on 25 March 2014). 45. ISTAT. National Survey on Mortality Causes. 2012. Available online: www.istat.it/it/archivio/ 58063 (accessed on 25 November 2014). 46. Capiaghi, V. Ammoniaca in Atmosfera in Lombardia. Confronto tra stima modellistica e risultanze analitiche. 2013. Available online: www.politesi.polimi.it/handle/10589/88130?locale=it (accessed on 25 May 2015). 47. Buonocore, J.J.; Dong, X.; Spengler, J.D.; Fu, J.S.; Levy, J.I. Using the Community Multiscale Air Quality (CMAQ) model to estimate public health impacts of PM2.5 from individual power plants. Environ. Int. 2014, 68, 200–208. 48. Lepeule, J.; Laden, F.; Dockery, D.W.; Schwartz, J.D. Chronic exposure to fine particles and mortality: An extended follow-up of the Harvard Six Cities study from 1974 to 2009. Environ. Health Perspect. 2012, 120, 965–970. © 2015 by the authors; licensee MDPI, Basel, Switzerland. This article is an open access article distributed under the terms and conditions of the Creative Commons Attribution license (http://creativecommons.org/licenses/by/4.0/).
Scaricare