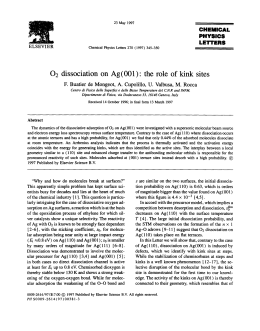
High–energy resolution core level photoelectron spectroscopy and diffraction: powerful tools to probe physical and chemical properties of solid surfaces. Alessandro Baraldi hν Grado, September 21, 2013 e- For info, do not hesitate to contact me! Prof. Alessandro Baraldi Physics Department, University of Trieste , ITALY Deputy-chair Doctorate School in Nanotechnology, University fo Trieste Head of the Surface Science Laboratory, Elettra-Sincrotrone Trieste E-mail: [email protected] website: alessandrobaraldi.weebly.com Phone: +39 040 375 8719 (off) 8331 (lab) Grado, September 21, 2013 Outline Core-level spectroscopy is used to ... … probe the properties of first-layer surface atoms. … determine energetics and atomic mechanisms in diffusion processes. … identify in a direct way the adsorption site of atoms and molecules. … evaluate the chemical reactivity trends on model surfaces. … investigate the role of surface defects. … study molecular dissociation processes in nanostructured surfaces. … monitor the surface chemical composition during chemical reactions. … investigate the growth mechanism of graphene … probe the unsual physical and chemical properties of graphene. Grado, September 21, 2013 One of the most widely employed experimental techniques Number of papers published in the last twenty years in peer-review international scientific journals on X-ray Photoelectron Spectroscopy, according to the Grado, September 21, 2013 Thomson Reuters ISI Web of KnowledgeR . The main advantages Down to the 100 ms time-scale Grado, September 21, 2013 In the range 40-100 meV 20 Between K and 1300 K 0.5% of ML Ir(111) Details from the core level lineshape Core-level photoemission lineshape is usually described by using the Doniach-Šùnjić function J. Phys. C: Sol. State Phys. 3, 285 (1970) Grado, September 21, 2013 A. Baraldi et al., Phys. Rev. B 67, 205404 (2003). Many-body effects in Doniach-Šùnjić Lorentzian distribution arising from the finite corehole lifetime. A convolution of a DoniachŠùnjić function and a Gaussian, which account for the vibration/phonon and the contribution of the instrumental resolution. Asymmetry parameter, describing the contribution of electron-hole pairs excitation. Grado, September 21, 2013 Core-level shift and atomic coordination number Surface Core Level Shift of single crystal surfaces Grado, September 21, 2013 A. Baraldi et al., J. Phys.: Condens. Matter 20, 93001 (2008). Surface reconstruction and atomic diffusion Oxygen-induced reconstruction on Rh(110) (1x2) (2x2)pg Q=0.5 ML Grado, September 21, 2013 (1x3) c(2x6) Q=0.66 ML c(2x8) (1x4) Q=0.75 ML A. Baraldi et al., Phys. Rev. B 72, 75417 (2005). (1x4)+(1x1) Atomic diffusion and surface reconstruction (1x2) -445 Rh3d5/2 308 surface -675 307 (1x1) -715 bulk Photoemission Intensity [arb. units] -700 306 Binding Energy [eV] 305 Atomic diffusion and surface reconstruction Grado, September 21, 2013 Atomic diffusion and surface reconstruction Qt Ie t e E / K T 1.0 426 K B 0.8 ln(K) [ x10-4] Normalized (1x2) Rh Population A 0.6 0.4 451 K -2 -3 -4 -5 -6 2.1 0.2 2.2 2.3 2.4 -3 1/T [ x 10 ] 2.5 473 K 0.0 0 500 1000 Time [s] 1500 EA 0.95 0.13 eV Mechanism of surface deconstruction EXCHANGE HOPPING TS TS = 2.56 eV Final state= 1.09 eV Fs TS= 2.03 eV Final state= 0.99 eV Defect mediated diffusion mechanism Step 1.14 eV Grado, September 21, 2013 1.16 eV Molecular adsorbates on surfaces Carbon Monoxide adsorption on Rh(111) on-top bridge bridge on-top A. Baraldi et al., Surf. Sci. Rep. 49, 169 (2003). Localized vibrations in adsorbed molecules C*O Harmonic approximation Probing the vibration of C*O excited molecules O C Grado, September 21, 2013 Photoemission Intensity CO (√3x√3)R30° ΔE0,1=231.2 meV ΔE0,2=461.7 meV CO on Ir(111) C1s core-level spectrum of adsorbed CO c(2√3x4)rect ΔE0,1=232.8 meV ΔE0,2=466.2 meV Atomic and molecular adsorption. on transition metals CO su Pt(111) (4x4) Q=0.06 ML h c(4x2) Q=0.50 ML O1s C1s Grado, September 21, 2013 Carbon monoxide adsorption on Pt(111) h Grado, September 21, 2013 Pt4f Carbon monoxide adsorption on Pt(111) Molecular adsorption site determination dPt 0 1 dQ Grado, September 21, 2013 dPt1 1 dQ Oxygen adsorption on Rh(100) MOVIE Rh-1O Rh-2O Atomic adsorption site determination dRh0 4 dQ four-fold hollow adsorption site A. Baraldi et al., Phys. Rev. Lett. 93, 046101 (2004). SCLS vs chemical reactivity 1.2 -0.8 1.0 -1.0 0.8 -1.2 NO Adsorption energy [eV] SCLS (eV) C3,3 C2,3 0.6 0.4 C2,4 C1,4 0.2 Rh(111) 0.25 ML -1.4 -1.6 -1.8 C1,3 0.5 ML 0.5 ML 0.0 ML O/Rh(100) 0.25 ML -2.0 0.0 0.0 0.0 ML 0.4 0.8 1.2 1.6 0.0 0.2 0.4 0.6 SCLS (eV) 0.8 Ed (eV) Grado, September 21, 2013 A. Baraldi et al., Phys. Rev. Lett. 93, 046101 (2004). Surface defects vs chemical reactivity Role of steps in N2 activation on Ru(0001) S. Dhal et al., Phys. Rev. Lett. 83, 1814 (1999) Grado, September 21, 2013 Controlling the catalytic bondbreaking selectivity on Ni surfaces by step blocking R.T. Vang et al., Nature 4, 260 (2005) Catalytic activity of gold nanoparticles, B. Hvolbæk et al., Nanotoday 2, 14 (2007) The role of adatoms on solid surfaces 2D adatom lattice-gas Pd, Cu and Ag adatoms densities are 1-6 % on W at 700 K. Grado, September 21, 2013 Acetylene Cyclotrimerization Adatom and addimer-induced Rh3d5/2 SCLS Grado, September 21, 2013 A. Baraldi et al., New J. Phys. 9, 143 (2007). 2.67 Å Adatom and addimer local geometrical structure d=2.50 Å d12=1.82 Å Rh(100) -3.7 % -6.4 % d1 d1=2.59 Å d2=2.51 Å d3=2.55 Å -3.0 % -6.2 % -4.8 % d3 d2 2.59 Å -3.0 % 0.03 Å dA=1.60 Å dD=1.60 Å d12=1.84 Å -2.7 % dD=1.63 Å d12=1.87 Å Adatom and addimer-induced Rh3d5/2 SCLS bulk II-layer Rh(111) II-layer Rh(100) Undercoordinated atoms and surface chemical reactivity A careful analysis of CLSs provides a spectroscopic measure of chemical reactivity changes at the atomic level. Grado, September 21, 2013 A. Baraldi et al., J. Phys. Chem. C 115, 3378 (2011). Nanostructured surfaces and chemical reactivity Tuning the Rh(110) surface morphology Grado, September 21, 2013 [110] [001] Carbon Monoxide adsorption on Rh surfaces CO↔C+O flat step Ediss (111) (211) step Grado, September 21, 2013 Rh(111) Rh-step Rh-kink 1.17 0.30 0.21 kink Eads 1.84 1.18 1.09 CN 9 7 6 The rhomboidal nanopyramids Energy b) 400eV eV 400 c) 220 eV 250 eV 15 10 5 0 -5 -10 K<1-10> (% BZ) a) 700eV eV 700 -15 -15-10 -5 0 5 10 15 K<00 1> (% BZ) Terrace width G=6.6 Å Facet slope τ=11±2° Spatial Periodicity L=14.7 nm Thermal stability up to ~500 K Thermal dissociation of Carbon Monoxide 9.4±0.5 % F. Buatier de Mongeot et al., Phys. Rev. Lett. 97, 56103 (2006). 22±3 % 80±14 % Surface segregation during chemical reactions Adsorbates-induced surface segegation. Surface Concentration [%] Coverage [ML] H2+O2 su Pt50Rh50(100) QO QH H2O 0.4 0.2 0.0 T=330 K 100 T=520 K T=400 K Ptsurf 80 60 40 Rhsurf 20 0 0 2000 4000 A. Baraldi et al., J. Am. Chem. Soc. 127, 56713 (2005). Time [s] 6000 8000 A new dimension for carbon ● Two dimensional allotrope of carbon ● Basic-building block of graphite, carbon nanotubes and large fullerenes ● New electronic structural properties ● Single electron transistors ● Hydrogen storage devices ● Chemical sensors ● Ultracapacitors Grado, September 21, 2013 The methods for graphene production ● Mechanical exfoliation ● Liquid suspension graphene oxide followed by chemical reduction ● Epitaxial growth by thermal desorption of Si atoms from the SiC surface ● Unzipping carbon nanotubes Epitaxial growth by chemical vapor deposition on transition metals ● High quality carbon layers ● Tunable properteis Grado, September 21, 2013 Ethylene adsorption on Transition Metals Graphene-induced Surface Core Level Shift C 1s Ir 4f7/2 SCLS= -545 meV EXP -550 meV THEO HCP Grado, September 21, 2013 TOP SCLS= -535 meV EXP -549 meV THEO -551 meV THEO P. Lacovig et al., Phys. Rev. Lett. 103, 166101 (2009). Kinetics of C2H4 adsorption Time-lapsed C 1s spectra at 1273 K 400 ms/spectrum Time-lapsed C 1s spectra at 823 K Grado, September 21, 2013 Temperature evolution of the adsorbate layer C 1s components CA= 284.12 eV CB= 283.94 eV→284.10 eV CC= 283.61 eV Grado, September 21, 2013 Morphology of carbon nano-islands from DFT 1.62 Å Θ=0 2.53 Å Θ=11 Dome-shaped carbon nano-islands formation 2.63 Å Θ=16 3.13 Å Θ=21 Nano-islands induced Ir4f7/2 core-level shifts -225/-390 meV Surface = -550 meV Bulk Ir1= +498 meV Ir2= -325 meV Ir3= -551 meV Ir4= -132 meV Ir5= -270 meV Nano-islands induced C 1s core-level shifts C4 C1= +268 meV C2= -348 meV C3= -439 meV The energetics of nano-islands Clusters formed with different number P of Honeycomb Rings (HRs) P=19, n=54 P=7, n=24 P=3, n=13 graphene P=1, n=6 Grado, September 21, 2013 Thermal expansion of graphene K.V. Zakharchenko et al. Phys. Rev. Lett. 102, 046808 (2009) C1s temperature dependence Graphene is strongly anharmonic due to soft bending modes. Up to 900 K, graphene is anomalous since its lattice parameter decreases going over to normal behavior at higher temperatures. Grado, September 21, 2013 ● Phonon-induced broadening ● Core level binding energy shift M. Pozzo et al., Phys. Rev. Lett. 106, 135501 (2010). Lattice constant versus interatomic distance Ab initio molecular dynamics calculations Grado, September 21, 2013 Thermal expansion of graphene Gas-phase data CV G1 CV G Thermal properties of graphene SHIFTS EXP =+70 meV THEO =+20 meV Karl-Franzens Universität, GRAZ, April 2010 Grado, September 21, 2013 C1s core level shifts of epitaxial graphene C 1s A correlation between graphene-substrate bond strength and graphene corrugation weak interaction Strong chemical bond Why just two components? 0.2 Å 1.5 Å Graphene growth on Re(0001) Formation of a high–quality single-layer of graphene is strongly opposed by two competing processes, namely surface carbide formation and carbon bulk dissolution. Time-lapsed spectral sequence of C1s spectra taken during ethylene exposure and surface annealing to high temperature. Grado, September 21, 2013 E. Miniussi et al., submitted Graphene corrugation on Re(0001) 2 μm strong interaction moirè pattern weak interaction Grado, September 21, 2013 E. Miniussi et al., Phys. Rev. Lett. 106, 216101 (2011). C-C bond stretching on Re(0001) humps C-C bond length, obtained as the average distance from the three nearest neighbouring atoms for each C atom valleys 1.467 Å 1.460 Å (0.5 %) Graphene on Ru(0001): C1s spectrum W S Grado, September 21, 2013 S W D. Alfè et al., Sci. Rep. 3, 2430 (2013) Graphene growth mechanism Fast-data acquisition allows to monitor the C1s spectral evolution while dosing ethylene at high temperature. LEEM (10 μm f.o.v.) The carbon lattice-gas: precursor to graphene formation Eb(eV) C 1s(eV) MH2 7.53 283.02 MH1 MF2 7.78 283.55 DA1 MH4 7.31 282.97 DA2 MF3 7.45 283.37 DT1 MH5 7.38 282.89 DT2 MF4 7.15 282.92 DB1 Eb(eV) C 1s(eV) 7.67 282.82 283.14 15.78 283.35 283.28 14.73 283.39 283.29 15.52 MF1 6.98 282.89 DB2 Three-fold hcp site on the terraces (MH1) and the C monomer at the steps (MF2) have very similar adsorption energies. 283.17 Monomers form a 2D lattice gas which supplies C atoms for GR formation. D. Alfè et al., Sci. Rep. 3, 2430 (2013) Fine-tuning of graphene-metal adhesion Bimetallic surface alloying provides a viable route for governing the interaction between graphene and metal through the selective choice of the elemental composition of the surface alloy. C1s The formation of PtRu surface alloys by deposition of sub-monolayer Pt films on Ru(0001) and subsequent annealing to HT H. E. Hoster et al., Phys. Chem. Chem. Phys. 10, 3812 (2008). Fine-tuning of graphene-metal adhesion Ru(0001) C-substrate distance Charge density difference Simulated C1s spectra 0.1 ML 0.2 ML 0.5 ML For those who are interested in graphene P. Lacovig, et al., Growth of dome-shaped carbon nanoislands on Ir(111): the intermediate between carbidic clusters and quasi free-standing graphene, Phys. Rev. Lett. 103, 166101 (2009). S. Lizzit, et al., Band dispersion in the deep 1s core levels of graphene, Nature Physics 6, 345 (2010). S. Lizzit, et al., High resolution fast x-ray photoelectron spectroscopy study of ethylene interaction with Ir(111): from chemisorption to dissociation and graphene formation, Catal. Today 154, 68 (2010). M. Pozzo, et al., Thermal expansion of supported and free-standing graphene: lattice constant versus interatomic distance, Phys. Rev. Lett. 106, 135501 (2011). E. Miniussi, et al., Thermal stability of corrugated epitaxial graphene grown on Re(0001), Phys. Rev. Lett. 106, 216101 (2011) R. Larciprete, et al., Dual Path Mechanism in the thermal reduction of graphene oxide. J. Am. Chem. Soc. 133, 17315 (2011). A. Cavallin, et al., Local Electronic Structure and Density of Edge and Facet Atoms at Rh Nanoclusters Self-Assembled on a Graphene Template, ACSNano 6, 3034 (2012). S. Lizzit, et al., Transfer-free electrical insulation of epitaxial graphene from its metal substrate, Nano Letters 12, 4503 (2012). S. Ulstrup et al., High-temperature behavior of supported graphene: Electron-phonon coupling and substrate-induced doping, Phys. Rev. B 86, 161402R (2012). R. Larciprete, et al., Oxygen switching of the epitaxial graphene–metal interaction, ACS Nano 6, 9551 (2012) D. Alfè, et al., Fine-tuning of graphene-metal adhesion by surface alloy, Sci. Rep. 3, 2430 (2013) Grado, September 21, 2013
Scaricare