Health benefit modelling assessment
of PM10 effective control policies in
Northern Italy
E. Pisoni, M. Volta
Environmental modelling and control research group
Dipartimento di Elettronica per l’Automazione
Università degli Studi di Brescia
{enrico.pisoni,lvolta}@ing.unibs.it
DEA - Università degli Studi di Brescia
Research aim
To develop a secondary pollution control plan:
• Multi-objective optimization:
–
–
–
–
Objective 1: Air Quality Index (AQI)
Objective 2: Internal Costs (C)
Objective 3: External Costs (ExC)
Objective 4: ….
• for a mesoscale domain
– Milan CityDelta domain (Northern Italy)
DEA - Università degli Studi di Brescia
Problem formulation
min J (q )= min [AQI (E (q )) C(E ((q ))]
q
q
Emission reduction costs
Air quality index
q˛Q
Feasible solution set
Decision variables: precursor emission reductions
E
Base-case precursor emissions
DEA - Università degli Studi di Brescia
Health assessment: NewExt approach
ASTHMATICS
ADULTS
Bronchodilator usage
Cough
Lower respiratory symptoms
CHILDREN
Bronchodilator usage
Cough
Lower respiratory symptoms
ELDERLY +65
Congestive heart failure
NON ASTHMATICS
CHILDREN
Cronic cough
ADULTS
Restricted activity days
Chronic bronchitis
ENTIRE POPULATION
Respiratory hospital admissions
Cerebrovascular hospital admissions
Chonic Yoll
[unit/y*p*(µg/mc)]
unit
€2000/unit
BU-Aa
C-Aa
LRS-Aa
0.163
0.335
0.061
case
day
day
40
45
8
BU-Ca
C-Ca
LRS-Ca
0.078
0.267
0.103
case
day
day
40
45
8
CHF-Oa
1.85E-05
case
3260
CC-Cna
2.07E-03
episode
240
RAD-Ana
CB-Ana
0.025
4.9E-05
day
case
110
169330
RHA
CVA
YOLL
2.07E-06
5.04E-06
4.00E-04
case
case
YOLL
4320
16730
50000
www.ier.uni-stuttgart.de/newext/
DEA - Università degli Studi di Brescia
Objective 1
the Air Quality Indicator (AQI)
AQI (E (q ))= Y
( (q ))
p,k
Ei, j
p,k
p : precursor
k : CORINAIR macro sec tors
E ip, ,jk : base - case emissions
q p,k : decision variables
MeanPM10 (i , j )
∑
i , j ∑t
AQI (E (q ))=
I J T
DEA - Università degli Studi di Brescia
Objective 1:
AQI model identification
• Pollutant concentration are computed by 3D deterministic
chemical transport multiphase modelling system
– Time consuming
• Identification of source-receptor models (Neural
Networks), describing the nonlinear relation between
decision variables (emission reduction) and air quality
objective, processing a set of TCAM simulations
DEA - Università degli Studi di Brescia
Objective 1 (AQI):
TCAM simulations
• 2 base case simulations:
–
–
–
–
–
300 x 300 km2, 60 x 60 cells, cell resolution: 5x5 km2
11 vertical layers
emission and meteorological fields: JRC (CityDelta Project)
initial and boundary conditions: EMEP
years: 1999 and 2004
• 5 alternative scenario simulations:
– CDII:
2010_CLE, 2010_MFR
– CDIII:
2020_CLE, 2020_LLD, 2020_LLD2
(http://aqm.jrc.it/citydelta/)
DEA - Università degli Studi di Brescia
Precursor-pollutant models (NN)
an-1
•
Delay
NN architecture: Elman:
–
–
–
Nodes of input layer: 5
Nodes of output layer: 1
Nodes of hidden layer: 8
FW
vn
+
IW
[MxM]
AF1
an
[MxQ]
•
•
One neural network for each group
of 2x2 (10x10 km2) domain cells
Input data: daily NOx, VOC, NH3,
SOx, primary PM10 emissions
1
OW
[LxM]
b
1
[Mx1]
f(vn)
+
AF2
g
[Lx1]
•
Validation dataset:
– Third week of each month
•
Target data: daily mean PM10
concentrations computed by the
TCAM model
•
Identification dataset:
– Remaining patterns
DEA - Università degli Studi di Brescia
Objective 1 (AQI):
Source-receptor models (NN)
NormMeanErrEv
Scatter
51 50
0.24
TRENTO
51 00
0.16
0.12
VARESE
0.08
BERGAMO
50 50
0.04
BRESCIA
NOVARA
MILANO
VERONA
0
-0.04
50 00
-0.08
TORINO
PIACENZA
-0.12
ALESSANDRIA
-0.16
PARMA
49 50
MODENA
Neural Networks mean PM10 (mg/m3)
0.2
SONDRIO
-0.2
-0.24
GENOVA
49 00
40 0
450
500
550
600
650
TCAM mean PM10 (mg/m3)
DEA - Università degli Studi di Brescia
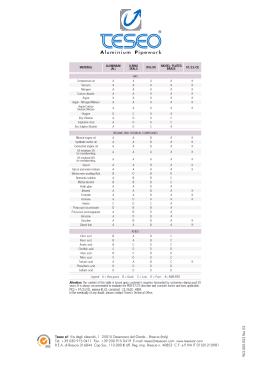
Objective 2
the emission reduction costs (C)
C (q )=
∑ p ∑k
( ( ) ( ))
C p,k E p,k q p,k , c p,k q p,k
p : precursor
k : CORINAIR macro sec tors
E ip, ,jk : ba sec ase emissions
q p,k : decision variables
c p,k : unit cost funcions estimated on the basis of RAINS database
DEA - Università degli Studi di Brescia
Optimization problem solution
•
Weighted Sum Method
min(a AQI (q ) + (1 - a ) C(q ))
q
•
0 £ q p,k £ R p,k
Constraints
1. Maximum Feasible Reductions:
k
1
2
3
4
5
6
7
8
9
10
11
VOC
0.00
0.68
0.00
0.19
0.33
0.33
0.47
0.06
0.06
0.00
0.00
NOx
0.76
0.39
0.34
0.80
0.00
0.00
0.29
0.25
0.00
0.00
0.00
NH3
0.00
0.00
0.00
0.00
0.00
0.00
0.00
0.00
0.00
0.58
0.00
PM10
0.24
0.59
0.09
0.40
0.00
0.00
0.41
0.39
0.82
0.00
0.00
SO2
0.72
0.56
0.60
0.80
0.00
0.00
0.76
0.59
0.00
0.00
0.00
p
2. Technologies reducing both precursors
DEA - Università degli Studi di Brescia
Pareto boundary
Optimization considering the 50% of cells (the most polluted)
1
5
2
6
7
3
4
4
3
5
6
7
2
8
1
DEA - Università degli Studi di Brescia
8
Emission scenario assessment
Scenario 4
Scenario 1
70
5150
Scenario 8
70
5150
65
SONDRIO
TRENTO
5100
TRENTO
5100
5050
NOVARA
VARESE
MILANO
VERONA
35
BERGAMO
5050
NOVARA
MILANO
20
PIACENZA
TORINO
20
PIACENZA
4950
10
MODENA
5
PARMA
4950
0
4900
450
500
550
600
650
VERONA
5
25
TORINO
20
PIACENZA
15
ALESSANDRIA
PARMA
4950
10
MODENA
450
500
550
600
650
5
0
mg/m3
mg/m3
GENOVA
4900
400
35
30
5000
0
GENOVA
4900
400
MILANO
10
MODENA
mg/m3
GENOVA
NOVARA
15
ALESSANDRIA
PARMA
35
25
5000
15
ALESSANDRIA
40
BRESCIA
30
25
TORINO
45
BERGAMO
5050
VERONA
55
50
VARESE
40
BRESCIA
30
5000
60
TRENTO
5100
45
40
BRESCIA
55
SONDRIO
50
45
BERGAMO
65
60
SONDRIO
55
50
VARESE
70
5150
65
60
400
450
500
550
600
650
DEA - Università degli Studi di Brescia
Domain population map
Center for International Earth
Science Information Network
(CIESIN), Columbia University.
51 50
320000
SONDRIO
TRENTO
51 00
280000
240000
GPWv3 dataset, available at:
http://sedac.ciesin.org/gpw
VARESE
BERGAMO
50 50
200000
BRESCIA
NOVARA
MILANO
VERONA
160000
120000
Dataset spatial resolution:
2.5 arc-minutes (roughly 5 km)
50 00
TORINO
PIACENZA
80000
ALESSANDRIA
PARMA
49 50
40000
MODENA
0
About 10 million people
GENOVA
49 00
40 0
45 0
50 0
55 0
60 0
65 0
DEA - Università degli Studi di Brescia
YOLL/year maps
Scenario 4
Scenario 1
8000
5150
7500
7000
SONDRIO
TRENTO
5100
6500
6000
5500
VARESE
8000
5150
7500
5000
BERGAMO
4500
5050
BRESCIA
MILANO
NOVARA
VERONA
SONDRIO
3000
5000
TRENTO
5100
6500
PIACENZA
2000
ALESSANDRIA
1500
PARMA
4950
1000
MODENA
500
0
VARESE
GENOVA
5000
BERGAMO
4900
4500
5050
BRESCIA
NOVARA
2500
TORINO
6000
5500
4000
3500
7000
MILANO
VERONA
400
4000
450
500
550
600
650
Scenario 8
3500
3000
5000
2500
TORINO
PIACENZA
8000
5150
7500
2000
ALESSANDRIA
1500
PARMA
4950
7000
SONDRIO
TRENTO
5100
6000
5500
1000
MODENA
500
VARESE
5000
BERGAMO
4500
5050
BRESCIA
NOVARA
MILANO
VERONA
3000
GENOVA
5000
[YOLL/year]
2500
TORINO
PIACENZA
2000
ALESSANDRIA
4900
1500
PARMA
4950
450
500
550
600
4000
3500
0
400
6500
1000
MODENA
650
500
0
GENOVA
4900
400
450
500
550
600
650
DEA - Università degli Studi di Brescia
YOLL vs emission reduction costs
2500
160
140
120
100
1500
80
1000
60
40
500
1
KYOLL/year
internal costs (M€
2000
2
3
4
5
6
20
0
0
1
2
3
4
5
6
7
8
scenario
emission reduction costs (M€)
KYOLL/anno
DEA - Università degli Studi di Brescia
7
8
External vs Internal costs
8000
7000
6000
1
2
M€
5000
3
4000
3000
4
2000
5
1000
6
0
1
2
3
4
5
6
7
8
scenario
emission reduction costs (M€)
external costs (M€/year)
M€/year gained
DEA - Università degli Studi di Brescia
7
8
Conclusions
•
Improvements of the multi-objective methodology:
– nonlinear source-receptor model based on different meteorological years
(1999 and 2004);
– spatial resolution of 10 km for PM10
(previous resolution of 30 km);
– external cost calculation.
•
The methodology is part of ASI QUITSAT project.
(Italian Space Agency Pilot Project for air quality assessment through the
fusion of E.O., ground-based and modelling data). Years 2006-2008.
•
We acknowledge Prof. Giorgio Guariso (Politecnico of Milan) for his
valuable help in external cost methodology implementation.
DEA - Università degli Studi di Brescia
Scaricare