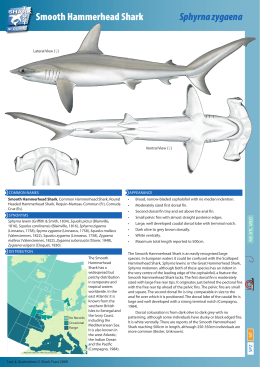
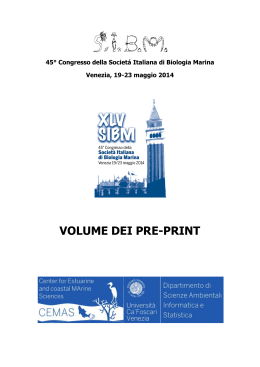
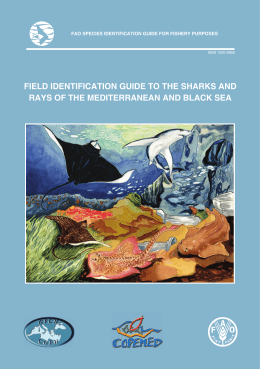
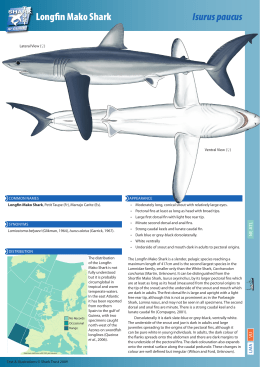
Int. J. Biosci. 2011 International Journal of Biosciences (IJB) ISSN: 2220-6655 (Print) 2222-5234 (Online) Vol. 1, No. 6, p. 14-26, 2011 http://www.innspub.net RESEARCH PAPER Studies on OPEN ACCESS population structure, mortality, growth and exploitation level of smooth hammerhead Sphyrna zygaena (L) (Carcharhiniformes - Sphyrnidae) in the coastal region of Kerala, India Sayd Manjusha1*, Balakrishna Madhusoodana Kurup2, NarayannaneSaravannane1, Veloorkirakathil Narayana Sanjeevan1 1 Centre for Marine Living Resources and Ecology, Ministry of Earth Sciences, Kochi 37, Kerala, India 2 Kerala University of Fisheries and Oceanic Studies, Cochin, India Received: 06 October 2011 Revised: 27 October 2011 Accepted: 28 October 2011 Key words: Sphyrna zygaena, growth, recruitment, yield per recruit, exploitation. Abstract The hammerhead sharks (Sphyrnidae), have a circumglobal distribution in tropical and warm-temperate waters, and the smooth hammerhead, Sphryna zygaena is a globally exploited. The current population status of S. zygaena captured from the Kerala coast of Indian Ocean was assessed in terms of yield-per-recruit and biomass-per-recruit analyses during 2008-2009. The growth parameters, asymptotic length (L∞) and growth coefficient (K) were estimated.The von Bertalanffy growth model resulted in growth parameters of L∞ = 362.25 cm and K=0.23 year-1. The average total, natural and fishing mortality coefficients were estimated as 0.35, 1.39 and 1.74 respectively appear to be appropriate for utilization of the stock. The present study reveals that the exploitation ratio of S. zygaena along the Kerala Coast of India is 0.8 and therefore the stock is overexploited. It can be concluded that Sphyrna zygaena is over exploited along the Kerala Coast and proper management steps have to be taken for maintaining the fishing effort of S. zygaena in the Indian ocean so as to result in higher economic yield thereby this fishery operates near biologically optimal level. Corresponding Author: Sayd Manjusha [email protected] 14 Manjusha et al. Int. J. Biosci. 2011 Introduction Myers et al., 2007). Fishing pressure can affect shark In fisheries science, `stock' first referred to any group stock structure, diversity, and biological parameters, of a fish species that was available for exploitation in a and in the worst of cases, could cause a species to given area.(Milton and Shaklee, 1987). To manage a become extinct (Stevens et al., 2000). Smooth fishery effectively, it is important to understand the hammerhead is caught with a variety of gears, stock structure of a species and how fishing effort and including with pelagic longlines, handlines, gillnets, mortality are distributed (Gavin and John,1999). An purse-seines and pelagic and bottom trawls (Bonfil understanding of stock structure is vital to designing 1994, Maguire et al., 2006). In the Indian Ocean and appropriate management regulations in fisheries adjacent waters, information related with the biology, where stocks are differentially exploited (Ricker, 1981). fishery and landings of sharks is scarce or non-existent. Still, management regulations are needed to help The hammerhead sharks (Sphyrnidae),which have a conserve this valuable fishery. There are no reports circumglobal distribution in tropical and warm- presently available on the population parameters, temperate waters, are represented by two genera, i.e. mortality and exploitation of S. zygaena from coastal Eusphyra and Sphyrna, that contain one and seven waters of India. The knowledge of various population species, 2005) parameters and the exploitation level (E) of that Sphyrna population is required for the proper management of S. mokarran, scalloped, S. lewini, and smooth, S. zygaena resources. The objective of the present study zygaena, are caught in a variety of fisheries including was to estimate the population characteristics and the artisanal and small-scale commercial fisheries, bottom exploitation level of S. zygaena to assess the stock longlines as well as offshore pelagic longlines. position of the species from the Indian coastal waters. respectively Hammerhead (Compagno sharks, primarily et al., great, Hammerheads are generally suffering high bycatch mortality (IUCN, 2008). Previous reports revealed that Materials and methods (Clarke et al., 2004a, 2006a, 2006b), hammerheads The present study was based on the preliminary data are the collected from the Indian waters by scientific observers international fin trade. The combination of increasing the second-most on onboard long line fishing trawl net using vessels exploitation and well-documented susceptibility of targeting fish and tuna. Random sampling was done shark to monthly between February 2008 and December 2009. overfishing has made conservation and management, Once captured, sharks were identified to the lowest an issue of urgent and international concern (Bonfil taxonomic level possible species level by FAO manual 1994; Weber and Fordham 1997; FAO 2000; Musick et (FAO, 1994). During the study, observers collected al., 2000a; NMFS 2001; Baum et al., 2003). digital images of the shark species caught by the populations to abundant collapse species in in response fishery to validate identification. The details of length, There are only limited published biological data on S. weight, sex were taken by following standard methods. zygaena, despite its widespread occurrence. In The total length (TL) was measured from the most general, sharks have a combination of biological anterior part of the cephalofoil head to the farthest tip characteristics, such as slow growth, late maturation of the caudal fin, the total weight (W) of the fish was and extremely recorded to the nearest 10 using a spring balance susceptible to overfishing (Stevens et al., 2000). (Zacharia and Nataraja, 2003). A total of 200 Recent studies have revealed a significant reduction in specimens of S. zygaena 55-185 cm TL were measured abundance of large predatory fishes, including sharks, during the study period. low fecundity that make them in the Atlantic and in Indian Ocean (Baum et al., 2003; 15 Manjusha et al. Int. J. Biosci. 2011 Estimation of growth parameters The ascending left arm of the length-converted catch Length-based stock assessment methods were used for curve was used to analyze the probability of capture of the present study. Length data were grouped into 10 each length class according to the method of cm length groups. Subsequently the monthly length Pauly,1992. By plotting the cumulative probability of frequency distributions were analyzed using the FiSAT capture against mid-length we obtain a resultant curve computer software as explained in detail by Gayanilo et from which the length at first capture was taken as al.,(1997). The parameters of von Bertalanffy growth corresponding to the cumulative probability at 50%. function (VBGF), asymptotic length (L∞) and growth co-efficient (K) were estimated using ELEFAN-1 The recruitment pattern of the stock was determined routing incorporated into the FiSAT software. K-Scan by backward projection on the length axis of the set of routine was conducted to assess a reliable estimate of available length–frequency data as described in FiSAT. the K value. This routine reconstructs the recruitment pulse from a time series of length–frequency data to determine the The inverse von Bertalanffy growth equation (Sparre number of pulses per year and the relative strength of and Venema, 1992) was used to find the lengths at each pulse (Nurul et al.,2009). Input parameters were various ages. Then VBGF was fitted to estimates of L∞, K. Normal distribution of the recruitment pattern length-at-age was determined by NORMSEP (Pauly and Caddy, curve using non-linear squares estimation procedures (Pauly et al., 1992). The VBGF is defined by the equation: Lt = L∞[1 −e−k (t−t0)] 1985) in FiSAT. To estimate length at recruitment where (Lr) the midpoint of the smallest length group in the Lt is the mean length at age t; L∞ is the asymptotic catch was taken as length at recruitment (Murty et al., length; t is the age of S. zygaena and to 1992).The is the estimated length structured virtual hypothetical age at which length is zero (Newman, population analysis (VPA) and cohort analyses were 2002). done according to the FiSAT routine (Fry,1949; Pauly,1984; Jones,1984). The values of L∞, K, M, F, a Total mortality coefficient (Z) was estimated by using (constant) and b (exponent) for the species were used length converted catch curve method using ELEFAN as inputs to a VPA analysis in the FiSAT routine. The t0 II. Natural mortality rate (M) was estimated using value was taken as zero (Nurul et al., 2009). Pauly‘s empirical relationship (Pauly, 1980); relative yield-per-recruit (Y/R) and relative-biomass- Log M = - 0.0066 - 0.279 Log L∞+ 0.6543 Log K + per recruit (B/R) values as a function of E were 0.4634 Log10 T determined from the estimated growth parameters and where M is the natural mortality, L∞ the asymptotic probability of capture by length (Pauly and Soriano length, K refers to the growth coefficient of the VBGF 1986). The relative Y/R and B/R were estimated by and T is the mean annual habitat temperature ( 0C) of keeping the Lc constant. With the help of different the water in which the stocks live. Once Z and M were exploitation ratios (E) on the ‗X‘ axis and different obtained, then fishing mortality (F) was estimated sizes at first capture by using LC/L ratios on ‗Y‘ axis, using the relationship; isovalues of Y/R were plotted to generate the isopleths F = Z −M diagram. The calculations were carried out using the where Z is the total mortality, F the fishing mortality FiSAT software package. The input requirements in the and M is the natural mortality. The exploitation level procedure were the values of LC /L∞ and M/K. From the (E) was obtained by the relationship of Gulland (1965): analysis, the maximum allowable limit of exploitation F [E = /Z= F/ F +M] (Emax ) giving maximum relative yield-per-recruit was The estimated. Also E=0.1, the exploitation rate at which 16 Manjusha et al. Int. J. Biosci. 2011 the marginal increase in relative yield-per-recruit is L∞=362.25 cm respectively is as shown in Fig. 1A and 10% of its value at E=0 and E =0.5, the exploitation Fig. 1B. For these estimates through ELEFAN I the rate corresponding to 50% of the unexploited relative response surface (Rn) was 0.258 for the curve. The biomass-per-recruit (B/R), were estimated. computed growth curves superimposed on the restructured length- frequency histograms with those Results parameters is as shown in Fig.1B. The black and white Growth parameters bars are positive and negative deviation from the K scan values and the VBGF parameters L∞ and for the ―weighted‖ moving average of three length classes and period 2008-09 were estimated as K=0.23 year-1; they represent pseudo-cohorts. Fig. 1A. Estimation K of S. zygaena in the coast of Kerala. Fig. 1B. Von Bertalanffy Growth curve for S. zygaena by ELEFAN I superimposed on the restructured lengthfrequency diagram (L=362.25cm and K=0.23 year-1; C=0, WP=0 and Rn=0.258). 17 Manjusha et al. Int. J. Biosci. 2011 Mortality parameters the catch curve utilized in the estimation of Z. The The estimated mortality parameters Natural mortality darkened quadrilateral represents the points used in (M), Fishing mortality (F) and Total mortality (Z) were estimating Z through least square line regression. The 0.35, 1.39 and 1.74 respectively. According to Sparre blank circles represent points either not fully recruited and Venema (1993) the fishes with moderate K values or nearing L∞ and hence not considered for the are characteristic with moderate natural mortality, and calculation. Good fit to the descending right hand it is related to age and size of fish. K value in the limits of the catch curve was considered. present study is 0.23 year-1 and the corresponding M value is 0.35. Therefore the M/K ratio is found to be Virtual population analysis 1.52. The fishing mortality (F) was calculated by Results of the VPA using the length frequency data for subtraction of M from Z and it was found to be 1.39 the year showed that fishing mortality (F) was where M was 0.35 and Z was 1.74. Fig. 2 represents maximum in the size group of 200-255 cm (Fig. 3). Fig. 3. Length – structured Virtual Population Analysis of Sphyrna zygaena for the year. Recruitment pattern and M/K where it was 0.40 and 1.52 (Fig. 5). The plot Results of the analysis of recruitment pattern are of yield per recruit (Y/R) against E is shown in (Fig. 5) shown in Fig. 4. The peak of normal distribution was where the maximum (Y/R)' was obtained at Emax= 0.60 inferred by NORMSEP program for determining the as the exploitation rate increases beyond this value, recruitment pattern (Pauly and Caddy, 1985).This can relative yield per recruit decreases towards zero level. be interpreted as two recruitment peaks throughout Both of E= 0.1 (the level of exploitation at which the the year, one around March and the other around marginal increase in yield per recruit reaches 1/10 of June. The percent recruitment varied from 17.85% the marginal increase computed at a very low value of (April) to 21.85% (July). (Fig. 4). E and E= 0.5 (the exploitation level which will result in Relative Yield Per Recruit (Y/R) and Biomass Per a reduction of the unexploited biomass by 50%) were Recruit (B/R) estimated. Emax value was found from the yield-per The Relative yield per recruit (Y/R) and Biomass per recruit and biomass per recruit model (Fig. 5). The recruit (B/R) were determined as a function of LC/L∞ estimated values of E=0.1 and E=0.5 were 0.51 and 18 Manjusha et al. Int. J. Biosci. 2011 0.33 respectively. The results indicated that the the maximum (Y/R) so that it indicates that it is present levels of E and F were higher value, which give overexploited in nature. Fig. 4. Annual recruitment pattern of Sphyrna Fig. 5. Relative Yield/recruit and Biomass/recruit zygaena. (Knife- edge selection) of Sphyrna zygaena. important roles in controlling population size and Discussion Concerns species status and prey (Cortes, 1999). elasmobranch populations around the world are being fishing affect the composition and diversity of raised Elasmobranch elasmobranch and total fish assemblages through vulnerability to directed fishing pressure and indirect trophic interactions (Stevens et al., 2000). A cost- losses due to bycatch is well established (Baum and effective way to foster elasmobranch conservation Myers, 2004). This vulnerability is regarded as a direct among citizens and the government officials is consequence of inherent elasmobranch life history development of education programmes that increase characteristics, which feature a pattern of slow growth, awareness of the value of elasmobranchs as a living late maturity, long gestation, low fecundity, and long resource and their vulnerability to overfishing (Castro life, resulting in a slow intrinsic rate of population et al., 999). international conservation their Increasing evidence suggests that indirect effects of an the of of at over diversity level. increase (Pratt and Casey, 1990; Cortes, 2000). Worldwide, many elasmobranch populations are now Sharks constitute an important predator group in depleted and some are considered threatened or marine ecosystems and consequently play an essential critically endangered (Fowler et al., 2002). The long- role on energy exchange within the highest trophic term ecological effects of depleted elasmobranch levels (Wetherbee and Cortés, 2004). For centuries, populations are largely unknown but likely to be far- humans have conducted fishing for sharks in a reaching (Cortes, 1999; Stevens et al., 2000). sustainable manner by the use of artisanal fishing methods (FAO, 1998). Recently, modern technology in Elasmobranchs are ecologically important components combination with an increase demand for sharks in virtually every marine habitat (Compagno, 1990b). products have resulted in increasing effort and yield of Actively predaceous sharks, in particular, may play 19 Manjusha et al. Int. J. Biosci. 2011 shark catches, as well the expansion of fishing areas April to July, adults were most common; and (3) from (Bonfil, 1994). August to September, neonates were most numerically abundant. Such patterns were associated with Hammerhead sharks can also be considered as a reproductive tactics that may reduce intra-specific and complex of three species: scalloped (Sphyrna lewini), inter-specific competition with hammerhead shark great (Sphyrna mokarran), and smooth hammerheads neonates (S. lewini), probably result in reduced natural (Sphyrna of mortality of the offspring during their first few months hammerhead sharks is of concern (Myers et al., 2007). zygaena). The current status (Fabio et al., 2005; Piercy et al., 2007). In earlier Compagno (1984) reported that the species reaches a studies the high correspondence between modal length maximum size of 370–400 cm TL. Stevens (2000) classes and the half year classes suggests that the reported that off the east coast of Australia males population of Sphyrna zygaena is made up of two mature at about 250–260 cm TL and females at about cohorts each year, as a consequence of two separate 265 cm TL. Although few data are available on the and well-defined recruitment periods. On the other Smooth Hammerhead‘s life-history characteristics, it is hand, the modal progression analysis of the size a large hammerhead shark and presumably at least as distribution of S.zygaena caught in 1995 shows four biologically vulnerable as S. lewini. The smooth size classes (Castro et al., 1999). hammerhead is a coastal-pelagic and semi-oceanic and occurs on the continental shelf, to 200 m depth (Ebert The Relative yield per recruit (Y/R) and Biomass per 2003) and viviparous mode of reproduction with recruit (B/R) were determined as a function of LC/L∞ females giving birth to live young (Hayes et al., 2007). and M/K in the present study were 0.28 and 1.5. According to Sparre and Venema (1992) the fishes with The L∞ value obtained from study as 362.25 cm TL and K value obtained from study as 0.23 year-1 moderate K values are characteristic with moderate obtained in natural mortality, and it is related to age and size of the the present study (L= 362.25, K= 0.23 are similar to fish. K value in the present study is 0.40/year and the the values of the growth parameters of Sphyrna corresponding M value is 0.60. Therefore the M/K Lewini obtained from South Africa, (Chen et al., 1990). ratio of S. zygaena is found to be 1.5. The M/K ratio is This should be due to the limited published biological found to be constant among the closely related species data on S. zygaena, despite its widespread occurrence. (Beverton and Holt, 1959) and the M/K ratio in fishes generally falls within the limit of 1.5-2.5. This study also elucidate that the recruitment pattern Hammerheads have relatively moderate productivity of S. zygaena shows two recruitment peaks per year. depending on the species (Cortés 2002). Species- The highest (21.85%) and lowest (17.85%) percent specific stock assessments for hammerheads are recruitment was observed in the months of July and generally lacking but some studies have reported large April (Fig. 4). It is seen that S. zygaena spawns in declines in relative abundance. In light of limited catch surface waters and their reproductive season is statistics, analysis of trade data for shark products has extensive spawning and been proposed as a means of tracking relative viviparous with a yolk-sac placenta; size at birth 50 to extraction rates and warning of potential declines not 61 cm (Compagno, 1984). According to Fabio et al., documented by catch data (Clarke, 2004a). Recent (2005) from Brazil that the occurrence of this species studies have shown that for the few sharks for which occurred all year long were recognized as three long-term catch data are available on a regional level, seasonal size-class patterns (1) between October and several species appear to be in severe decline (>50%, March, the juveniles were more frequent; (2) from Baum et al., 2003). Such large declines even in areas with frequent multiple 20 Manjusha et al. Int. J. Biosci. 2011 where some management is practiced (e.g., the Pratt and Otake (1990) suggests research in several northwest Atlantic) have led to concerns that the same categories of reproductive data that may be useful in or even greater declines have occurred in regions managing where catch goes largely unrecorded and management ‗‗hammerheads‘‘, a group consisting primarily of three, is minimal or non-existent (Bonfil 1997; Castro et al., large-bodied species: (Sphyrna lewini, S. mokarran 1999; Baum et al., 2003). A recent assessment for a and S. zygaena) have been estimated as high as 89% hammerhead complex (i.e., S. lewini, S. mokarran, since 1986 in the northwest Atlantic (Baum et al., and S. zygaena) in the northwest Atlantic Ocean found 2003), and these species are part of a large coastal about a 70% decline in abundance from 1981 (Jiao et shark complex that is considered overfished and al., 2008). According to Maguire et al., (2006), the managed under a quota system by the United States state of exploitation for species is unknown except (NMFS, 2006). These three species are caught scalloped hammerheads, which are reported as fully- incidentally in large numbers worldwide by multi- to over exploited. The most recent IUCN red list species fisheries and harvested locally in many regions assessments lists the most of the species of Sphyrnidae for their meat (Rose, 1996). Accompanying the as Endangered globally (IUCN 2008). recognition that many sharks are especially sensitive to fisheries. Catch rate declines for exploitation due to their life history characteristics According to Gulland (1971) the Exploitation ratio (E) (slow growth, late maturity, low fecundity), and that will be more than 0.5 for the stocks supposed to be different species have varying natural capacities to over fished. In the present study, it could be seen that respond to fishing pressure (Smith et al., 1998; Musick E=0.8 which is very high than the optimum E of 0.5. It et al., 2000b; Corte´s 2002), is the realization that can be concluded that Sphyrna zygaena is over conservation and management measures are needed exploited proper on a species specific rather than group-specific basis to management steps have to be taken for maintaining prevent the unrecognized overexploitation of any the fishing effort of S. zygaena in the Indian ocean so single species (Walker et al.,2005; FAO 2000; NMFS as to result in higher economic yield thereby this 2001). Within the hammerheads, for example, the fishery operates near biologically optimal level. It was schooling nature of S. lewini and S. zygaena makes observed that a standardized catch-rate index of a them vulnerable to fisheries because they concentrate hammerhead complex (i.e., S. lewini, S. mokarran, in often predictable locations and are thus easily and S. zygaena) from commercial fishing data in the caught in large numbers. S. mokarran tends to be U.S. pelagic longline from observer data between 1992- more solitary, but has a lower reproductive potential 2005 estimated a decline of 89% (Baum et al.,2003; because it reproduces biennially as opposed to Anislado and Robinson 2001). Scalloped hammerhead annually as do S. lewini and S. zygaena (Castro et sharks are often targeted by some semi-industrial, al.,1999). along the Kerala Coast and artisanal and recreational fisheries and are a bycatch in industrial fisheries (pelagic longline and Concerns about shark population sustainability in the swordfish fisheries and purseseine fisheries) in the face of growing exploitation for fins and other Indian Ocean. S. lewini is captured in various fisheries products, and the consequences of large-scale apex throughout the western Indian Ocean. Countries with predator major fisheries for sharks include the Maldives, Kenya, prompted calls for worldwide implementation of Mauritius, Seychelles and United Republic of Tanzania management and conservation measures for sharks (Young, 2006). Sharks are considered fully- to over- (FAO 1998, 2000; Musick et al., 2000a). An important exploited in these waters (Young, 2006.) requirement for such measures to be effective is the 21 Manjusha et al. tuna removal on marine ecosystems have Int. J. Biosci. 2011 availability of reliable information on shark catch and increasing of marine deep sea fishing) which modify trade on a species-specific basis, data that has been the increase of fishing mortality in the sea species largely missing for most shark species. This feature, populations. together with the substantial catches of S. zygaena and the Sphyrna relative yield suggests that this species is Acknowledgments likely to be maximum exploited may be due to over We wish to thank the Ministry of Earth Sciences, Govt. overfishing in Indian waters. Furthermore, the removal of India, New Delhi for their financial assistance. The of large numbers of this apex predator will presumably authors are grateful to Diana Benjamin, Rajisha R and be affecting the trophic structure in the waters in all others who were helped in the work. which it is fished. There is no published report on recruitment of S. zygaena from Indian waters. The References overexploitation (E = 0.8) of this species in the Indian Anislado TV, Robinson MC. 2001. Age and growth waters may be due to over fishing. Relative yield per for the scalloped hammerhead shark, Sphyrna lewini recruit (Y/R) and biomass per recruit (B/R ) suggested (Griffith ans Smith, 1834) along the central Pacific that the E=0.8 should be reduces to obtain maximum coast of Mexico. Ciencias Marinas 27,501-520. (Emax = 0.3) sustainable exploitation rate for this species. Hence, necessary measures should be Beverton RJ, Holt SJ. 1959. A review of the life developed for the sustainable management and spans and mortality rates of fish in nature and their conservation measures for sharks. Concerns about relation shark population sustainability in the face of growing characteristics. CIBA Colloquium on ageing exploitation for fins and other products, and the 180. to growth and other physiological 5,142- consequences of large-scale apex predator removal on marine ecosystems have prompted calls for worldwide Baum JK, Myers RA, Kehler DG, Worm B, implementation of management and conservation Harley SJ, Doherty PA. 2003. Collapse and measures for sharks. It is therefore, concluded that the conservation of shark populations in the northwest proper management may be taken to decrease the Atlantic. Science 299, 389–392. fishing effort to bring the catch to maximum sustainable yield levels (MSY) for sustaining the Baum JK, Myers RA, 2004. Shifting baselines and smooth hammer head fishery. the decline of pelagic sharks in the Gulf of Mexico.Ecology Letters 7, 135-145. The present study gives an insight to the exploitation ratio of S. zygaena and associated population Bonfil R. 1994. Overview of World Elasmobranch parameters in the Kerala Coast of Indian waters. Fisheries. FAO Fisheries Technical Paper, Rome, 341. Further detailed study is required to elucidate role of overfishing in deep sea Sphyrna zygaena groups, the Bonfil R. 1997. Status of shark resources in the recruitment, mortality and associated population southern Gulf of Mexico and Caribbean: implications parameters for management. Fisheries Research 29, 101–117. since it is essential for effective management of S. zygaena in the face of growing exploitation and the consequences of large-scale apex Castro J, Woodley CM, Brudek RL, 1999. A predator removal on marine ecosystems. Despite the preliminary evaluation of the status of shark species. above uncertainties a part of the above results could be FAO Fisheries Technical Report Papers FAO, Rome, attributed on a long-term effect of human actions (i.e. 380. 22 Manjusha et al. Int. J. Biosci. 2011 Chen CT, Leu TC, Lou SH,1990. Age and growth Cortes of scalloped hammer head shark Sphyrna lewini in correlations in sharks., Reviews in Fisheries E. 2000. Life history patterns and North eastern Taiwan waters. Pacific science 44,150- 8, 299- 344. Science 170. Cortés E. 2002. Incorporating uncertainty into Clarke SC, Mcallister MK, Michielsens GJ, demographic modelling: application to shark 2004a. Estimates of shark species composition and populations and their conservation. Conservation numbers associated with the shark fin trade based on Biology 16, 1048–1062. Hong Kong auction data. Journal of Northwest Atlantic Fisheries Science 35,453-465. Ebert DA. 2003. The sharks, rays and chimaeras of California, University of California Press. Clarke SC, Magnussen JE, Abercrombie DL, McAllister MK, Shivji, MS. 2006a. Identification Fabio SM, Otto BF, Gadig R, Namora C, of Shark Species Composition and Proportion in the Francisco SB. 2005. Size and sex compositions, Hong Kong Shark Fin Market Based on Molecular length–weight relationship, and occurrence of the Genetics and Trade Records. Conservation Biology Brazilian sharpnose shark, Rhizoprionodon lalandii, 20, 201-211. caught by artisanal fishery from southeastern Brazil. Fisheries Research 74, 16-126. Clarke SC, McAllister MK, Milner-Gulland EJ, Kirkwood GP, Michielsens CG, Agnew, DJ, FAO,1994. FAO species identification guide for Pikitch EK, Nakano H, Shivji MS, 2006b. Global fishery purposes, Food and Agriculture organization of Estimates of Shark Catches using Trade Records from the United Nations, Rome. Commercial Markets. Ecology Letters 9, 1115-1126. FAO,1998. International Plan of Action for the Compagno, L.J.V., 1990b. Alternative life-history conservation and management of sharks. Food and of Agriculture Organization, Rome. cartilaginous fishes in time and space. Environmental Biology of Fishes, 28, 33-75. FAO, 2000.Conservation and Management of Sharks. Compagno LJ. 1984. Sharks of the world. An annotated an illustrated catalogue of sharks species In FAO Technical Guidelines for Responsible Fisheries, Rome, 4- 37. known to date, Carcharhiniformes, FAO, Rome. FAO Fish. Synop. 125, 251-655. Fry. 1949. Statistics of lake trout fishery. Biom 5, 2767. Compagno LJ, Dando M, Fowler, SL. 2005. Sharks of the World. Harper Collins. Fowler SL, Reed TM, Elasmobranch Dipper FA, 2002. biodiversity, management: trophic levels of sharks. ICES Journal Seminar and Workshop, Sabah, Malasia, July 1997. Science, 56, 707- 717. Marine the International Gland and Cambridge: IUCN SSC Shark Specialist Group. 23 Manjusha et al. of and Cortes E. 1999. Standardized diet compositions and of Proceedings conservation Int. J. Biosci. 2011 Gayanilo FC, Sparre P, Pauly, D. 1997. The FAO- Journal of Marine and Freshwater Research 38, 727- ICLARM Stock Assessment Tools (FiSAT) User‘s 742. Guide. FAO, Rome. 124. Myers RA, Baum JK, Shepherd TD, Powers SP, Gavin AB, John RW,1999. An holistic approach to Peterson CH, 2007. Cascading effects of the loss of fish stock identification. Fisheries Research 43, 35-44. apex predatory sharks from a coastal ocean. Science 315, 1846-1850. Gulland JA. 1965. Estimation of mortality rates. In: Annex to Arctic Fisheries Working Group Report Ed.by Murty V, Srinath MP, Livingston, P.H. Cushing In Key Papers on Fish Populations, IRL Appannasastry Y, Srinivasarengan S. 1992. Press, Oxford, 231–241. Stock assessment of silverbellies of India with particular reference to Andhra Pradesh and Tamil Gulland JA. 1971. The Fish Resources of the Nadu. Indian Journal of Fisheries 39, 42-64. Ocean.1st Edn., Fishing News Books, London,255. Musick JA, Burgess G, Caillet G, Camhi M, Hayes PM, Smit NJ, Davies AJ. 2007. Pathology Fordham S. 2000a. Management of sharks and associated with parasitic juvenile gnathiids feeding on their relatives (Elasmobranchii). Fisheries research 25, the puffadder shyshark, Haploblepharus edwardsii 9–13. (Voight). Journal of Fish Diseases 30, 55-58. Musick JA, Berkeley SA, Cailliet GM, Camhi M, IUCN, 2008. IUCN Red List of Threatened Species. Huntsman G, Nammack M, Warren, http://www.iucnredlist.org. ML.2000b. Protection of marine fish stocks at risk of extinction. Fisheries research 25, 6–8. Jiao Y, Hayes C, Cortés E. 2008. Hierarchical Bayesian approach for population dynamics modelling Myers RA, Baum JK, Shepherd TD, Powers SP, of fish complexes without species-specific data. ICES Peterson, CH. 2007. Cascading effects of the loss of Journal of Marine Science, 367 - 377. apex predatory sharks from a Coastal Ocean. Science 315, 1846-1850. Jones R. 1984. Assessing the effects of changes in exploitation pattern using length composition data Newman (with notes on VPA and cohort analysis).FAO Fisheries preliminary estimates of longevity and mortality in the Technical Papers 256, 118. moses perch, Lutjanus russelli (Indian ocean form), from Maguire JJ, Sissenwine M , Csirke J, Grainger SJ. 2002. Growth, age estimation and continental shelfwaters off north-western Australia. Asian Fisheries Science 15,283–294. R, Garcia, S. 2006. The state of world highly migratory, straddling and other high seas fishery NMFS. 2001. Final United States National Plan of resources and associated species. FAO Fisheries. Action for the Conservation and Management of Sharks. US Department of Commerce, National Milton DA, Shaklee JB, 1987. Biochemical genetics Oceanic and Atmospheric Administration, National and Marine Fisheries Service Report. population Macruronus structure novaezelandiae of blue (Hector) grenadier, (Pisces: Merluccidae), from Australian waters. Australian 24 Manjusha et al. Int. J. Biosci. 2011 NMFS (National Marine Fisheries Service). Pratt HL Jr , Casey JG. 1990. Shark reproductive 2006. SEDAR 13 Stock Assessment Report. U.S. strategies as a limiting factor in Department of Commerce, National Oceanic and with a review of Holden‘s method of estimating growth Atmospheric Administration, Highly Migratory Species parameters. NOAA Technical Report NMFS, 90, 97- Division, Silver Spring, Maryland. 109. Nurul A, Arshad S, Japar S. 2009. Population Pratt HL Jr , Otake T. 1990. Recommendations structure, Growth,Mortality and yield per recruit of for work needed to increase our knowledge of segistid reproduction relative to fishery management. NOAA shrimp, Acetes japonicus (Decapoda- segestidae) from the coastal waters of Malacca of directed fisheries, Technical Report NMFS 90, 509- 510. Penisular Malasia. Indian journal of Marine sciences 38, 57-68. Ricker WE, 1981. Changes in the average size and average age of Pacific salmon. Canadian Journal of Pauly D.1980. On the interrelationships between Fisheries and Aquatic Science 38, 1636-1656. natural mortality, growth parameters and mean environmental temperature in 175 fish stocks. Journal Rose DA. 1996. Shark fisheries and trade in the of Conservation and International Exploration 39, Americas, Volume 1: North America. TRAFFIC, 175–192. Cambridge, U.K. Pauly D.1984. Fish population dynamics in tropical Smith waters: rebound potentials of 26 species of Pacific sharks. a manual for use with programmable SE, Au DW, Show C. 1998. Intrinsic calculators. ICLARM Review 325. Marine and Freshwater Research 49, 663–678. Pauly D, Caddy JF.1985. Method for the analysis of Sparre mixtures of normal distributions. FAO Fish. Circ. 16 . Tropical Fish Stock Assessment, Part 1—Manual. FAO P, Venema S.C. 1992. Introduction to Fisheries Technical Paper 306, 376. Pauly D, Soriano ML. 1986. Some practical extensions to Beverton and Holt s relative yield per Stevens JD, Bonfil R, Dulvy NK, Walker PA. recruit model. In First Asian Fisheries forum, pp149- 2000. The effects of fishing on sharks, rays, and 495. Ed. by Maclean, J.L., Dizona,L.B and Lilosillos, chimeras (chondrichthyans), and the implications for L.V., Asian Fisheries Society, Manila, Philippines. marine ecosystems. ICES Journal of Marine Sciences 57, 476–494. Pauly D, Soriano BM, Moreau J, Jarre A. 1992. A new model accounting for seasonal cessation of Stevens JD.2000. Biological observations on sharks growth in fishes. Australian Journal of Marine and caught by sports fishermen off New South Wales. Freshwater Research 43, 1151–1156. Australian Journal of Marine and Freshwater Research 35, 573–590. Piercy AN, Carlson JK, Sulikowski JA, Burgess G, 2007. Age and growth of the scalloped Te Mancera E, Mendo J,1996. Population hammerhead shark, S. lewini, in the north west dynamics of the oyster Crassostrea rhizophorae from Atlantic Ocean and Gulf of Mexico. Marine and the Cienaga Grande de Santa Marta, Colombia. Freshwater Research 58, 34-40. Fisheries Research 26, 139–148. 25 Manjusha et al. Int. J. Biosci. 2011 Tolentino VA, Mendoza CR. 2001. Age and Conservation. TRAFFIC International and Center for growth for the scalloped hammerhead shark, S. lewini Marine Conservation Report, 140. (Griffith and Smith, 1834) along the central Pacific coast of Mexico. Ciencias Marinas 27,501- 520. Wetherbee BM, Cortes E. 2004. Food consumption and feeding habits. In Biology of Sharks Vakily JM.1989. The biology and culture of mussels and their Relatives. Ed. by J.C.Carrier, J.A. Musick and of the genus Perna. ICLARM Review 17, 63. M.R. Heithaus, CRC Press, New York, USA. 250. Walker P, Cavanagh RD, Ducrocq M, Fowler Young C. 2006. Review of the state of world marine SL. capture fisheries management in Indian Ocean. FAO 2005. Northeast Atlantic (Including Mediterranean and Black Sea) Sharks, Rays and Fisheries Technical Paper. FAO, Rome, Italy. Chimaeras. In: Status of the Chondrichthyan Fishes, pp 71-94. Ed by S.L. Fowler, R.D. Cavanagh, M. Camhi, Zacharia PU, Nataraja GD. 2003. Fishery and G.H. Burgess, G.M. Cailliet, S.V. Fordham, C.A. biology of threadfin bream, Nemipterus mesoprion Simpfendorfer and J.A. Musick. from Mangalore Malpe. Indian Journal of Fisheries 50, 1-10. Weber ML, Fordham SV. 1997. Managing shark Fisheries: Opportunities for 26 Manjusha et al. International
Scaricare