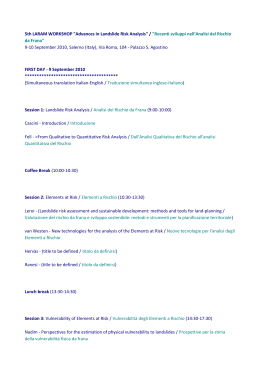
DOI: 10.4408/IJEGE.2011-01.S-05 ANALISI DI SENSITIVITÀ SUI PRINCIPALI FATTORI CHE INFLUENZANO IL FENOMENO DI OCCLUSIONE D’ALVEO PER FRANA A SENSITIVITY ANALYSIS ON MAIN FACTORS INVOLVED IN THE LANDSLIDE DAM PHENOMENA CORRADO CENCETTI, PIERLUIGI DE ROSA & ANNALISA MINELLI(*) (*) Università degli Studi di Perugia - Dipartimento di Ingegneria Civile e Ambientale - Via G. Duranti. 93 - 06125 Perugia, Italy E-mail: [email protected] RIASSUNTO ABSTRACT La nota propone un’analisi statistica e di sensitività su alcuni parametri che svolgono un ruolo di rilievo nel fenomeno delle occlusioni d’alveo per frana (landslide dams), intendendo, per “analisi di sensitività”, “... lo studio di come l’incertezza di un risultato, derivante da un modello matematico, può essere ripartita, qualitativamente o quantitativamente, tra le diverse sorgenti di incertezza in input al modello stesso ...” (SALTELLI et alii, 2008). A tal fine i parametri di cui sopra sono stati correlati con un indice che descrive il grado di interazione tra le frane di versante e i sistemi alveo - pianura alluvionale, proposto da CENCETTI et alii (2001) e che si basa sulla definizione delle caratteristiche geometriche e morfologiche dei due processi interagenti (movimento franoso da una parte e dinamica dell’alveo dall’altra). È stato poi impiegato un modello di tipo Cellular Automata (CAESAR - COULTHARD et alii, 2007), che simula l’evoluzione morfologica degli alvei fluviali conseguente alle modifiche dell’apporto sedimentario e implementa al suo interno un modello di trasporto dei sedimenti in grado di riprodurre i cambiamenti morfologici sia a scala di bacino idrografico, sia a scala di tratto fluviale. Di recente il codice è stato opportunamente modificato (DE ROSA, 2008) per tener conto dell’eventuale apporto sedimentario in alveo da versante. Grazie a questa modifica è possibile modellare il fenomeno conseguente all’interazione tra le frane di versante e gli alvei fluviali. Prendendo poi in considerazione i parametri indicati da CASAGLI & ERMINI (1999), si è scelto di concentrare l’analisi sui fattori “volume della frana” (cioè del corpo che costituisce lo sbarramento), “durata del movimento franoso” e “portata liquida” del corso d’acqua interessato dallo sbarramento stesso. Tramite una serie di simulazioni effettuate applicando il modello CAESAR, si è ottenuto un campione significativo di eventi a cui è stata applicata un’analisi di tipo statistico, per valutare la sensitività di ogni singolo parametro rispetto agli altri; è stato quindi valutato il “peso” che ogni singolo fattore assume nell’analisi dell’evoluzione del fenomeno delle landslide dams. Mentre la maggior parte degli studi condotti in letteratura hanno la precisa finalità di prevedere (e quindi, se possibile, di prevenire) il rischio di crollo dello sbarramento d’alveo formatosi in seguito a un evento franoso, valutandone la stabilità, il lavoro svolto in questa This paper is about a statistical analysis and sensitivity analysis on the main factors directly involved in the landslide dam phenomena, meaning, for “sensitivity analysis”, “... the study of how the variation (uncertainty) in the output of a mathematical model can be apportioned, qualitatively or quantitatively, to different sources of variation in the input of the model ...” (SALTELLI et alii, 2008). With this aim these parameters have been linked each other with a dimensionless index which describes the degree of correlation through the landslides and the river-alluvial flat. This index has been first purposed by CENCETTI et alii (2001) and it is based on the definition of geometrical and morphological characteristics of the two interacting processes (landslide and river processes). The software used to simulate the evolution of the two processes in time is a Cellular Automata model (CAESAR - COULTHARD et alii, 2007). This model is able to predict the morphological evolution of the river (at reach or basin scale) resulting from sediment supply variations and it implements a sediment transport model able to reproduce the morphological changes. Recently the code has been updated (DE ROSA, 2008) to consider the eventual sediment supply from a bank (e.g. landslide). Whit this last update it is possible to model the landslide dam phenomena. Considering the parameters showed by CASAGLI & ERMINI (1999), let’s choose to analyse the factors: landslide volume, landslide duration (to evince the velocity parameter) and liquid discharge of the intercepted river. From the series of simulation done using CAESAR, a significant events sample has been extracted. This sample has been processed in statistical mode to calculate the sensitivity of each parameter on the others; so the weight of each single parameter in landslide dam phenomena has been evaluated. This specific paper aims to dispose a method useful to establish the probability of occurrence of landslide phenomena which can produce a natural dam accurately examining all the parameters involved in this process; this way is opposite to the great part of the methods now present which aim to predict the probability of occurrence of dam break (evaluating its stability). So it’s clear that this method works at a prediction level different from the others. Italian Journal of Engineering Geology and Environment, Special Issue 1 (2011) © Casa Editrice Università La Sapienza www.ijege.uniroma1.it 61 ANALISI DI SENSITIVITÀ SUI PRINCIPALI FATTORI CHE INFLUENZANO IL FENOMENO DI OCCLUSIONE D’ALVEO PER FRANA sede può essere utile ad un livello previsionale precedente, poiché riguarda la pericolosità in sé del fenomeno di sbarramento (cioè la probabilità di accadimento del fenomeno stesso), tramite l’accurato esame dei parametri che caratterizzano i movimenti franosi, in rapporto ai sistemi fluviali con cui essi interagiscono. 62 TERMINI CHIAVE: occlusioni d’alveo per frana, analisi di sensitività, modelli ad automazione cellulare KEY WORDS: landslide dams, sensitivity analysis, cellular automata models INTRODUZIONE E FINALITÀ DELL’ANALISI INTRODUCTION AND AIMS Il fenomeno degli sbarramenti d’alveo per frana è assai complesso, in quanto sono numerosi i fattori fisico-geografici coinvolti. Per questo motivo, ad oggi, non esistono ancora modelli numerici in grado di affrontare la problematica in maniera quantitativa. L’attenzione verso tale tematica è cresciuta notevolmente nel tempo: diversi autori si sono interessati al problema, concentrandosi tuttavia, principalmente, sull’analisi di stabilità dello sbarramento e sull’evoluzione del fenomeno di rottura dello sbarramento stesso (COSTA & SCHUSTER, 1988; MANDRONE et alii, 2007). Diversamente, altri autori hanno rivolto l’attenzione, anche recentemente, alla previsione di tale evento (CASAGLI & ERMINI, 1999; CENCETTI et alii, 2001, 2002, 2006; BOSCHERINI et alii, 2009; MARCHESINI et alii, 2009). Per svolgere un’analisi quanto più possibile esatta dei parametri che influenzano la possibilità e la probabilità che si verifichino occlusioni d’alveo per frana, si è ricorsi all’utilizzo di un software di tipo Cellular Automata (CAESAR) che simula l’evoluzione morfologica degli alvei fluviali, implementando al suo interno un modello di trasporto dei sedimenti che è in grado di riprodurre le modificazioni morfologiche di un fiume sia a scala di bacino idrografico che a scala di tratto fluviale. Il software è stato approfonditamente studiato e opportunamente modificato (DE ROSA, 2008) proprio al fine di poter considerare gli apporti sedimentari in alveo provenienti dalle sponde o, più in generale, dai versanti, in modo da simulare il fenomeno di formazione delle landslide dams tramite l’utilizzo di un DEM (Digital Elevation Model). I risultati delle simulazioni sono quindi stati analizzati in GRASS GIS, un Sistema Informativo Geografico Open Source, al fine di ricavare con la maggior esattezza possibile i parametri geometrici dell’occlusione d’alveo, conseguente all’immissione di materiale dalle sponde. In particolare, sono state identificate e valutate separatamente le modifiche morfologiche apportate al DEM di partenza sia dal naturale flusso dell’acqua (normali processi di erosione e sedimentazione della corrente), sia quelle date dalla presenza di una frana (erosione provocata da fenomeni di turbolenza della corrente dovuti alla presenza in alveo del corpo di frana stesso). I valori dei parametri geometrici ricavati dall’analisi GIS sono quindi stati utilizzati per la determinazione del valore di un “indice di occlusione d’alveo” che assume un valore univoco per ogni simulazione (CENCETTI et alii, 2001). The landslide dam phenomena is very complex, because there are a lot of physical-geographical factors involved in. Because of this, at now there are not numerical models able to quantify the phenomena. During the time, the attention to these themes is growing up, but the great part of authors are interested to test the stability of the dam created by the landslide or the evolution of dam break (COSTA & SCHUSTER, 1988; MANDRONE et alii, 2007). Other authors are studying the forecasting of the phenomena (CASAGLI & ERMINI, 1999; CENCETTI et alii, 2001, 2002, 2006; BOSCHERINI et alii, 2009; MARCHESINI et alii, 2009). To obtain an exact quantitative analysis of the parameters involved in the probability of occurrence of the landslide dam, in this paper a cellular automata model (CAESAR) has been used which simulates the evolution of river morphology reproducing the sediment transport and sediment supply conditions at reach and basin scale. This software has been recently modified to consider the effects of sediment supply by the slopes (DE ROSA, 2008); so it’s possible easily to simulate the formation of landslide dams starting from elevation data (Digital Elevation Models). The results of these simulations has been analysed in GRASS GIS, a powerful Open Source Geographical Informative System, to measure geometrically the occlusion degree of the river. In particular has been evaluated separately the morphological modifications due to sediment supply coming from the normal transport conditions of the river, and coming from the landslide (which produces an increasing of the turbulence and erosional power at the boundary of the landslide body). Geometrical values of the parameters which describe the landslide dam configuration have been used to evaluate an adimensional index which describes the interaction landslide-river and assumes a specific value for each simulation (CENCETTI et alii, 2001). C. CENCETTI, P. DE ROSA & A. MINELLI A SENSITIVITY ANALYSIS ON MAIN FACTORS INVOLVED IN THE LANDSLIDE DAM PHENOMENA DATI DI PARTENZA Dal momento che l’analisi è volta alla determinazione in via puramente teorica del peso dei singoli parametri nell’occlusione d’alveo per frana, il DEM di partenza e le relative frane considerate sono da collocarsi all’interno di un modello teorico che riproduce condizioni morfologiche semplificate, quindi non necessariamente rappresentative di un caso realmente esistente. Il DEM, appositamente creato, si estende per un tratto fluviale della lunghezza di circa 600 m; la fascia di pertinenza fluviale esaminata ha dimensioni di 500 m e l’alveo è rettilineo, simmetrico e di larghezza pari a 30 m, con golene di ampiezza di circa 50 m e sponde con pendenza pari a 30°. La pendenza del DEM lungo l’asse dell’alveo è pari al 2% e i valori geometrici scelti sono stati selezionati al fine di rientrare in un modello fluviale monocanale a bassa sinuosità (alveo tipo A, secondo la classificazione di Rosgen - ROSGEN, 1985, 1994). Per il materiale costituente il trasporto solido nell’alveo, è stato scelto un terreno prevalentemente ghiaioso-ciottoloso, con distribuzione granulometrica (Fig. 1) liberamente tratta dalle ipotesi di lavoro di WONG & PARKER (2006). L’entità del trasporto solido della corrente è stata calcolata tramite la formulazione di Meyer-Peter e Muller, modificata da WONG & PARKER (2006), a partire dai dati di portata liquida scelti per la simulazione e dalle caratteristiche geometriche del DEM. LE SIMULAZIONI - FASE PROGETTUALE Si è scelto di mantenere costante la composizione granulometrica del letto e del materiale trasportato. In relazione al software utilizzato e agli obiettivi della ricerca, i parametri che invece sono stati variati per l’analisi di sensitività sono tre: la portata liquida, il volume di frana e la durata della frana (quindi, indirettamente, la sua velocità). In particolare non è stato possibile considerare direttamente come variabile la velocità del movimento franoso, poiché il software usato per la simulazione (CAESAR) non permette di inserire in input tale parametro; quindi, è stato possibile svolgere solo a posteriori uno studio sulla velocità del movimento, ricavata a partire dalla durata del movimento e dalla lunghezza media del percorso effettuato dal corpo di frana. Per ciascun parametro sono stati scelti tre valori di testing significativi (Tab. 1) in maniera tale da poter esaminare approfonditamente sia il funzionamento del modello matematico, sia la risposta del modello stesso ai dati in input. Per quanto riguarda la portata liquida (Q), si è innanzi tutto calcolata la portata di bankfull a partire dalle caratteristiche geometriche dell’alveo; quindi, i valori scelti per le simulazioni, oltre al valore stesso della portata di bankfull, sono pari rispettivamente al 50% e al 10% della portata di bankfull. Per quanto riguarda il volume della frana simulata (V), sono stati scelti valori abbastanza diversi, in maniera tale da coprire un range Italian Journal of Engineering Geology and Environment, Special Issue 1 (2011) Fig. 1 - Curva granulometrica del materiale utilizzato per le simulazioni - Grain size distribution of the material considered in the simulations DATA PREPARATION Because the analysis is aimed to theoretically find the weight of each single parameter in landslide dam phenomena, all input data (e.g. Digital Elevation Model and landslides) have theoretical shapes but realistic geometry to reproduce simple morphological conditions. So the DEM created has the following geometry: length of 600 mt; width of 500 mt; the axis of the river is straight, the river has width of 30 mt and the floodplain has width of 50 mt; the banks have slope of 30 degrees. The slope in longitudinal direction (along the river axis) is of 2% and all the geometrical values are chosen to artificially reproduce a stream of type A (monocanal, low sinuosity) according to Rosgen classification (ROSGEN, 1985, 1994). The size of sediments transported in the river is gravelous (Fig. 1) and it has been chosen following the working hypothesis of WONG & PARKER (2006). The entity of sediment transport has been calculated using the Meyer-Peter& Mueller formula modified by WONG & PARKER (2006), and it has been evaluated starting from the values chosen for the liquid discharge and the geometry of the river. THE SIMULATIONS - DESIGN The working hypothesis are that bed and transport are composed by the same grainsize sediments and the grainsize distribution of the bed and transported material does not vary during the experiment. The examined parameters for the analysis are: liquid discharge, landslide volume and duration of the landslide movement (and, indirectly, velocity of the movement). In particular it was not possible to consider directly the velocity of the movement because CAESAR model takes into account only the duration of the movement but not its velocity, so the analysis on velocity has been conduced on the results of the simulation and elabo- © Casa Editrice Università La Sapienza www.ijege.uniroma1.it 63 ANALISI DI SENSITIVITÀ SUI PRINCIPALI FATTORI CHE INFLUENZANO IL FENOMENO DI OCCLUSIONE D’ALVEO PER FRANA Tab. 1 - I valori di testing scelti per i parametri esaminati - Testing values chosen for the analysed parameters considerato rappresentativo in base alla casistica delle frane in alveo naturalmente verificatesi. I valori scelti hanno quindi ordini di grandezza diversi. Per quanto riguarda la durata della frana (t), si è preferito studiare fenomeni relativamente veloci, in quanto la casistica indagata induce ad attribuire alla velocità del movimento franoso un ruolo importante nel determinare le occlusioni d’alveo. Inizialmente sono state eseguite 27 simulazioni per l’analisi di sensitività, in ognuna delle quali è stato fatto variare un solo parametro alla volta. Solo in seguito, in fase di analisi dell’output delle simulazioni, si è reso necessario effettuare ulteriori 9 simulazioni in condizioni di assenza di frana. I motivi di tale ulteriore analisi saranno successivamente spiegati (cfr. par. “Analisi dei dati”). LE SIMULAZIONI - FASE ESECUTIVA Ad una prima fase di progettazione dell’esperimento è seguita la fase esecutiva, durante la quale sono state materialmente svolte le simulazioni. In questa fase si è avuto modo di esplorare tutte le funzionalità del software CAESAR e di configurare appropriatamente alcuni parametri per rendere le simulazioni quanto più possibile veloci ed efficienti. Ad esempio, il parametro max erode limit nella cartella numerical ha il compito di stabilire fino a quale profondità il substrato può essere eroso dalla corrente (in pratica definisce lo spessore del materiale asportabile ed è stato posto ragionevolmente pari a 0.2 m). è comprensibile che questo parametro è soggetto ai vincoli imposti dalla definizione di un altro parametro, quello che indica lo spessore del layer attivo. Di default è obbligatorio considerare un valore dello spessore del layer attivo almeno 4 volte maggiore del max erode limit; si è quindi stabilito di porre lo spessore del layer attivo a 0.8 m per gli esperimenti in questione. Per quanto riguarda la portata liquida, si è scelto di utilizzare un idrogramma di tipo rettangolare (Fig. 2), a portata costante, in maniera tale da rendere le condizioni sperimentali al contorno molto semplici; per quanto riguarda infine i volumi di frana immessi, questi sono stati inseriti in quattro punti distinti e adiacenti, posti sulla sommità della sponda in sinistra idrografica, localizzati all’incirca a metà del tratto considerato. In definitiva sono state eseguite 36 simulazioni di analisi, più altre di calibrazione del modello e dei parametri sopra descritti. Il modello produce di default 5 files di testo in output: 1. il DEM a fine simulazione (elev); 64 Fig. 2 - Diagramma rettangolare delle portate utilizzate nella simulazione - The hydrograph used for the simulations ration. The mean velocity of the landslide has been considered. For each parameter three significant test values has been chosen (Tab. 1) so that it is possible to examinate the routing and the response of the mathematical model to a specific input. For the liquid discharge (Q), the bankfull discharge has been calculated (starting from the DEM geometry); so the values considered are the same bankfull, 50% and 10% of the bankfull discharge. For the landslide volume (V), some different values have been chosen so that the experiment could be defined valid for all the possible natural phenomena. Because of this, the chosen values are very different themselves. For the landslide duration (t), let’s choose to study rapid phenomena, because the velocity of the movement plays an important role in the formation of landslide dams. So the total number of simulations is 27 and in each one the variability of only one parameter is studied (the others two parameters have constant values). Only in the analysis phase it was necessary to execute other 9 simulations “without landslide”. Some more details are reported in the paragraph “Data Analysis”. THE SIMULATION - EXECUTION The second step of the experiment is the execution of the simulation in CAESAR. In this phase it has been necessary to appropriately configure all CAESAR’s variables to obtain maximum speed and performance from the software. For example, the parameter “max erode limit” establishes a lower limit for vertical erosion and it is influenced by determining another parameter: the active layer thickness (which must be 4 times greater than the max erode limit); so it has been chosen the values 0.2 mt for the max erode limit and 0.8 mt for the active layer thickness. For the liquid discharge, let’s choose to use a rectangular hydrograph (Fig. 2), with a constant value for the discharge so that the boundary conditions of the experiment are very simple. For the landslide volume, in CAESAR is possible to insert the sediment in more than one specific pixel. In this case 4 neighbour C. CENCETTI, P. DE ROSA & A. MINELLI A SENSITIVITY ANALYSIS ON MAIN FACTORS INVOLVED IN THE LANDSLIDE DAM PHENOMENA 2. un DEM che è il risultato della differenza tra quello di partenza e quello finale (elevdiff); 3. la mappa raster del tirante idrico a fine simulazione (watedepht); 4. la mappa raster delle dimensioni granulometriche medie dello strato superficiale (d50top); 5. la composizione granulometrica del terreno su 9 strati in profondità rispetto alla superficie (solo per le celle su cui sono intervenute modifiche): “grain”. Segue il planning delle simulazioni: points (pixels) are chosen, placed on top of the left bank, close to the middle of the studied reach. The number of the simulations used for the analysis is 36 and others have been executed for calibration of the model and the parameters just described. The output of each simulation is composed by 5 text files: 1. the DEM at the end of the simulation (elev); 2. the DEM difference from the initial and final configuration (elevdiff); 3. the raster map of water level at the end of the simulation (waterdepth); 4. the raster map of the mean grainsize of surface sediments (d50top); 5. the grainsize composition of the terrain with depth on 9 different strata, only for that cells where modifications have occurred (grain). The planning of the simulations is in the following table: Le simulazioni evidenziate in grassetto sono quelle in assenza di frana The bold simulation are executed “without landslide” TRATTAMENTO DEI DATI TREATMENT OF DATA I dati sono stati trattati mediante il software open source GRASS GIS, procedendo per steps successivi e basandosi sul sostanziale utilizzo del solo output relativo al DEM in uscita dalla simulazione (elev). Il parametro che si vuole ottenere da ogni simulazione è G, definito (CENCETTI et alii, 2001) dalla seguente: dove, con riferimento alla figura 3: The data were treated with the open source software GRASS GIS proceeding by steps and taking for input the only DEM at the end of the simulation (elev map). The index parameter used to geometrically describe the degree of influence of the landslide into the river is G, defined (CENCETTI et alii, 2001) as it follows: G = L - Di lW L è la misura della lunghezza della porzione del corpo di frana che interseca geometricamente la pianura fluviale; Di è la larghezza delle golene a fine simulazione; Italian Journal of Engineering Geology and Environment, Special Issue 1 (2011) where, referring to figure 3, the parameters involved represent: L, the length (along the main expansion direction) of the landslide body which intersects the floodplain; © Casa Editrice Università La Sapienza www.ijege.uniroma1.it 65 ANALISI DI SENSITIVITÀ SUI PRINCIPALI FATTORI CHE INFLUENZANO IL FENOMENO DI OCCLUSIONE D’ALVEO PER FRANA Fig. 3 - Identificazione dei parametri che concorrono alla definizione del parametro G (da CENCETTI et alii, 2001) - Description of the parameter involved in G calculation (from CENCETTI et alii, 2001) Di, the width of the floodplain at the end of the simulation; W è la larghezza del canale di magra a fine simulazione; G è il parametro che si è scelto per quantificare l’occlusione d’alveo per W, the width of the channel at the end of the simulation; frana e descrive situazioni diverse a seconda del valore risultante: G, the index that describes different situations for different values it 1. se G ≤ 0 la frana non interagisce con l’alveo; assumes, in particular: 2. se 0 < G < 1 si ha lo sbarramento parziale dell’alveo; 1. if G ≤ 0 the landslide does not intersect the river; 3. se G ≥ 1 si ha lo sbarramento totale dell’alveo (formazione 2. if 0 < G < 1 the landslide intersects partially the river; di una landslide dam). 3. if G ≥ 1 the landslide intersects totally the river (dam forNel calcolo del parametro G si è quindi proceduto per steps sucmation). cessivi: The following steps are so finalized to G calculation: 1. importazione in GRASS della mappa elev in output da ogni si1. importation in GRASS of the elev map, in output from CAESAR mulazione e calcolo della mappa differenza con la mappa uscente and calculation of the difference map between this one and the dalla simulazione con stessi valori di Q e t ma in assenza di frana. other one with the same values of Q and t but “without landslide” Infatti: using a map algebra procedure: r.mapcalc “differenza_sim1 = sim1_elev - sim28_elev” Il calcolo è stato svolto tramite operazioni di map algebra ed è This specific calculation is aimed to isolate the only surface of finalizzato all’isolamento della sola superficie ricoperta dal corpo the map (DEM) covered by the landslide. Because in the simuladi frana. Dal momento che nella simulazione intercorrono almeno tion at least two processes occur simultaneously (sedimentation 2 processi di sedimentazione dovuti ad agenti diversi (la sedimendue to the solid transport and due to the landslide), it was not tazione del materiale trasportato dalla corrente fluviale e la messa possible to use the elevdiff simulation output because this conin posto del corpo di frana), al fine di isolare l’area occupata dal siders like one the effects of these two distinct processes. This is solo corpo di frana non si è potuto utilizzare direttamente l’output important to better understand the real influence of the landslide della simulazione elevdiff (dal momento che esso considera conin the observed morphological modification. So it was necessary giuntamente gli effetti di entrambi i fattori di sedimentazione); è to execute the simulation cycle “without landslide”; per questo che, in questa fase, si è optato per eseguire il ciclo di simulazioni in assenza di frana; 2. dal momento che possono comunque verificarsi differenze, ben2. to consider the effects of the landslide on the erosion/sedimentaché minime, tra i risultati delle simulazioni con e senza frana tion processes and better isolate the real surface occupied by the (poiché la presenza della frana influenza comunque i processi di landslide, a correction value (in meters) has been applied to the sedimentazione/erosione che avvengono naturalmente nel corso sedimentation values for different volume values. So, if the land’acqua), per “isolare” la superficie occupata dalla frana in maniedslide intersects the river, it is possible to distinguish its boundary ra più precisa, si è deciso di applicare una correzione per difetto clearly because the sedimentation near the landslide body is conai valori di sedimentazione calcolati (tolleranza diversa a seconda sidered. Tolerance values are: dei volumi di frana esaminati). In questo modo, qualora in alveo a. for V = 20000 m3 of the landslide → tolerance = 5 m sia presente la frana, è possibile distinguerne i contorni in maniera b. for V = 150000 m3 of the landslide → tolerance = 10 m più netta, poiché si tiene conto degli effetti di sedimentazione nei c. for V = 500000 m3 of the landslide → tolerance = 15 m pressi dell’accumulo di frana. La tolleranza utilizzata vale: Also in this case, operations of map algebra have been used to 66 C. CENCETTI, P. DE ROSA & A. MINELLI A SENSITIVITY ANALYSIS ON MAIN FACTORS INVOLVED IN THE LANDSLIDE DAM PHENOMENA obtain the mapset “lanslide”: a. per frana con V = 20.000 m3 → tolleranza = 5 m b. per frana con V = 150.000 m3 → tolleranza = 10 m c. per frana con V = 500.000 m3 → tolleranza = 15 m ed è stata applicata sempre tramite operazioni di map algebra, ottenendo il set di mappe “frana”: r.mapcalc “frana_sim1 = if(differenza_sim1>15;differenza_sim1;null())” 3. for each landslide so defined, knowing that the flow direction is 3. per ogni frana così definita, conoscendo la direzione della correnW-E (default in CAESAR is west to east, so the DEM is appote (che è da Ovest verso Est di default, in CAESAR) e ipotizzando sitely created), and the major axis of the landslide is N-S, it is che il movimento franoso si propaghi da Nord verso Sud, si legge possible to measure the L parameter reading the south limit of the il limite sud della mappa e, conoscendo la collocazione del limite map and making the difference between it and the north limit of superiore della golena, si calcola per ogni frana il parametro L; the floodplain (input data); 4. dal momento che nel calcolo di G si vuole tener conto delle na4. to accurately determining G and accounting the natural modifiturali modifiche apportate alla morfologia fluviale dal flusso idrications due to the river transport/erosion/sedimentation effects, co, al fine di estrarre valori quanto più possibile esatti per quanto in determining W and Di the output of the simulations “without riguarda la geometria dell’alveo, per la valutazione dei parametri W e Di sono stati utilizzati gli output delle simulazioni in assenza landslide” has been used. To evaluate these parameters it has been recognised that floodplain area has slope near zero, so, defining di frana. In particolare, posizionandosi su una regione definita “di a square region (200x200 m) centred on the landslide, the W and interesse” centrata sulla frana stessa (zona quadrata di dimensioni Di parameters have been calculated as it follows: 200 x 200m) si è proceduto a isolare l’alveo dalle zone golenali osservando che queste ultime hanno pendenza praticamente nulla: r.slope.aspect sim28_elev slope=sim28_slope r.mapcalc “magra_sim1 = if(sim28_slope>10;1;null())” 5. dalla misurazione del limite Nord della mappa denominata “magra” e conoscendo la collocazione del limite superiore della golena, si calcola W e si ricava per differenza Di; 6. noti L, W e Di per ogni simulazione si calcola infine il parametro G; 7. i risultati delle elaborazioni sono stati riportati in un foglio di calcolo e diagrammati in funzione rispettivamente di ciascuno dei parametri considerati (portata liquida, volume di frana, durata temporale del movimento franoso). 5. measuring the north limit of the output map (“channel_sim1”) and knowing the north limit of the floodplain, it is possible to calculate W; Di is consequently evaluated; 6. now the value of G parameter for the examined simulation is determined; 7. all the results have been registered in a spreadsheet and, for each parameter considered (liquid discharge, volume of the landslide, total duration of the landslide movement), some graphics have been realized to evaluate the variation of the same parameter varying the others two. ANALISI DEI RISULTATI E CONCLUSIONI RESULTS AND CONCLUSIONS Le tabelle contenenti i risultati ottenuti, con i relativi grafici, riportano i valori di G per coppie di parametri: tutti i parametri sono stati tenuti di volta in volta costanti, mentre sono stati fatti variare i restanti due parametri, fino a produrre un set di 3 tabelle e 6 grafici per ogni caso (in totale sono state ottenute 9 tabelle e 18 grafici). Un esempio di output è riportato in Fig. 4. Nella tabella in Fig. 4, in particolare, sono evidenziati in colore più chiaro la situazioni in cui la frana non interferisce con l’alveo (valori nulli o negativi di G); sempre in figura 4, nel grafico a destra si può osservare come, per il volume di frana minore, G aumenti all’aumentare del tempo. In particolare questo si verifica a causa dell’effetto erosivo dell’acqua sul corpo di frana stesso sull’alveo, effetto che si accentua all’aumentare del tempo. In tutte le simulazioni non si è mai raggiunta un’occlusione completa dell’alveo secondo il parametro G, anche se dalle evidenze spe- The tables obtained by the analysis, report the values of G for a couple of parameters: all parameters was supposed to be linearly independent and, in each simulation, one parameter at time was constant. So for each parameter the results are grouped in 3 tables and 6 graphics and totally let’s obtain 9 table and 18 graphics. An output example is showed in Fig. 4. The table in Fig. 4, evidences (in fair) the particular situation where the landslide does not intersect the river (null or negative values of G). In the right graphic let’s note that the lesser is V, the greater becomes G in time. This happens because of the erosional effect of the flow on the landslide body. This effect increases in time. Examining the G parameter values, the complete occlusion of the river flow was never reached but, during the CAESAR simulation (by screen observation), the flow was just interrupted for G assuming values around 0.8. Italian Journal of Engineering Geology and Environment, Special Issue 1 (2011) © Casa Editrice Università La Sapienza www.ijege.uniroma1.it 67 ANALISI DI SENSITIVITÀ SUI PRINCIPALI FATTORI CHE INFLUENZANO IL FENOMENO DI OCCLUSIONE D’ALVEO PER FRANA Fig. 4 - Esempio di grafici ottenibili dai valori di G calcolati, per Q costante e pari a 1500 m3/s - Example of graphics and table output: G is calculated for Q=1500 m3/s Fig. 5 - G al variare di Q e t, per V costante e pari a 150000 m3 - G values for V constant (150000 m3) and varying Q and t rimentali (osservando a schermo la simulazione) il deflusso risultava già ostacolato per G = 0.833. Da queste elaborazioni si può osservare che maggiore è la pendenza della spezzata descritta, maggiore sarà la correlazione tra il parametro di volta in volta considerato e il parametro G. In particolare, analizzando la pendenza delle rette di tendenza, si nota che, nel caso di V costante, non si può individuare una vera e propria “tendenza” dei dati e le pendenze delle rette interpolanti sono molto basse (Fig. 5); invece, nei casi di t e Q costanti, al variare di V le pendenze risultano elevate (Fig. 6). In secondo luogo, è stata calcolata la differenza di pendenza tra le tre rette in ogni grafico, tenendo presente che, come già detto, maggiore è la variabilità della pendenza, maggiore è l’influenza su G del parametro riportato in ascissa. Si è trovata la massima differenza tra le tendenze per il valore di V = 20.000 m3 (Fig. 7); ciò significa che i parametri Q e t influenzano l’occlusione d’alveo solo per valori di V bassi. Infine è stata svolta la medesima analisi sulla pendenza delle rette di tendenza tramite il parametro di sintesi v (velocità media del corpo di frana), ricavato considerando il rapporto tra la massima distanza percorsa (L) nel tempo di esaurimento della frana stessa (t). 68 From these results it is possible to observe that greater the slope of the lines is, the greater could be the correlation between the considered parameter and G index. In particular, analysing the slope of the trend line, it is possible to evince that for V constant there’s not a real trend of data and the slope of the interpolating lines is very low (Fig. 5); instead if t and Q are constant the slope of the lines is high for different values of V (Fig. 6). Secondarily, the difference between calculated slopes of each line in each graphic has been considered. In fact the greater is the slope variability of these lines, the greater is the influence of x axis parameter on the G value. The maximum difference registered in slopes is for V=20000 m3 value (Fig. 7); this means that Q and t parameters play a significant role in the river occlusion only if V is low. At last the same analysis on the slopes of the trend lines has been executed for the synthesis parameter v (mean velocity of the landslide movement). The v parameter has been calculated as the ratio between L parameter (maximum distance of the landslide from the floodplain) and t (total movement duration). C. CENCETTI, P. DE ROSA & A. MINELLI A SENSITIVITY ANALYSIS ON MAIN FACTORS INVOLVED IN THE LANDSLIDE DAM PHENOMENA Fig. 6 - G al variare di V e t, per Q costanti (da sx: 1500, 750 e 150 m3/s) e G al variare di V e Q, per t costanti (da sx: 12, 6 e 3h) - G values for Q constant (upper left: 1500, 750 and 150 m3/s) and varying V and t; G values for t constant (lower left: 12, 6 and 3 h) and varying V and Q Fig. 7 - G al variare di V, massima variazione di pendenza ottenuta per V = 20.000 m3, t = 12h - G for different values of V; note the maximum variation of the slope for V = 20000 m3, t = 12h In particolare, analizzando contemporaneamente i dati di tutti e 27 gli eventi simulati ed evidenziando una retta di interpolazione, ove possibile, dei punti raggruppati per volume, si ottiene il grafico in Fig. 8. In definitiva, negli esperimenti che hanno coinvolto ora i parametri V, Q e t, ora il parametro di sintesi v, si sono osservate alcune evidenze sperimentali, di seguito discusse: 1. Tra i tre parametri considerati nel primo ciclo di analisi (Q, t e V), l’influenza maggiore (ottenuta al variare di Q per V = 20.000 m3) nel raggiungimento dell’occlusione d’alveo per frana è esercitata dal volume del materiale immesso. Ovvero, per volumi di frana elevati tutti gli altri parametri considerati tendono a diventare Italian Journal of Engineering Geology and Environment, Special Issue 1 (2011) The graphic in Fig. 8 is obtained by examining all the results of the simulated events and tracking the interpolation line of the points grouped by volume (where it was possible). In conclusion, the whole analysis suggests some experimental evidences: 1. For the first cycle of experiments the parameter who plays a significant role in the landslide dam formation is V; in fact, the major slope value of the trend line is obtained for constant value of V = 20.000 m3. This means that for great values of V the other parameters (Q and t) becomes insignificant in the river occlusion process. © Casa Editrice Università La Sapienza www.ijege.uniroma1.it 69 ANALISI DI SENSITIVITÀ SUI PRINCIPALI FATTORI CHE INFLUENZANO IL FENOMENO DI OCCLUSIONE D’ALVEO PER FRANA Fig. 8 - G al variare di v, raggruppati per i diversi valori assunti da V - G for different values of v, grouped by V ininfluenti nel processo di occlusione; 2. Solo se il volume di materiale immesso è basso anche gli altri parametri (la durata della frana e la portata liquida) iniziano ad assumere una loro rilevanza; 3. Dall’analisi delle velocità, nel range delle velocità risultanti dalle simulazioni (vmin = 4.58 m/h, vmax = 29.33 m/h), si può dedurre che esiste una chiara relazione tra G e la velocità del movimento franoso (v) solo per volumi di frana (V) grandi; in questo caso G aumenta all’aumentare di v; quando il volume di frana V è piccolo non è possibile tracciare una retta di tendenza poiché dalle simulazioni si ottengono sempre valori piccoli di L (la frana “entra poco” in alveo) mentre la variabile tempo (t) assume gli stessi valori considerati nelle altre due simulazioni;di conseguenza si ottengono valori minimi per la velocità; 4. Inoltre, osservando che le rette di interpolazione delle simulazioni per volumi più grandi hanno pendenza simile (Fig. 7), si può concludere che il valore assunto da V influenza poco la relazione esistente tra G e v. Infatti, per volumi elevati, più aumenta V, minore è lo scarto quadratico medio della retta di regressione, mentre la relazione non è così chiara per volumi più piccoli. È da precisare comunque che è stato possibile svolgere un numero limitato di simulazioni, poiché la simulazione in CAESAR risulta piuttosto onerosa in termini di tempo e risorse; inoltre le osservazioni effettuate, sebbene le interpretazioni fornite lascino in alcuni casi poco adito a dubbi, dipendono in grande misura dai valori scelti dei parametri esaminati. È quindi auspicabile, a breve termine, l’approfondimento dello studio qui condotto, ad esempio mediante la scelta di un numero maggiore di valori per ogni parametro investigato. Inoltre, un numero più consistente di simulazioni consentirebbe un’analisi statistica robusta dei dati ricavabili, in maniera tale da poter condurre uno studio sulla reale efficacia e attendibilità del metodo messo a punto tramite il modello proposto. 70 2. Only if V is low the two parameters Q and t plays a role in the occlusion phenomena. 3. For the second cycle of analysis (velocity based), in the range obtained for the values of v (vmin = 4.58 m/h, vmax = 29.33 m/h) it is possible to evidence a clear trend through G and v values if V is big; in this case, as it is expected, the greater is v the greater is G. For lower values of V is not possible to say anything about the influence of v on G because the low value of the landslide volume implies low values of L parameter so the velocity (for the same values of time t) is lesser than ever. 4. Examining the same graphic in figure 7 and the relation between G and v values for big volume values, note that the slope of the trend lines is similar. So it can be said that, over a certain limit of V, the volume does not influence the relation between v and G. At the end is necessary to consider that, in this first analyses, it was possible to execute only a limited number of simulations because each simulation in CAESAR is quite heavy for time and hardware resources; moreover all the results obtained depend strongly from the values chosen for the parameters considered into the analyses. So it could be appropriate to enlarge the test identifying new ranges of values to investigate for the same chosen parameters. A greater number of simulation could be appropriate to make strong the statistical sensitivity analysis, so that the model becomes more trustworthy. Although all this, the present work even if gives only preliminary results, is quite new because it works at prediction level (hazard) in the landslide dam phenomena accurately examining the more important parameters of both interacting systems: landslide and river. C. CENCETTI, P. DE ROSA & A. MINELLI A SENSITIVITY ANALYSIS ON MAIN FACTORS INVOLVED IN THE LANDSLIDE DAM PHENOMENA Si sottolinea come il lavoro svolto in questa sede, seppure con risultati che, per quanto detto, devono essere considerati come preliminari, rappresenta un approccio che potrebbe fornire un contributo alla previsione del fenomeno delle landslide dams, in quanto riguarda la pericolosità (intesa come probabilità di accadimento) di occlusioni d’alveo per frana, tramite un’accurata analisi dei parametri che caratterizzano i movimenti franosi stessi, in rapporto ai sistemi fluviali con cui interagiscono. OPERE CITATE / REFERENCES BOSCHERINI A., CENCETTI C., DE ROSA P., FELICIONI G., FREDDUZZI A. & MARCHESINI I. (2009) - Individuazione di situazioni caratterizzate da pericolosità di occlusione d’alveo per frana. Atti del 3° Congresso Nazionale AIGA (S. Giovanni Valdarno, 25-27 febbraio 2009): 90-91. CASAGLI N. & ERMINI L. (1999) - Geomorphic analysis of landslide dam of Northern Appenines. Transaction of the Japanese Geomorphological Union, 20 (3): 219-249. CENCETTI C., CONVERSINI P., MARCHESINI I., RIBALDI C. & TACCONI P. (2002) - Pericolosità dei fenomeni franosi che interferiscono con i sistemi alveo-pianura fluviale: un approccio probabilistico. Quaderni di Geologia Applicata - Serie AIGA (It. Journ. of Eng. Geol. and Env.), 1: 49-60. ISSN: 1593-8433. CENCETTI C., CONVERSINI P., RIBALDI C. & TACCONI P. (2001) - Studio dei sistemi alveo - pianura fluviale in relazione alle interazioni con fenomeni franosi di versante. Mem. Soc. Geol. It., 56: 249-263. ISSN: 0375-9857. CENCETTI C., FREDDUZZI A., MARCHESINI I. & SEGHETTA M. (2006) - Definizione di scenari e analisi delle condizioni di rischio geologico-idraulico derivanti da una possibile occlusione d’alveo per frana nel T. Reggia (bacino del F. Tevere, Umbria settentrionale). Giornale di Geologia Applicata, 3 (2005): 221-229. ISSN: 1826-1256. doi: http://dx.doi.org/10.1474/ GGA.2006-03.0-29.0122. COSTA J.E. & SCHUSTER R.L. (1988) - The formation and failure of natural dams. Geol. Soc. of Am. Bull., 100 (7): 1054-1068. DOI: 10.1130/0016-7606 (1988). COULTHARD T.J., HICKS D.M. & VAN DE WIEL M.J. (2007) - Cellular modelling of river catchment and reaches: Advantages, limitation and prospect. Geomorphology, 90: 192-207. DE ROSA P. (2008) - Un approccio modellistico per il fenomeno delle occlusioni d’alveo per frane: una modifica al modello CAESAR. Giornale di Geologia Applicata, 8 (2): 277-284. MANDRONE G., CLERICI A. & TELLINI C. (2007) - Evolution of a landslide creating a temporary lake: successful prediction. Quaternary International, 171-172: 72-79. ISSN 1040-6182. MARCHESINI I., CENCETTI C. & DE ROSA P. (2009) - A preliminary method for the evaluation of the landslides volume at a regional scale. GeoInformatica, 13 (3): 277-289 (Springer). doi: http://dx.doi.org/10.1007/s10707-008-0060-5. ISSN: 1384-6175 (Print) 1573-7624 (Online). ROSGEN D. (1985) - A Stream Classification System. USDA Forest Service General Technical Report, RM 120: 91-95. ROSGEN D. (1994) - A classification of natural rivers. Catena, 22: 169-199. SALTELLI A., RATTO M., ANDRES T., CAMPOLONGO F., CARIBONI J., GATELLI D., SAISANA M. & TARANTOLA S. (2008) - Global Sensitivity Analysis. The Primer. John Wiley & Sons. WONG M.& PARKER G. (2006) - Re-analysis and correction of bedload relation of Meyer-Peter and Muller using their own database. Journal of Hydraulic Engineering, 132 (11): 1159-1168. Received January 2010 - Accepted April 2010 Italian Journal of Engineering Geology and Environment, Special Issue 1 (2011) © Casa Editrice Università La Sapienza www.ijege.uniroma1.it 71
Scaricare