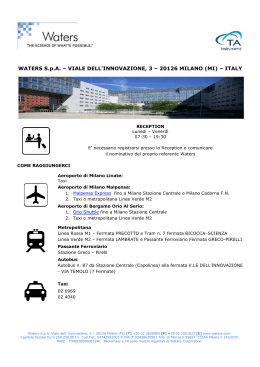
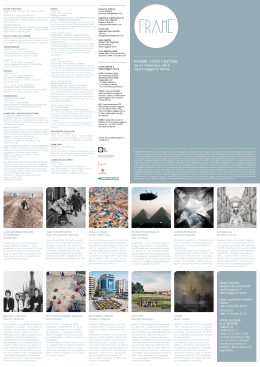
Lifelong Learning Programme WP.2 National Report Bottled water companies in Italy Partner P5 - CSEI Catania FINAL REPORT AQUASYN – Italian Report 1. 2. 3. 4. 5. 6. 7. 8. 9. INDEX Evolution of mineral water production and consumption ................................. 2 Quality profile of Italian mineral waters.......................................................... 6 Amount and territorial distribution of productive plants ................................... 7 Main production companies and brands ....................................................... 11 Mineral waters produced in Sicily: an in-depth analysis ................................. 14 Environmental sustainability of the production chain..................................... 15 Methods of survey on Italian BWCs.............................................................. 22 Results of survey on Italian BWCs ............................................................... 23 Conclusion ................................................................................................. 28 Figures and tables Figure 1. Number of water sources per Province ................................................ 5 Figure 2. Number of bottling companies per Province ......................................... 8 Figure 3. Number of water brands per Province.................................................. 9 Figure 4. Ratio of water brands/bottling companies per Province....................... 10 Table 1. Production and consumptions of mineral and bottled waters in Italy in the last 30 years .................................................................................................. 17 Table 2. Summary of the main characteristics of Italian bottled waters market... 18 Table 3. Distribution of mineral waters for pH classes....................................... 18 Table 4. Distribution of mineral waters for classes of Fixed Residue (F.R. in mg/l) at 180°C ........................................................................................................ 18 Table 5. Distribution of mineral waters for mineral salt content classes (specific Electrical Conductivity, EC, at 20°C in µS/cm) .................................................. 19 Table 6. Distribution of mineral water bottling plants and brands per Italian Provinces ....................................................................................................... 19 Table 7. Main companies producing bottled waters........................................... 21 Table 8. Mineral waters produced in Sicily........................................................ 21 Annex 1. Main qualitative characteristics of Italian mineral waters…………………… 21 1 AQUASYN – Italian Report 1. Evolution of mineral water production and consumption Natural mineral waters industry was born at the end of the nineteenth century in some European countries with a solid thermal tradition (Italy, France, Belgium, Germany), when waters from historical springs, famous for their healthy properties, started to be bottled. In Italy, first attempts of commercializing a natural mineral water occurred around 1890, and from then construction of first bottling plants started. Until the mid ‘60s, a strictly local natural mineral water market has developed, and it was anchored to a therapeutic connotation, representative of a specific niche of the more general non-alcoholic drink sector, and intended to well-off consumers. In the ‘70s, companies adopted policies oriented to a wider market sector, even under a geographical point of view; natural mineral water shouldn’t be considered anymore just a therapeutic good, but it should represent a real thirst-quenching beverage. Moreover, introduction of PET bottles has been of a fundamental importance, since the consumer appreciated them for being lighter and cheaper of the glass ones. These new consumption drives prompted the development of bottled natural mineral waters and the approval by an always wider public. Today, on a global scale, Italy is one of the first countries in production and consumption of natural mineral water. This is due both to a greater consumptionoriented tradition, and to a growing sensitivity to a healthier nutrition, for every age group and in every using occasion, even in the daily one. In the last thirthy years, both production and consumption of packaged waters (i.e., mineral, spring and treated waters) registered a permanent increasing (Tab. 1), with the only downward trends in the new millennium, specifically in 2004, 2009 and 2010. Per capita consumptions varied with the same trends and in 2011 were four times that registered in 1980. Going in deep into the most recent evolution of the Italian market of packaged waters (Tab. 2), it can be noticed how it closed positively in 2011, after two consecutive years of decreasing produced and consumed volumes, recovering 2 AQUASYN – Italian Report both on the production and on the consumption plane. Actually, in 2011 the Italian market of packaged waters expanded of 3% with respect to 2010, as regards iper, super and self service distribution channels. Sales through these channels has been estimated in over 6.2 billion litres at the end of 2011. In the same year, for the whole sector of modern distribution (included discounts), produced volume was estimated in about 7.9 billion litres, corresponding to a total value of about 1.7 billion euros, with a very low medium price to the public (just 0.21 euro/litre). Considering the whole sales channels (modern distribution, traditional retail, door to door, ho.re.ca., catering and vending), the overall estimate reaches 11.32 billion litres, equals to a consumption of 188 litres per capita, against 186 litres in 2010. Per capita volumes consumed in Italy are still at the top in European community, but distances with other countries are reducing. In particular, Germany has already overtaken Italy in total consumptions of packaged water (more than 13.5 billion litres overall consumed in 2011) and is already close to per capita Italian consumptions (170 litres/year). In 2011, total Italian production of mineral waters was computable in about 12.35 billion litres; Italian industry exported more than one billion litres, while imports were negligible. Recovery of consumptions in 2011 was clearly facilitated by a good climatic evolution, but price control (prices were on average the same of 2010) had a positive role, too. Despite the present-day difficulties that are reducing consumptions even in food and beverage markets, at the end of August 2012 the trend of mineral water sells is quite positive in the iper, super and small distribution channels, thanks to a positive climatic evolution in summer 2012, too. Bottled waters market confirms its anticyclical nature. Campaigns in favour of tap water, often turned into campaigns against mineral water, may have contributed in inserting some restraint elements, but the great majority of Italians remains attached to mineral waters, that are experienced as certified pure waters or even as “health waters”. Concerning mineral salt content, light mineral waters (low and minimally mineralized) represent about 72% of total consumptions; these waters have a 3 AQUASYN – Italian Report more generic destination, performing renewal and diuretic functions, without contraindications for any consumer group. Waters with a higher salt content (medium and high mineralized) represent about 28% of total consumptions: they are appreciated by consumers looking for a specific salt supplement function (calcium, magnesium, etc.). Concerning carbon dioxide content, still waters (commonly said natural waters) are leaders in consumptions, with 65% in quantity and 60% in value (sparkling waters are on average more expensive). Carbonated waters are preferred in catering field for their higher digestive capability, and their consumption especially increases in summer time, since they are particularly thirst-quenching. So, in the retail channel still waters represent 67% of the total volumes, while in ho.re.ca. channel sparkling waters exceed 40%. Within carbonated waters, the classic ones overtake the naturally effervescent waters. In Italy, bottled mineral waters consumption is widespread in all the regions, although some differences exist but they are softening in time. This rather homogeneous diffusion is even due to the numerous water springs located in all of the Italian regions (Fig. 1). Now North-West of Italy, that includes 27% of inhabitants, takes about 30% of the total national consumptions, with a per capita rate slightly higher than the Italian average. North-East is within the national average: against 19% of population included, it represents about 19% of the total national amount of bottled mineral waters consumed. Conversely, the area of central Italy and Sardinia, with 30% of inhabitants, takes 26% of consumptions. In the end, unexpectedly, South Italy, that includes 24% of national population, represents 25% of consumptions. In reference to commercialization in foreign countries, in 2011 Italian mineral waters export produced incomes of 323 billion euros, with a 3.1% increase compared to 2010. In terms of quantities, exports represented more than 1,042 million litres, with an increase equal to 3.2% in respect to the previous year. The unit (per litre) value was equal to 0.31 euros as in 2010, being widely higher than average sell prices on the Italian market (generallylower than 0.2 euros/litre). In terms of volume, export represent about 7.5% of the total volumes produced by 4 AQUASYN – Italian Report the Italian bottling industry of mineral waters; in terms of value, exports exceeded 14% of the total business in 2011. Since mineral waters import are completely negligible, net import/export balance equals to the total exports. Italy exports mineral waters in more than 90 countries all over the World. However, the 8 more important markets (USA, France, Germany, Switzerland, Canada, Australia, UK, Japan) take 80% of the total exported amount, both in value and in quantity. USA are the first market in value, while France is the first one for quantities. Italian mineral water industry is achieving a relevant position within high quality Italian catering abroad, by proposing Italian mineral water as a typical product of Italian gastronomy and of Mediterranean diet. 2. Quality profile of Italian mineral waters Important contributes to the success of Italian industry are: the intrinsic quality of Italian mineral waters and springs (many and distributed in all the regions), different origin hydrogeochemical facies, water differencies in terms of characteristics, properties, healthy effects (Annex 1). Original purity represents the main pillar for a mineral water that, just for this prerogative, maintains its qualitative characteristics, unlike other aquifers that slowly but relentlessly worsen their properties. Italian factories continuously invest on aquifer sustainable exploitation, for protecting and not disturbing underground waters. With regards to the main qualitative parameters of mineral waters, some observations about numeric and geographic distribution of Italian waters for pH, fixed residue (FR) and electrical conductivity (EC) classes have been made. In relation to hydrogen ion concentration (Tab. 3), about 70% of Italian mineral waters has a pH higher than 7, so tending to basic conditions, while a little bit more than 30% present nearer to acidity values, with pH lower than 7. As regards geographic distribution, waters of the first cited class are mainly concentrated in North-West and Center of Italy, while the other class is widely represented by mineral waters produced in the South and in Islands. Anyway, the majority of 6 AQUASYN – Italian Report national mineral waters (about 75%) show pH values rather close to neutral conditions, with the parameter between 6.5 and 8. In reference to mineral salt contained quantities (fixed residue at 180 °C – Table 4), Italian mineral waters are greatly represented in ‘low mineralized’ category, with 67.19% of the now bottled brands; 16.40% of packaged waters are ‘medium mineralized’, 12.5% are ‘minimally mineralized’, and 3.91% are ‘high mineralized’ waters. Territorial distribution of low mineralized, such as high mineralized, waters is rather homogeneous; minimally mineralized waters are mainly concentrated in the North-West area, while the medium mineralized ones are mainly located in central and southern Italy and in Islands. Finally, distribution of Italian mineral waters in electrical conductivity classes (Tab. 5) reflects, obviously, the one observed for fixed residue, with the majority of waters (60%) characterized by EC values between 100 and 700. Waters with a conductivity lower than 100 are mainly concentrated in North-West; that ones with EC higher than 700 are especially located in Center, South Italy and Islands. 3. Amount and territorial distribution of productive plants In Italy, 153 bottling plants are active, and they produce 264 mineral water brands. Table 6 shows these data on a provincial basis and with regional, national and territorial macroareas level aggregations. Figures 2 and 3 show territorial distribution of bottling plants and water brands, respectively. In general, each factory bottles from one to six mineral water brands, with a national average of about 1.73 brands per plant. Figure 4 shows the ratio between water brands and bottling plants in the Italian Provinces. Analyzing macroareas data, it can be observed how the highest ratio between brands and plants is concentrated in the North-Western part of Italy, while North-East, Centre, South and Islands stay below national mean. Effectively, just in North-West areas, against a lower number of plants than in Centre, South and Islands, a number of mineral water brands higher than in all the others national macroareas is imbottled. 7 5 6 1 4 7 11 6 5 4 13 3 12 10 2 1 3 2 1 1 9 5 2 2 1 3 2 FIGURE 3 1 1 3 2 2 1 1 4 4 5 6 17 2 6 6 2 1 1 4 1 1 6 1 6 2 2 2 2 9 3 1 2 10 4 6 4 1 2 3 LEGEND 3 1 Boundary of Region Boundary of Province 2 # of Water Brands per Province 1 - 2 Water Brands : 3 - 4 Water Brands 5 - 7 Water Brands 8 - 13 Water Brands 14 - 17 Water Brands 0 50 100 200 300 400 km 1,3 2 1 2 3,5 2 5 1,9 2 1 1 2,4 2 1 1 3 2,5 1 1 3 2,8 2 2 1 1,5 1 FIGURE 4 1 1 1,5 2 2 1 1 2 2 5 1,5 2,8 2 2 2 2 1 1 1 1 1,5 1 1 1 3 1 2 2 3 1 1 1 2,5 1,3 1,2 1,3 1 1 1 LEGEND 3 1 Boundary of Region 2 Boundary of Province Water Brands/Bottling Companies Ratio per Province : 1 - 2 Water Brands per Company 2 - 3 Water Brands per Company 3 - 4 Water Brands per Company 4 - 5 Water Brands per Company 0 50 100 200 300 400 km AQUASYN – Italian Report Percentages of production plants and bottled brands are, respectively, 24.18% and 28.79% in North-West, 17.65% and 17.04% in North-East, 29.41% and 28.03% in Centre, 28.76% and 26.14% in South and Islands. In terms of absolute values, Lombardia is the region with the highest number of industries (18) and produced brands (38); while, at a provincial scale, Perugia has the leadership, since in 7 production plants are bottled 17 mineral water brands, thus overtaking Bergamo (Lombardia) that in the same number of industries produces just 13 brands. 4. Main production companies and brands In Italy, packaged waters market is quite concentrated, with the first 4 producer groups (Sanpellegrino Nestlé Waters, San Benedetto, CoGeDi and Fonti di Vinadio) taking a little bit more than 52% of total national production, and the first 8 groups (in addition to the previous, Ferrarelle, Norda/Gaudianello, Spumador and Fonti del Vulture) that satisfy about 74% of total production (Tab. 7). Other 5 medium-large groups follow in the list, each one producing over 200 million litres per year: Lete, Pontevecchio, Sangemini, Togni and Sorgenti Emiliane. Between minor springs, some difficulties have been registered, with suspension of activities and consequent closure or transfer to new entrepreneurs. In terms of brands, Italian context is much more dispersive. No brands have a volume market share higher than 10%. Private labels of large retail organization represent about 8-9% on total retail quantities (7-8% in value), largely lower than the average share of private labels in food and beverage sector. Only a dozen of brands has achieved a complete territorial coverage in all of the Italian regions, with a volume share of 50% on the total market; the remaining part is divided between over 200 regional and local brands, some of them with a leadership in their native regions. ‘Sanpellegrino’ (Nestlé Waters Group) is the leader producing company in the national market, with a production share around 20%, and international brands such as S. Pellegrino and Panna, national brands like Levissima and Nestlé Vera, in addition to different regional brands. The group is working on enhancing the value 11 AQUASYN – Italian Report of its brands image. Nestlé Vera brand is positioned on a competitive price segment and has expanded in Sicily by activating a local spring (Nestlé Vera S. Rosalia); Levissima is positioned on a purity sector, with its image related to Alta Valtellina (where the spring is located) and an always stronger environmental connotation, particularly for the new “La Litro”, the first mineral water Italian bottle made by recycled polyethylene terephthalate (PET). Naturally, the group keeps turning its attention to the historical brands S. Pellegrino and Panna, specifically designed for quality catering area. In particular, brand S. Pellegrino is now a standard-bearer of high quality Italian food service, and it’s capable to achieve more sales abroad than in Italy. In 2011, the group created a new regional brand business unit, aiming to value its presence in areas where it already operates with regional appealing brands (S. Bernardo, Pejo, Recoaro). The Veneto ‘San Benedetto’ group is stable at the second place in Italian market, with its low mineralized San Benedetto (medium-high market sector) and Guizza (low-cost market sector) waters. In the last year, the company has revised and strengthened its proposal in the ho.re.ca. channel, launching San Benedetto “Prestige” line into glass 75 cl bottles. For a long time now, the group started “Primavera” water project, aiming to realize a net of mineral water springs located all along the Italian territory, for rediscovering and valuing local resources, traditions and natural heritage. Moreover, the group works with the historical brand “Acqua di Nepi”, a naturally effervescent water, traditionally distributed in Lazio and bordering regions. In the end, the group is involved in the enriched waters sector, too. In years, the group carries out an intense and constant research activity for the environment respect, even ratified by partnership with the Ministry of the Environment. In this range, the “Eco-Green” line has been developed: it is a new generation of bottles (0.5, 1, 1.5 or 2 litres) with a low environmental impact, since the CO2 emissions derived from its whole production cycle are balanced. The Piedmontese ‘Fonti di Vinadio’ company, provided with a really up-to-date plant, goes on in its ascent and is now at the third place in the national market, with over one million litres sold in 2011. In particular, in modern retail, Sant’Anna 12 AQUASYN – Italian Report water (“pure, light, mountain”) is market leader in quantities. Moreover, the company had success with the new “bio-bottle” (biodegradable bottles obtained from plants), whose sales are reaching 10 million bottles per month. This package should become the company’s strength to extend its presence even in other European markets, especially in the German one highly oriented to environmental values. Furthermore, successful advertising campaign let the brand staying on a price segment higher than the average market. The Roman company ‘CoGeDi International’ owns Uliveto (naturally effervescent, positioned in the specific digestion and health sector) and Rocchetta Naturale (low mineralized, positioned in the specific health and beauty sector) waters. Sparklingness and liveliness themes are satisfied by Brio Blu Leggermente Frizzante and Brio Blu Frizzantissima, in order to cover all the main market segments. The group is the advertising big spender of the Italian mineral water sector; for this reason its brands have the best positioning in all of the interested sectors. ‘Norda’ group (with springs in Lombardy, Veneto and Emilia Romagna) has increased its importance between national competitors after having acquired Monticchio Gaudianello springs in Basilicata, and now is in the fifth position for water produced volumes in Italy. Acquisition of Lucania springs let Norda improve its shares especially in Centre and South Italy. In the ho.re.ca. channel, in particular, the group has revised all its brands, proposing a wide selection of bottles with customized and qualified design, and should now stay at the second place in terms of national produced volumes. Furthermore, Norda has partnerships with some important retail chains that provides with private label waters. The Lombard group is even involved in enriched and dispenser water sectors. The sixth Italian producer is ‘Ferrarelle’ company. It has a well-articulated brand portfolio: Ferrarelle, historical leader of naturally effervescent waters, Natìa and Santagata, both produced in the Riardo plant of Campania, Boario e Vitasnella made in the Lombard Darfo Boario Terme industry. The group concentrated on relaunching its main brand (Ferrarelle), especially in the abroad markets; moreover, it is active in valuing other mineral water brands, such as Boario, 13 AQUASYN – Italian Report characterized by a healthy positioning, and Vitasnella, recently acquired after a period of under concession production and distribution. ‘Spumador’ group is at the seventh place in the Italian big producers of mineral waters rank, with about 500 million litres yearly produced. In addition to its own brands (S. Antonio, S. Andrea, San Carlo, etc.), the company even produces many private label waters for the large retail organization. At this time, the group is involved in relaunching Valverde brand, positioned in the premium area, through glass bottles with a prestigious and distinctive design. Moreover, it started a valorisation plan even for the historical brand S. Antonio, by restyling trademark and packages. Recently, this Lombard company has joined Refresco group, that is the European leader in private label production of non-alcoholic drinks sector, with about 5 billion litres produced and over 1.5 billions euros sale volume. To conclude this overview on the main Italian mineral water production groups, the company of Lucania ‘Fonti del Vulture’ is now at the eighth place. From 2006 it is controlled by Coca-Cola Hellenic and The Coca-Cola Company, and it was relaunched under both a productive and a marketing point of view, with a consequent doubling in volumes. The company bottles different mineral water brands, but the peak trademarks on which its activity is concentrated are Lilia (low mineralized) and Sveva (naturally effervescent). The firm has achieved important market shares especially in the ho.re.ca. sector, even thanks to the leading role of Coca-Cola drinks and synergies for common use of the numerous coolers placed in the dealers. 5. Mineral waters produced in Sicily: an in-depth analysis In Sicily there are 8 mineral water bottling plants (Tab. 8), distribuited between the provinces of Agrigento, Catania, Messina, Palermo and Ragusa. These industries produce 11 water brands. All of the plants produce one water brand each, except the ones in the provinces of Ragusa and Catania that bottle, respectively, two and three brands. Sicilian mineral waters own an almost neutral concentration of hydrogen ions, with pH values sometimes tending to acidity. 14 AQUASYN – Italian Report With respect to mineral salt quantities, the majority of Sicilian waters (7 brands, equal to more than 63%) can be classified as low mineralized, one water is minimally mineralized, while all the others are medium mineralized. Over 75% of bottled waters has an electrical conductivity in the average interval (between 100 and 700 µS/cm), as typical for the majority of national mineral waters. 6. Environmental sustainability of the production chain Mineral water industry has carried out many actions in favour of sustainability: water saving measures (both mineral water in prewash and bottling phases, and industrial water); reduction of plastic bottle weight (only PET); and the commitment to use recycled PET when producing new bottles. Another strong obligation is towards an environmentally-friendly transport. Environmental sustainability theme is one of the main advertisement arguments for some mineral water brands. Italian mineral water industries look for the most efficient technologies to decrease environmental impact and at the same time to maintain high production quality standards, starting from the bottle that is the main package used in this sector. In the last 15 years, mineral water consumption in PET bottles has considerably grown, until 70-75% of the whole production. This was caused by consumer demand, since he finds this container extremely practice and comfortable to be used. In many years, PET is the only utilized plastic, since it is safe, reliable, and it can assume transparency and shapes that meet consumer liking and needs. The majority of these packages regards big sizes for family usage (1.5 and 2 litres); 1.5 litre size represents more than two thirds of PET volumes, while 2 litre format is widespread in southern and insular regions. Consumptions of single-serve packages continue increasing, especially the half litre size that represents 6% in quantities, but double in value since the average price is about 0.50 euros per litre. Half litre bottles are widespread in outdoor consumptions, while walking, at office, on holiday, and in sport activities. Many producers have even developed the PET 15 AQUASYN – Italian Report litre size, often designed for food service segment alternatively to glass bottle, that however is still widely preferred in the ho.re.ca. channel. PET is a polymer that, beyond safety, resistance, transparency and manageability characteristics, is more advantageous in environment defence: it can be recycled and generate a plastic very similar to the original one. Even in Italy, as in the other European countries, some producers started bottling mineral waters in recycled PET bottles. In mineral water packages, even the shrink-wrap that covers bottle bundle is recyclable. Many factories are making an effort in reducing bottle weight, so using less plastic material, but keeping the needful characteristics of functionality and protection. Furthermore, some producers decided to substitute the external shrink-wrap with special connection strings, highly resistant, able to keep bottles together without using other materials. About the distribution phase, road transport contributes to environmental pollution, by increasing carbon dioxide released quantities. So, conscious of the problem, in the last years mineral water industry has highly intensified railway transport through investments by national brands. Now 15% of mineral waters are transported by railway, against a national average for generic goods equal to 6%. All of the above mentioned ones are concrete measures that can be further improved, even if environmental sustainability is a too much essential value to be responsibility of a single category, and many subjects have to follow together the same purpose. 16 AQUASYN – Italian Report Table 1. Production and consumptions of mineral and bottled waters in Italy in the last 30 years Per capita consumptions YEARS reference litre · 10-6 var. % litre · 10-6 var. % litre · 10-6 var. % litre index 1980 2,350 -n.d. n.d. 2,350 -47 100 1985 3,400 +44.6 n.d. n.d. 3,400 +44.6 65 138 1990 6,100 +79.4 n.d. n.d. 6,100 +79.4 110 234 1991 6,700 +9.8 n.d. n.d. 6,700 +9.8 118 251 1992 7,200 +7.5 n.d. n.d. 7,200 +7.5 126 268 1993 7,500 +4.2 n.d. n.d. 7,500 +4.2 131 279 1994 8,000 +6.7 -200 -7,800 +4.0 136 289 1995 8,150 +1.9 -270 +35.0 7,880 +1.0 138 294 1996 8,450 +3.7 -320 +18.5 8,130 +3.2 141 300 1997 8,800 +4.1 -380 +18.8 8,420 +3.6 146 311 1998 9,300 +5.7 -450 +18.4 8,850 +5.1 153 326 1999 9,750 +4.8 -490 +8.9 9,260 +4.6 160 340 2000 10,360 +6.3 -680 +38.8 9,680 +4.5 167 355 2001 10,750 +3.8 -730 +7.4 10,020 +3.5 173 368 2002 11,150 +3.7 -1,060 +45.2 10,090 +0.7 174 370 2003 11,900 +7.6 -820 -22.6 11,080 +10.8 190 404 2004 11,400 -5.0 -770 -6.1 10,630 -5.0 183 389 2005 11,800 +3.5 -900 +16.9 10,900 +2.6 188 400 2006 12,200 +3.4 -950 +5.6 11,250 +3.2 193 406 2007 12,400 +1.6 -1,020 -1.0 11,380 +1.9 193 411 2008 12,500 +0.8 -980 -3.9 11,520 +1.2 192 409 2009 12,400 -0.8 -920 -6.1 11,480 -0.5 191 406 2010 12,150 -2.0 -1,000 +8.7 11,150 -2.9 186 396 2011 12,350 +1.6 -1,030 +3.0 11,320 +1.5 188 400 [source: Yearbook Bevitalia Beverfood.com estimates on associative, company and Research Institutes data] Production Import (+) / Export (-) Consumptions 17 AQUASYN – Italian Report Table 2. Summary of the main characteristics of Italian bottled waters market measurement unit N. N. % litre · 10-6 2011 2010 168 304 51.6 12,350 170 315 51.8 12,150 divided into: mineral waters other bottled waters (dispensers and table waters) litre · 10-6 litre · 10-6 12,200 150 12,000 150 PRODUCERS BUSINESS DOMESTIC CONSUMPTIONS PAR CAPITA CONSUMPTIONS CONSUMPTIONS MIX FOR WATER TYPES Euro · 10-6 litre · 10-6 litri 2,240 11,320 188 2,200 11,150 186 % % % 65 22 13 64 21 15 North-West North-East Center and Sardinia South and Islands % % % % 30 19 26 25 30 19 25 26 Plastic bottles Glass bottles Dispensers % % % 80 18 2 79 19 2 Iper, super, superettes and discount Traditional retail and ‘door to door’ Horeca, catering, vending % % % 70 11 19 69 12 19 ‘Italy Market’ BOTTLING COMPANIES BOTTLED WATER BRANDS FIRST 4 PRODUCTION GROUPS TOTAL PRODUCTION Natural still waters Sparkling waters Naturally effervescent waters CONSUMPTIONS FOR MACROAREAS SALES PACKAGES MIX SALES CHANNELS [source: Yearbook Bevitalia Beverfood.com estimates on associative, company and Research Institutes data] Table 3. Distribution of mineral waters for pH classes Geographic pH < 7 pH > 7 6.5 < pH < 8 area abs. value % abs. value % abs. value % North West 18 7.35 53 21.63 55 22.45 North East 7 2.86 36 14.69 30 12.24 Centre 16 6.53 52 21.22 57 23.27 South and Islands 34 13.88 29 11.84 41 16.73 TOTAL ITALY 75 30.62 170 69.38 183 74.69 [source: our processing on Yearbook Bevitalia Beverfood.com 2012-2013 and company data] Table 4. Distribution of mineral waters for classes of Fixed Residue (F.R. in mg/l) at 180°C F.R. < 50 50 < F.R. < 500 500 < F.R. < 1500 F.R. > 1500 abs. abs. abs. abs. % % % % value value value value North West 23 8.95 44 17.12 4 1.56 3 1.17 North East 5 1.94 32 12.45 5 1.94 2 0.78 Centre 2 0.78 50 19.45 18 7.00 2 0.78 South and Islands 2 0.78 47 18.29 15 5.84 3 1.17 TOTAL ITALY 32 12.45 173 67.31 42 16.34 10 3.90 [source: our processing on Yearbook Bevitalia Beverfood.com 2012-2013 and company data] Geographic area 18 AQUASYN – Italian Report Table 5. Distribution of mineral waters for mineral salt content classes (specific Electrical Conductivity, EC, at 20°C in µS/cm) EC < 100 100 < EC < 700 EC > 700 abs. % abs. value % abs. value % value North West 29 11.51 39 15.48 6 2.38 North East 7 2.78 29 11.51 8 3.17 Centre 3 1.19 44 17.46 23 9.13 South and Islands 5 1.98 40 15.87 19 7.54 TOTAL ITALY 44 17.46 152 60.32 56 22.22 [source: our processing on Yearbook Bevitalia Beverfood.com 2012-2013 and company data] Geographic area Table 6. Distribution of mineral water bottling plants and brands per Italian Provinces Province Aosta Total Valle d’Aosta Alessandria Biella Cuneo Torino Verbania Vercelli Total Piemonte Genova Imperia Savona Total Liguria Bergamo Brescia Como Lecco Sondrio Total Lombardia TOTAL NORTH WEST Bolzano Trento Total Trentino Alto Adige Padova Venezia Vicenza Total Veneto Pordenone Udine Total Friuli Venezia Giulia Bologna Modena Parma Reggio Emilia Rimini Total Emilia Romagna TOTAL NORTH EAST N. of plants 1 N. of brands 1 1 1 1 2 4 2 3 1 3 4 11 7 6 2 13 33 2 1 1 2 1 1 4 4 7 5 4 1 2 13 10 6 5 4 18 38 37 4 3 76 5 3 7 8 1 1 6 1 2 12 8 15 2 2 2 5 4 7 1 1 4 1 1 1 1 9 2 2 8 15 27 45 19 AQUASYN – Italian Report Arezzo Firenze Lucca Massa Carrara Pisa Pistoia Siena Total Toscana Ancona Ascoli Piceno Macerata Pesaro e Urbino Total Marche Perugia Terni Total Umbria Frosinone Latina Rieti Roma Viterbo Total Lazio L’Aquila Pescara Total Abruzzo Isernia Total Molise TOTAL CENTRE Benevento Caserta Napoli Salerno Total Campania 2 1 1 2 2 2 2 4 1 1 3 2 3 4 12 18 2 3 4 1 5 6 6 1 10 18 7 3 17 6 10 23 2 1 1 4 1 2 1 1 4 2 9 10 1 1 1 2 2 3 2 2 2 2 45 1 2 1 3 74 1 6 2 3 7 12 Bari Lecce 1 2 2 2 3 4 Potenza 4 9 Total Puglia Total Basilicata Catanzaro Cosenza Reggio Calabria Vibo Valentia Total Calabria Agrigento Catania Messina Palermo Ragusa Total Sicilia Cagliari Oristano Otranto 4 9 4 3 1 3 6 4 1 4 11 15 1 2 2 3 1 1 3 2 3 2 9 11 4 1 1 10 1 1 20 AQUASYN – Italian Report Sassari 4 Total Sardegna TOTAL SOUTH AND ISLANDS TOTAL ITALY 6 10 18 44 69 153 264 [source: our processing on Yearbook Bevitalia Beverfood.com 2012-2013] Table 7. Main companies producing bottled waters Bottling company Productive amounts (*) % litre · 10-6 Main brands Sanpellegrino Gruppo Nestlé Waters S. Pellegrino, Panna, Levissima, Nestlé Vera, S. Bernardo,… S. Benedetto, Guizza, Primavera, Acqua Gruppo San Benedetto Nepi,… Fonti di Vinadio Gruppo Bertone Sant’Anna, Alpi Bianche, Alte Vette,… Uliveto, Rocchetta, Brio Blu, Brio Blu Gruppo CoGeDi Frizzantissima Gruppo Norda Norda, Lynx, Alisea, Gaudianello, Leggera Ferrarelle, Boario, Vitasnella, Natìa, Ferrarelle S.p.A. Santagata S. Antonio, Valverde, S. Andrea,San Carlo Spumador Gruppo Refresco Spinone,… Fonti del Vulture S.r.l. Lilia, Sveva, Vivien, Solaria,… First 8 production groups Other producers 2,500 20.2 2,000 16.2 1,000 8.1 950 7.7 920 7.4 900 7.3 500 4.0 350 2.9 9,120 3,230 73.8 26.2 TOTAL ITALIAN PRODUCTION 12,350 100.0 [source: Bevitalia Beverfood evaluative processing on company, associative and Research Institutes data] (*) data refers to production (Italian trades + export), even on behalf of a third party. Table 8. Mineral waters produced in Sicily Province Plant Name Agrigento NESTLÉ VERA S.R.L. District S.Stefano di Quisquina Brand Nestlé Vera fonte Santa Rosalia Acquarossa Hidria Cavagrande Gerasìa Fontalba Solesi Mìlicia pH F.R. [mg/l] EC [µ µS/cm] 7.10 263 419 1230 1029 205 168.4 154.6 43 610.7 1780 1420 285 242 205 n.d. n.d. 60 81 6.30 CAVAGRANDE S.P.A. Belpasso (GRUPPO 6.40 MANGIATORELLA) Milo 7.00 REALE S.R.L. Alì Superiore 7.56 Messina S.I.B.A.M. S.P.A. Montalbano Elicona 6.72 ACQUASOLESI Palermo n.d. LA FONTE Altavilla Milicia 7.61 Palermo TERME DI GERACI Geraci Siculo Geraci 6.40 SICULO S.P.A. SI.A.M. SICIL Ruscella 7.14 Ragusa Modica ACQUE MINERALI Santa Maria 7.06 [source: our processing on Yearbook Bevitalia Beverfood.com 2012-2013 and Catania 445 680 383 513 company data] 21 AQUASYN – Italian Report 7. Methods of survey on Italian BWCs For a more detailed investigation on the bottled water companies (BWCs) operating in Italy, within AQUASYN project it has been developed a questionnaire. The questionnaire in its first draft was sent on the end of Nov 2013 to a list of 20 bottled water companies located in different Italian regions: 8 companies located in North Italy, 8 located in Central Italy and 4 located in South Italy. In this first group were selected only small bottled water companies. The information regarding the BWCs were gathered from the web site of the Italian Federation of Bottled Water Companies - MINERACQUA (www.mineracqua.it/) and from the websites of the different WBCs. In this first phase, none companies answered to questionnaires, notwithstanding CSEI staff did several phone calls and emails to push the companies to fill up the AQUASYN questionnaires. On January 2014, with the valuable and precious support of prof. Miquel Salgot of Universitat de Barcelona and dr. Antoni Borrel of Laboratorio Dr Oliver Rodes of Barcelona (www.oliver-rodes.com), a revised version of the questionnaire (see ANNEX 2.1) was set up avoiding the questions referring to confidential or privacy aspect of enterprises organisation, in fact some questions, reported in first version, were not appreciated by the BWCs. The version 2.0 of questionnaires (Spain&Italy) approved by ANEABE (Spanish Federation of Bottled Water Companies) was sent to a second and third group of water companies in Februaryand in March 2014 for a total of 67 companies equally located in different Italian regions, including also the largest Italian BWCs (8 companies control about 74% of the Italian bottled water market). In this second phase, 6 questionnaires were filled and sent back from the companies, the number of questionnaires was few, less than 3% of the total, but the companies represents about 25% of Italian market in terms of selling. However, the ansewering BWCs are very heterogenous: 2 BWCs represents a total 22 AQUASYN – Italian Report about 23,5 % of Italian market in terms of volume of bottled water and the other 4 BWCs are a total of about 1,5%. The questionnaire version 2.0 is organized in 4 main section. The section A and B refer some specific information about the BWC and particularly in the section B (7 questions) the different bottling sizes and material, and further it was requested to specify the extra information, not specifically mentioned. The section C "Questions related to the factory/ bottling procedures" (11 questions) regards bottling procedure and organisation. The section D "Questions related to training" (2 main questions and 7 sub questions) refers training and good practices applied by the BWC. The questionnaire was filled in a strictly anonymous with an undertaking not to disclose to third parties. In Annex 2.2 is reported the full list of companies to whom the questionnaires (both version 1.0 e 2.0) were sent. 8. Results of survey on Italian BWCs Six Italian BWCs have sent back the questionnaire (ver. 2.0), a limited number when compared with the total of Italian BWCs (153), but extremely significant in terms of production quantity and brands. In fact these BWCs represents about 25% of Italian bottled water market (about 12,235×106 litres per year), 26 brands and a total of 37 bottling plants located in the different Italian regions. So the information picked up from this survey are valuable and can give some additional information to the result reported in previous sections of this report. All the BWCs surveyed produce both mineral water (natural and sparkling water), and two of them other special drinks. Four surveyed BWCs use both PET and glass packages, two companies use only glass or PET and none company uses polycarbonate (PC). They use small format in PET (usually 0.5 L -2.0 L), and none produce big format (> 2.0 L). The glass format is usually 0.33 L-1.0 L. Three companies use 23 AQUASYN – Italian Report 0.25 L format for PET or glass bottles. One company is also specialized in the production of pouch format. The surveyed BWCs include a total of 37 bottling plants, and each company manage at least 2 plants. All the BWCs have generally indicated that in the case of sparkling water the gas is removed and added at constant concentration. One company specifically produce natural sparkling waters without gas addiction. Two surveyed BWCs produce other drinks, in the same factory but using different bottling lines. About the Question # C.2 - "What is the theoretical percentage of returnable bottles? And the real you returned?", one company don't use returnable bottles and one company not answered to this question, four companies declare an actual percentage of returnable bottles ranging from 80% to 90% Five BWCS have any studies expiration of their mineral bottled water, that means about 85% of the surveyed companies. About the Question # C.4 "Are PET bottles cleaned before filling?", one company not answered, one don't use PET bottles and 4 companies equally clean PET bottles with filtered water (2 companies) or sterile air at 100°C (2 companies). These four companies, before filling PET bottles, use both automatic and visual inspection. The surveyed BWCs that use glass returnable bottles (on five of six companies), two companies use both caustic soda plus peracetic acid (PAA) for bottle disinfection, two companies only caustic soda and one company only PAA. None company, using glass returnable bottles, has any way to check the number of times that a bottle is reused (Question # C.8). But four of them declare (one company not answered) that glass bottles are reused < 10-20 times. After the refilling of glass bottles (Question # C.9) , three BWCs do visual and automatic inspection and two companies only automatic inspection. All six surveyed BWCs have standard procedures for taking care of complaints (Question # C.10) and they have responsibility in supply and bottling water Question # C.11 24 AQUASYN – Italian Report On four of six surveyed companies have declared (Question # D.12) that company staff is trained according to the Guide "Good Hygienic Practice for Bottled Water in Europe" of EFBW (European Federation of Bottled Water). Five surveyed companies have a specific training program for the staff (Question # D.13.1) to all levels of the company (from the manager/ CEO to line operators) (Question # D.13.2). Three BWCs declare that training is externalized and two companies not answered to Question. # D.13.3. 25 AQUASYN – Italian Report Only two BWCs declare to be interested in developing programs of formation distantly by e- learning, external formation or presencial programs inside the same company (Question # D.13.4). Four surveyed companies declare possible fields of training as indicated (Question # D.13.5): a. HACCP (Hazard analysis and critical control points) or similar systems. b. Hygienic principles (cleaning and disinfection procedures for facilities including bottling lines)in bottled water or similar procedures. c. Activities inside the facilities (e.g. bottling procedures). d. Actions outside the facilities (e.g. protection of recharge area). e. Quality Assurance, including specific analytical procedures (i.e. detect outbreaks of contaminating microorganisms, microbiology, parasitology, chemistry, etc). f. Studies of quality in your source. g. Emerging contaminants (e.g. pesticides, migration from package material or by products). h. Procedures to deal with residues. i. New materials in contact with water. j. Handling of complaints. k. Distribution procedures. 26 AQUASYN – Italian Report Question BWC- A BWC - B BWC - C BWC - D BWC - E BWC - F D.13.5 All items a, b, c, d a, b, c, d, i ,j , k a, b, c, d, e, f, h, j n.a. n.a. n.a.= not answered Items a, b,c and d are the most fields of interest for the BWCs, while g (the emerging contaminants) was indicated only one time from the company that is the largest of the surveyed sample. Five surveyed companies declare spending money on R+D+I (Research, Development and innovation) (Question # D.13.6). Five surveyed companies are interested to join in a program for issuing training certificates for their staff, if an agreement is reached with their association (Question # D.13.7). 27 AQUASYN – Italian Report 9. Conclusion In Italy the bottled water market is extremely active and represent a very important industrial sector, that is well organized under the egida of MINERACQUA (The Federation of Italian Bottling Water Companies), who organize conferences, meetings and training courses of excellence, who support the editing of handbook, and who commit to universities and research centers studies on different items of interest for the BWCs. The sample of surveyed BWCs was limited in terms of number, however it is possible to get some general indication about the fields of interest: a. HACCP (Hazard analysis and critical control points) or similar systems. b. Hygienic principles (cleaning and disinfection procedures for facilities including bottling lines)in bottled water or similar procedures. c. Activities inside the facilities (e.g. bottling procedures). d. Actions outside the facilities (e.g. protection of recharge area). Many of the surveyed companies spend money on R+D+I (Research, Development and innovation) and are interested to join in a program for issuing training certificates for their staff under the egida of their association. In Italy, a general interest for training courses exists among BWCs, however surveyed BWCs have showed interest to join in a training programme within a collaboration with their bottling federation, this could be an hampering factor to development of e-learning courses within Aquasyn project. 28 Annex 1. Main qualitative characteristics of Italian mineral waters. Bottling plant Macroarea Region Valle d'Aosta Province Aosta Alessandria North-West Biella Piemonte Name District SORGENTI MONTE BIANCO - TERME di COURMAYEUR SpA Morgex FONTI FEJA S.r.l. Donato LAURETANA S.p.A. Graglia Vinadio Cuneo FONTI ALTA VALLE PO S.p.A. LURISIA ACQUE MINERALI S.r.l. Brand Quality parameters Fixed Electrical residue at Hardness Nitrates Conductivity 180°C [°F] [mg/l] [S/cm] [mg/l] Name District pH Courmayeur Youla Morgex 7.10 2270 2287 n.a. 2 Augusta Fornace 7.30 742 503 n.a. 7.4 San Rocco Rio Freddo 7.40 573 407 n.a. 10.9 Sovrana Sovrana 7.30 611 420 n.a. 5.9 Alpe Guizza Primavera delle Alpi Lauretana Fonte Caudana Castelletto d’Orba Castelletto d’Orba Castelletto d’Orba Donato 7.30 93.4 71.7 4.5 6.8 Primavera Donato 8.10 184.2 123.1 9.2 11.4 Lauretana Graglia 6.00 15.9 14 0.44 1.9 Monte Rosa Fonte Graglia Graglia 6.10 19.2 16.5 0.53 2.7 Alpi Bianche n.a. Vinadio 7.89 88.9 55 3.3 n.a. Alte Vette n.a. Vinadio 6.60 60.8 44.5 3.2 n.a. Cime Bianche Sant’Anna Bio Bottle Sant’Anna di Vinadio Sant’Anna Sorgente Rebruant n.a. Vinadio 7.10 69 50.1 3.5 n.a. n.a. Vinadio 6.90 24.5 23.8 0.6 1.1 n.a. Vinadio 7.30 71.2 42.8 3.1 1 Rebruant Vinadio 6.90 24.5 23.8 0.6 1.1 Fontanone Paesana 6.80 81 49 n.a. 2.4 Fonte Santa Barbara Lurisia Roccaforte M.Vì Lurisia Roccaforte M.Vì Lurisia Roccaforte M.Vì 6.20 31 34.8 <1 1.5 6.00 38 32 <1.6 3 6.20 31 34.8 <1 1.5 Castelletto d’Orba ALPE GUIZZA S.p.A. (Group San Benedetto) FONTI DI VINADIO S.p.A. (Group Bertone) Spring/Aquifer Paesana Eva Lurisia Fonte S. Barbara Lurisia Lurisia Fonte Roccaforte M.Vì dei Pini Lurisia Bolle Stille Fonte dei Pini Fonte Santa Barbara n.a. is not available information (*) not available information, assigned the same district of the bottling plant I Bottling plant Macroarea Region Province Cuneo Name District SANPELLEGRINO S.p.A. (Group Nestlé Waters) Garessio PIAN DELLA MUSSA S.r.l. Balme Torino PONTEVECCHIO S.r.l. Spring/Aquifer Brand S.Bernardo Sorgente Rocciaviva Pian Della Mussa Fonte Sauzè North-West Verbania Vercelli Genova Liguria Imperia BOGNANCO ACQUE MINERALI Bognanco District Rocciaviva Garessio 7.00 47 34 2.5 1.2 Fonte Sauzè Balme 6.86 54 36 2.5 n.a. 6.90 39 32.2 1.4 n.a. 6.40 19.5 16.9 0.4 n.a. 6.70 27.5 22.5 0.78 n.a. 7.20 29.7 24.4 n.a. n.a. 6.90 33 26 1.1 n.a. 7.40 69.5 49.8 3.8 n.a. Oro Fonte Delle Alpi Seccarezze Monviso Fucine Montoso Martina Sparea Sparea Valmora Aburù Luserna S. Giovanni (*) Luserna S. Giovanni (*) Luserna S. Giovanni (*) Luserna S. Giovanni (*) Luserna S. Giovanni (*) Rorà Vigezzo-Alpia Alpia Malesco 8.00 72 60 n.a. 3.2 Ausonia Fonte Gaudenziana San Lorenzo Ausonia Bognanco 8.10 138 95.2 n.a. 3.3 Gaudenziana Bognanco 8.10 138 95.2 n.a. 3.3 San Lorenzo Bognanco 6.36 2440 2085 171 0.69 Melenos San Lorenzo Bognanco 6.40 2285 2100 n.a. 1 Luserna S. Giovanni Malesco Name Alpi Cozie Piemonte ACQUE TERME DI VIGEZZO S.r.l. Quality parameters Fixed Electrical residue at Hardness Nitrates pH Conductivity 180°C [°F] [mg/l] [S/cm] [mg/l] CAMPARI ITALIA (Group Campari) Crodo Crodo Lisiel Lisiel Crodo 7.80 340 234.9 n.a. 3.4 SPUMADOR S.p.A. (Group Refresco) Valverde Gioiosa della Valsesia Valverde Gioiosa della Valsesia Quarona Sesia (*) 6.50 51.6 42.8 1.2 5.1 Quarona Sesia Quarona Sesia (*) 6.03 60 49.8 1.85 7.5 Carasco Santa Clara Santa Clara Borzonasca 8.00 255 144.1 12.5 1.4 Rovegno Alta Valle Fonte Galletto Rovegno 7.80 235 154 n.a. 1.6 Pornassio S. Vittoria Fontana Fredda Montegrosso Pian Latte 7.90 320 180 n.a. 1.6 FONTI S. CLARA S.r.l. VALTREBBIA ACQUE MINERALI S.p.A. SANTA VITTORIA S.r.l. n.a. is not available information (*) not available information, assigned the same district of the bottling plant II Bottling plant Macroarea Region Liguria Province Savona Name ACQUA MINERALE DI CALIZZANO S.p.A. ACQUA MINERALE STELLA ALPINA S.r.l. BRACCA ACQUE MINERALI S.p.A. North-West FONTI DI GAVERINA S.p.A. Bergamo Lombardia FONTI PINETA S.p.A. FONTI PREALPI S.p.A. Spring/Aquifer Brand District Calizzano Calizzano Fonti Bauda Pioda Moio dè Calvi Zogno Stella Alpina Bracca Antica Fonte Flavia Nuova Fonte Gaverina Gaverina Terme Fonte Centrale Pineta Sorgente Sales Clusone Sorgente Presolana Orobica Almè Prealpi SANPELLEGRINO (Group Nestlé Waters) San Pellegrino Terme S. Pellegrino SPUMADOR S.p.A. (Group Refresco) Spinone al Lago Primula San Carlo Spinone FERRARELLE S.p.A. Darfo Boario Terme FONTE SOLE S.r.l. FONTI DI VALLIO S.p.A. Name District Fonti Bauda Calizzano (*) 7.20 53 43 1.6 3.2 Pioda Fonte dell'Alta Valle Brembana Lenna 8.00 247 149 14.2 5.8 Moio dè Calvi 7.50 71 48 3.5 2.2 Bracca Zogno (*) 7.50 836 640 n.a. 1.2 Flavia Zogno (*) 7.60 417 262 n.a. 1.3 n.a. Zogno 7.50 469 308 n.a. 4.4 Fonte Centrale Gaverina Terme 7.80 610 437 n.a. 0.7 Sales Clusone 7.90 316 199 n.a. 7.7 n.a. Clusone 7.80 342 207 n.a. 4.8 Orobica Almè (*) 7.80 439 298 n.a. n.a. n.a. Almè (*) 7.40 546 383 n.a. <0.1 Sorgenti S. Pellegrino San Pellegrino Terme n.a. 1149 948 n.a. 2.9 Spinone al Lago (*) 7.30 675 452.4 n.a. 3.2 605 405.2 n.a. 6.2 590 590 n.a. 7 565 394 n.a. 5 575 375 36 n.a. 452 270 n.a. 4.1 n.a. Fonte Nuova Boario n.a. Vitasnella n.a. Nuvolento Sole Sole Vallio Terme Castello Castello Brescia Quality parameters Fixed Electrical residue at Hardness Nitrates pH Conductivity 180°C [°F] [mg/l] [S/cm] [mg/l] Spinone al Lago 7.50 Darfo Boario Terme 7.30 (*) Darfo Boario Terme 7.50 (*) Nuvolento 7.50 Vallio Terme 7.70 n.a. is not available information (*) not available information, assigned the same district of the bottling plant III Bottling plant Macroarea Region Province Brescia Name MANIVA S.p.A. (Group Maniva S.p.A.) TAVINA S.p.A. North-West Como Name District Balda Fonte Alpina Bagolino Quality parameters Fixed Electrical residue at Hardness Nitrates pH Conductivity 180°C [°F] [mg/l] [S/cm] [mg/l] 7.90 185 123 n.a. 3.7 Maniva Fonte Alpina Bagolino 7.70 141 98 n.a. 4.1 Vaia Fonte Alpina Bagolino 8.20 191 128 10.5 3.9 Allegra Allegra Salò 7.60 597 399 n.a. 3.2 Linda Linda Salò 7.30 602 403 n.a. 14.1 Tavina Tavina Salò 7.40 540 356 n.a. 3.9 S. Luigi S. Luigi Barni 7.60 347 232.5 n.a. 7.8 S. Antonio S. Antonio Cadorago (*) 7.90 202.7 128.9 10.3 3.4 S. Francesco n.a. Caslino al Piano 7.80 210 134 10.8 7.4 Chiarella Chiarella Plesio 7.50 347 208 n.a. 6.5 Fonte Laura n.a. Plesio n.a. 345 210 n.a. 6.9 n.a. Lanzo Intelvi (*) 7.50 343 226.4 n.a. 9.7 Leonardo Primaluna 7.60 78 63.2 4.3 3.5 Grigna Primaluna 7.70 320 204 19.2 9.3 Primaluna Paraviso Leonardo (Alisea) Grigna (Coop) Luna Luna Primaluna 7.40 320 228 n.a. 9.6 Primaluna n.a. n.a. n.a. n.a. n.a. Daggio Primaluna 7.20 85 60 4.1 3.5 n.a. Piuro (*) n.a. n.a. n.a. n.a. n.a. Piuro Luna (Sigma) Daggio (Norda) Bernina/St. Moritz Bernina Bernina Piuro (*) 7.10 49 38.9 n.a. 3.5 Frisia Frisia Piuro (*) 7.10 103 78 n.a. 4.5 Valdisotto 7.80 124 80.5 n.a. 1.6 Forst/Lagundo (*) 6.39 43 42 n.a. 0.8 27 21 1.2 1.1 Bagolino Salò Barni SPUMADOR S.p.A. (Group Refresco) Cadorago Lombardia NORDA S.p.A. (Group Norda) FRISIA S.p.A. Brand District FONTI DI BARNI S.r.l. ACQUE MINERALI VAL MENAGGIO Lecco Spring/Aquifer Plesio Lanzo Intelvi NorthEast Sondrio Trentino Alto Adige SANPELLEGRINO S.p.A. (Group Nestlé Waters) Cepina Valdisotto Levissima n.a. AQUAEFORST S.r.l. Forst/Lagundo Meraner S. Vigilio San Vigilio FONTE PLOSE S.p.A. Bressanone Plose Plose Bolzano Bressanone 6.60 n.a. is not available information (*) not available information, assigned the same district of the bottling plant IV Bottling plant Macroarea Region Province Bolzano Trentino Alto Adige Trento North-East Padova Venezia Veneto Vicenza Name District FONTI TERME DI BRENNERO S.r.l. Brennero KAISERWASSER S.r.l. S. Candido Spring/Aquifer Brand Name District Quality parameters Fixed Electrical residue at Hardness Nitrates pH Conductivity 180°C [°F] [mg/l] [S/cm] [mg/l] Sanct Zacharias Kaiserwasser Terme di Brennero n.a. Brennero 7.24 580 400 32.8 1 S. Candido 7.66 897 730 n.a. 1.6 Lavaredo Fonti S. Candido S. Candido 7.32 1470 1400 n.a. <0.5 Levico Terme (*) 6.55 53 36 2.4 1.3 Cogolo di Pejo 6.90 136 94.7 n.a. 2.9 Pinzolo 6.70 44 36 n.a. 4.7 San Giorgio in Bosco 7.90 251 162 n.a. 4.4 LEVICO ACQUE S.r.l. Levico Terme Levico Casara n.a. SANPELLEGRINO S.p.A. (Group Cogolo di Pejo Pejo Fonte Alpina Nestlé Waters) SURGIVA F.LLI LUNELLI S.p.A. Carisolo Surgiva n.a. (Group F.lli Lunelli) SANPELLEGRINO Nestlé Vera San Giorgio in S.p.A. (Group Fonte In Fonte In Bosco Bosco Nestlé Waters) Bosco ACQUA MINERALE Fonte Guizza Guizza SAN BENEDETTO Scorzè San S.p.A. (Group San Benedetto Benedetto San Benedetto) Valli del Pasubio Alba Alba Azzurra Camonda FONTE Fonte Margherita MARGHERITA S.p.A. Torrebelvicino Margherita Sorgente Camonda Camonda Fonte Regina Regina FONTE REGINA Valli del Pasubio STARO S.r.l. Lonera Lonera Beber Beber-Doppio FONTI DI POSINA Posina S.p.A. Lissa Lissa Pasubio Fonte Pasubio (Alisea) Dolomiti NORDA S.p.A. Dolomiti Valli del Pasubio (Esselunga) (Group Norda) Nuova Acquachiara Cortiane (Norda) Scorzè (*) 7.50 415 265 n.a. 8.7 Scorzè (*) 7.42 415 272 n.a. 8.5 Valli del Pasubio (*) 6.30 Torrebelvicino (*) 7.80 59 571 44 395 n.a. n.a. 1 4 Torrebelvicino (*) 6.60 2360 2040 n.a. 0 Torrebelvicino (*) 7.50 575 439 n.a. 4 Valli del Pasubio Valli del Pasubio Posina Posina n.a. 8.10 8.20 8.00 2250 225 230 284 1726 110 133 169 n.a. n.a. 13.4 16.4 n.a. 3 3.4 4.6 Valli del Pasubio (*) 7.96 423 273 26.2 6.9 Valli del Pasubio (*) 8.18 178 114 n.a. 3.4 Valli del Pasubio (*) 8.10 233 141 13.9 3.3 n.a. is not available information (*) not available information, assigned the same district of the bottling plant V Bottling plant Macroarea Region Veneto Province Name Brand District SANPELLEGRINO S.p.A. (Group Recoaro Terme Nestlé Waters) ANDROMEDA S.p.A. Clauzetto SORGENTE Pordenone VALCIMOLIANA Cimolais S.r.l. Vicenza Friuli Venezia Giulia GOCCIA DI CARNIA S.p.A. Forni Avoltri PARADISO S.p.A. (Group Gabeca BS) Bologna Modena Emilia Romagna CERELIA SORGENTE ACQUA MINERALE S.r.l. S.E.M. SORGENTI EMILIANE MODENA S.p.A. (Group S.E.M. Sorg. Emil. Modena) NORDA S.p.A. (Group Norda) Parma SPUMADOR S.p.A. (Group Refresco) Paradiso di Pocenia Quality parameters Fixed Electrical residue at Hardness Nitrates pH Conductivity 180°C [°F] [mg/l] [S/cm] [mg/l] Name District Recoaro n.a. Recoaro Terme 8.10 240 155 n.a. 4 Pradis Pradis Clauzetto 7.70 222 124 n.a. 3.2 Acqua Dolomia Valcimoliana Cimolais 8.10 200 108 12.6 1.8 Forni Avoltri 8.34 112 69 6 1.6 Forni Avoltri Baby Goccia Udine North-East Spring/Aquifer Goccia di Carnia Fonte Annia Fonte Corte Paradiso Torsa Sorgente di Fleons Sorgente di Fleons Annia 8.40 118 78 6.5 2 Paradiso di Pocenia 7.87 415 292 n.a. 3 Paradiso Paradiso di Pocenia 7.40 505 337.6 n.a. 0 Torsa Paradiso di Pocenia n.a. n.a. n.a. n.a. n.a. 7.30 573 386 n.a. 1.4 Ospitale di Fanano 7.70 (*) 195 116 10.5 1.8 Cereglio Cerelia Cerelia Ospitale di Fanano Monte Cimone Monte Cimone Reale (Alisea) Sorgente Reale Tarsogno Ducale Sorgente Ducale (Norda) Fonti di San Lynx Fermo Masanti di S. Fermo Fonti di San Bedonia (Norda) Fermo Vela (Pam Fonte Vela Panorama) Fontechiara Fonte Chiara Medesano Fraz. S. Andrea Fonte Lidia S. Andrea Bagni Lidia S. Andrea S. Andrea Cereglio Tarsogno (*) 7.84 95 59 n.a. 2.5 Tarsogno (*) 8.00 92 59 4 1.7 Bedonia 7.80 261 184 15.3 2.8 261 184 15.3 2.8 328 206 18.7 1.4 698 470 25.2 6.3 Masanti di Bedonia 7.80 (*) Masanti di Bedonia 7.60 (*) Madesano (*) 7.50 Madesano (*) 9.40 784 488.5 2.4 3.3 Madesano (*) 7.70 797 579.5 39.3 4.7 n.a. is not available information (*) not available information, assigned the same district of the bottling plant VI Bottling plant Macroarea Region Province North-East Parma Emilia Romagna Reggio Emilia Rimini Name FONTE VARANO DEI MARCHESI S.a.s. (Group Fabriella) NUOVA S.A.MI.CER. S.p.A. (Group S.E.M.) LA GALVANINA S.p.A. (Group Galvanina) FONTE SANTAFIORA S.p.A. Spring/Aquifer Brand District Varano dei Marchesi Cervarezza Rimini Centre Toscana Lucca Massa Carrara Pisa District Varanina n.a. Fonte Lieta Fonte Ventasso Fontesana Lieta Cervarezza (*) Ventasso Monte San Savino Arezzo Firenze Name 409 236.5 1.5 6 7.80 250 170 12.3 <1 Cervarezza (*) 7.50 241 162 11.7 <1 Fontesana Rimini 7.19 767 540 n.a. n.a. Galvanina Galvanina Rimini 7.60 875.8 570 n.a. n.a. Fonte Dè Medici n.a. 7.40 509 311 21 0.2 7.50 1112 655 34 12 7.50 1112 653 37 12 Chiusi della Verna (*) 7.40 238 156 n.a. 0.5 n.a. Scarperia 8.00 222 141 10.3 2.9 Ilaria Pescaglia 7.60 373 247 n.a. 13.1 S. Carlo Terme (*) 5.70 79 56.5 n.a. 9.1 Perla n.a. Santafiora n.a. n.a. SORGENTE VERNA S.r.l. (Group Maniva S.p.A.) Chiusi della Verna Verna SANPELLEGRINO S.p.A. (Group Nestlé Waters) Scarperia Acqua Panna FONTE ILARIA Monsagrati Fonte Ilaria S.p.A. TERME E SORGENTI S. Carlo S. Carlo Terme S.CARLO Fonte Aurelia EVAM S.p.A. ENTE Fonteviva VALORIZZAZIONE Massa Amorosa ACQUE MINERALI SORGENTE Montopoli Val Tesorino TESORINO S.r.l. d’Arno ACQUA E TERME DI ULIVETO S.p.A. Vico Pisano Uliveto (Group CO.GE.DI. Terme International) PIAZZA NAVONA Pistoia San Felice Pistoia n.a. is not available information (*) not available information, assigned the same district of the bottling plant Quality parameters Fixed Electrical residue at Hardness Nitrates pH Conductivity 180°C [°F] [mg/l] [S/cm] [mg/l] Fonte Aurelia Varano dei Marchesi 7.49 Monte San Savino (*) Monte San Savino (*) Monte San Savino (*) Volpara Massa (*) 6.90 80 45.4 2.8 1.1 Acquaviva Massa (*) 5.20 32 25 <1 <1 Tesorino Montopoli Val d’Arno 7.10 860 599 42.6 0.3 Uliveto Vico Pisano Terme 5.80 (*) 1122 762 n.a. 7.2 402 211 21 n.a. San Felice Pistoia (*) 7.60 VII Bottling plant Macroarea Region Province Pistoia Toscana Siena Centre Ancona Ascoli Piceno Marche Macerata Name District SORGENTE ORTICAIA S.r.l. (Group Puccetti) Pracchia SORGENTE S. ELENA S.p.A. Chianciano Terme TERME DI CHIANCIANO S.p.A. Chianciano Terme Spring/Aquifer Acqua Silva Sorgente Orticaia Pracchia (*) Quality parameters Fixed Electrical residue at Hardness Nitrates pH Conductivity 180°C [°F] [mg/l] [S/cm] [mg/l] n.a. 230 156 12.6 0.6 Monteverde Sorgente Orticaia Pracchia (*) n.a. 282 190 14.9 1.6 Brand Name District Marzia Fonti Chiusine Chianciano Terme 6.50 1680 1390 n.a. 1.2 Sant’Elena Acqua Santa Chianciano Fucoli Fonti Chiusine Chianciano Terme 7.20 750 490 n.a. 30 Santa Chianciano Terme 6.15 3410 3280 n.a. 1.4 Fucoli Chianciano Terme 6.70 2813 2600 n.a. 1.3 Fonte Elisa Grotte di Frasassi Genga 7.38 472 311.5 n.a. n.a. Frasassi Grotte di Frasassi Genga 7.38 522 334.1 n.a. n.a. Gaia Grotte di Frasassi Genga Goccia Blu Grotte di Frasassi Genga Frasassi Fabriano S. Cassiano San Cassiano Fabriano Fonte Di n.a. Torre Di Palme (*) Palme DITTA FEDELI Torre di Palme DOMENICO Palmense Del n.a. Torre Di Palme (*) Piceno Alisea n.a. Montefortino (*) HOSTBROOK S.p.A. Montefortino Tinnea Tinnea Montefortino (*) Fonte n.a. Montefortino (*) Preistorica S.A.G.M.A. S.r.l. Montefortino Gallo n.a. Montefortino (*) Tolentino A.S.S.M. S.p.A. Tolentino Sorgente S. Santa Lucia Tolentino Lucia Fonte Castelsantangelo Nerea dell'Uccelletto sul Nera Castelsantangelo NEREA S.p.A. sul Nera Castelsantangelo Magrella n.a. sul Nera (*) S.I.BE. S.p.A. Ussita Roana Sorgenti Panico Ussita (*) 7.55 476 314.2 n.a. 6.2 7.38 522 334.1 n.a. 7.45 387 263.2 n.a. 2.8 7.20 793 544 n.a. 43.5 7.20 870 665 n.a. 42.6 S. Giacomo S. Giacomo Tre Santi Tre Santi TOGNI S.p.A. (Group Togni) TIAMAT S.r.l. Genga Sarnano n.a. n.a. n.a. n.a. n.a. 7.45 339 211 n.a. 2.4 7.19 624.2 389.48 n.a. n.a. 7.13 650 463 37.14 1.43 7.42 892 579.81 41.12 n.a. 7.60 258 161 14.8 1.4 7.65 254.4 160.8 14.84 1.33 7.45 174.8 109.1 10 1.18 Sarnano 7.42 768.1 499.24 n.a. n.a. Sarnano 7.10 700 459 n.a. n.a. n.a. is not available information (*) not available information, assigned the same district of the bottling plant VIII Bottling plant Macroarea Region Province Marche Pesaro e Urbino Name LA GALVANINA S.p.A. (Group Galvanina) IDROLOGICA UMBRA S.r.l. MOTETTE S.r.l. Centre NOCERA UMBRA FONTI STORICHE S.p.A. (Group S.E.M. Sorg. Emil. Modena) Umbria Perugia ROCCHETTA S.p.A. (Group Co.Ge.Di. International SpA) Spring/Aquifer Brand District District Apecchio (*) Apecchio Val Di Meti n.a. 7.29 523.4 326.6 n.a. 1.09 Massa Martana Sanfaustino n.a. Massa Martana (*) 6.19 1712 1193 114 3.8 n.a. Scheggia (*) Scheggia Altea Fonte Santa Chiara Motette 7.50 422 285 n.a. <0.5 n.a. Scheggia (*) 7.36 562 392 n.a. 1.7 n.a. Scheggia (*) 7.51 286 180 n.a. 1.5 Angelica n.a. Nocera Umbra (*) 7.36 396 270 n.a. 10.6 Flaminia n.a. Nocera Umbra (*) 7.50 n.a. 204 n.a. 2.4 n.a. Gualdo Tadino (*) 7.47 278.7 177.8 n.a. 1.29 n.a. Gualdo Tadino (*) 7.47 278.7 177.8 n.a. 1.29 n.a. Gualdo Tadino (*) 7.47 278.7 177.8 n.a. 1.29 Viva Cerreto di Spoleto 7.50 423 298 n.a. 2.3 Misia Cerreto di Spoleto 7.57 327 220 n.a. 1.7 Viva Cerreto di Spoleto 7.50 423 298 n.a. 2.3 Celeste n.a. Cerreto di Spoleto 7.50 423 298 n.a. 2.3 Rugiada Lieve Sorgente Rugiada Contessa Rugiada Gubbio 7.73 480 301 n.a. 1.13 Rugiada Gubbio 7.73 480 301 n.a. 1.13 n.a. Gubbio (*) n.a. n.a. n.a. n.a. n.a. Fonte Tullia n.a. Sellano (*) 7.48 383 231 n.a. n.a. Nocera Umbra Rocchetta Naturale Rocchetta Gualdo Tadino Brio Blu Rocchetta Brio Blu Frizzantissima Lieve Sorgente Viva Cerreto di Misia Spoleto Viva S.I.A.MI. S.p.A. Gubbio TULLI ACQUE MINERALI S.r.l. Name Sellano Quality parameters Fixed Electrical residue at Hardness Nitrates pH Conductivity 180°C [°F] [mg/l] [S/cm] [mg/l] n.a. is not available information (*) not available information, assigned the same district of the bottling plant IX Bottling plant Macroarea Region Lazio Name District SOCIETÀ PER AZIONI DELLE ACQUE DI S. FRANCESCO (Group Sangemini) Acquasparta Brand Amerino Quality parameters Fixed Electrical residue at Hardness Nitrates pH Conductivity 180°C [°F] [mg/l] [S/cm] [mg/l] Name District Sorgenti di S. Francesco Acquasparta 7.06 737 494.2 n.a. n.a. n.a. n.a. Sangemini San Gemini (*) San Gemini (*) San Gemini (*) 6.15 7.09 6.35 1635 695 1376 1190 471 995 n.a. n.a. n.a. 6.8 8.2 0.77 FONTE ITALIA S.r.l. Frosinone TERME DI FIUGGI Latina PROVES ANTICHE FONTI DI Rieti COTTORELLA S.p.A. Guarcino Fiuggi Castelforte Effeviva Fabia Sangemini Fonti Di Orvieto Tione Filette Fiuggi Suio Rieti Cottorella Cottorella ACQUA CLAUDIA S.r.l. (Group Tione) Anguillara Sabazia Claudia Sorgenti termali dell'Imperatore Claudio Roma Egeria n.a. Roma (*) 6.56 926 648.3 n.a. 34.1 Roma Appia Appia Roma 6.89 883 640 n.a. n.a. Roma S. Maria Alle Capannelle S. Maria Alle Capannelle Roma 5.77 820 615 n.a. 43.5 Acqua Di Nepi Nepi Nepi 5.54 785 576 n.a. 12 Fonte Vivia Vivia Nepi 5.56 770 586 n.a. 7.5 Canistro 7.70 290 180 n.a. 1.1 Fonte Primavera Popoli (*) 7.18 492 313 n.a. 3 Valle Reale Popoli (*) 7.28 467 290 n.a. 4 Terni Centre Umbria Province Spring/Aquifer Roma Viterbo L'Aquila Abruzzo Pescara SANGEMINI S.p.A. San Gemini TIONE S.r.l. Orvieto ACQUA SANTA DI ROMA S.r.l. APPIA SORGENTE FONTE CAPANNELLE ACQUE MINERALI S.r.l. ACQUA DI NEPI S.p.A. (Group Acqua Minerale San Benedetto) SORGENTE SANTA CROCE S.p.A. (Group Colella) GRAN GUIZZA S.p.A. (Group San Benedetto) Nepi Canistro Popoli n.a. Orvieto 7.20 213 184 n.a. 19.2 Sorgente Tione Filette Fiuggi Suio Orvieto Guarcino Fiuggi Castelforte (*) 7.20 7.30 7.63 7.00 213 366 158.2 892 180 209 123 512 n.a. n.a. 7 n.a. 20.6 0.6 2.2 0 Rieti 7.20 475.1 296.5 n.a. 0.8 939 536 n.a. 8 Santa Croce Sorgente Sponga Fonte Primavera Gran Guizza Valle Reale Anguillara Sabazia 6.00 n.a. is not available information (*) not available information, assigned the same district of the bottling plant X Bottling plant Centre Macroarea Region Molise Province Isernia Benevento Spring/Aquifer Name District CASTELLINA S.p.A. (Group Colella) Castelpizzuto DI IORIO S.p.A. Brand Name District Castellina Folgara Castelpizzuto (*) Santa Elena Sannita Molisia Molisia IMPRESA A. MINIERI S.p.A. Telese Terme Telese Buvette Telese Terme (*) FERRARELLE S.p.A. Riardo Ferrarelle Natìa Santagata Lete n.a. n.a. n.a. n.a. LETE S.p.A. Pratella Prata n.a. Caserta Sorgesana Campania South and Islands Napoli Salerno Bari Puglia ACETOSELLA S.r.l. FUTURELLA S.p.A. Sant'Arsenio SORGENTI MONTE BIANCO - TERME DI Contursi Terme COURMAYEUR S.p.A. SORGENTI S. Montesano sulla STEFANO S.p.A. Marcellana Potenza Cristalià Fonte Don Carlo Santo Stefano Amata Don Carlo Santo Stefano Castello CASTELLO S.r.l. Casamassima Vivissima Castello EUREKA S.p.A. Corigliano d’Otranto Eureka Madonnina PARAVITA S.r.l. Parabita Paravita FONTE ITALA S.r.l. Atella FONTI DEL VULTURE S.r.l. Rionero in Vulture - C.da La Francesca Fonte Itala Lilia Sveva Vivien Lecce Basilicata Castellammare di Stabia n.a. Fonti Acidule Acetosella Plinio Acqua Della Fonti Acidule Madonna Plinio (Madonna) Futurella n.a. Fonte della Coltura Fonte Itala Fonti del Vulture Fonti del Vulture Fonti del Vulture Quality parameters Fixed Electrical residue at Hardness Nitrates pH Conductivity 180°C [°F] [mg/l] [S/cm] [mg/l] 7.00 285 171 n.a. <1 Santa Elena Sannita 7.74 377 235 21 2 6.29 2900 1799 153 4.33 Riardo (*) Riardo (*) Riardo (*) Pratella 6.10 6.30 6.00 6.30 1800 360 1470 1264 1290 303 1070 840 n.a. n.a. n.a. n.a. 5 9.5 4 4.7 Pratella 7.40 648 415 n.a. 3.95 Pratella Castellammare di Stabia Castellammare di Stabia Sant'Arsenio (*) 7.40 467 310 n.a. 3.5 6.33 2180 1445 n.a. 2.6 5.90 2095 1380 n.a. 7 7.52 314 201 n.a. 3.5 Contursi Terme (*) 6.62 980 615 n.a. 2.8 7.10 341 226 n.a. 4.4 7.03 751 468 n.a. n.a. Casamassima (*) 6.71 Corigliano d'Otranto 7.30 (*) 768 465 n.a. n.a. 623 381 n.a. 24.3 Montesano sulla Marcellana (*) Casamassima (*) Parabita (*) 7.63 1054 639 n.a. 25.7 Atella Rionero in Vulture Rionero in Vulture Rionero in Vulture 5.80 6.33 6.25 5.95 625 468 1854 354 394 383 1356 301 19.77 n.a. n.a. n.a. n.a. 6 3 n.a. n.a. is not available information (*) not available information, assigned the same district of the bottling plant XI Bottling plant Macroarea Region Basilicata Province Potenza South and Islands Catanzaro Name District FONTI DEL VULTURE S.r.l. Rionero in Vulture - Fraz. Monticchio Bagni MONTICCHIO GAUDIANELLO S.p.A. (Group Norda) CALABRIA ACQUA MINERALE di Cristofaro S. & C. S.a.s. FONTANA DELLA SALUTE S.r.l. Reggio Calabria Vibo Valentia Name District Solaria Toka Felicia Fonti del Vulture Fonti del Vulture Fonti del Vulture Monticchio Bagni Monticchio Bagni Monticchio Bagni Gaudianello Monticchio Fonti di Monticchio Melfi 5.80 1520 1140 n.a. 3 Melfi 5.70 480 394 11.5 4 Girifalco (*) 7.50 121 92 4.5 0.9 Girifalco (*) 6.95 196 147 7.2 5.4 Decollatura (*) 5.20 55 39.4 1.2 0.9 Feroleto Antico (*) 7.84 352 266 n.a. 7.5 Ninfa Leggera Calabria Girifalco Moschetta Fonti di Monticchio Fonte della Madonnina Moschetta Fontana della Salute Sorgente S. Chiara Sorbello Feroleto Antico Vitasana Feroleto Antico Futura Dipodi Pianopoli 7.78 297 222 n.a. 1.2 Carlopoli Acqua Leo Leo Carlopoli 6.35 104 79 5.7 9.2 ACQUAPURA S.r.l. Grimaldi Sorgente dell’Amore Fonte di Grimaldi Grimaldi 7.25 511 340 n.a. 4.73 ACQUA SILA S.r.l. Acri SILA S.p.A. MANGIATORELLA S.p.A. (Group Mangiatorella) Parenti IDRO MINERAL BEVERAGE VIVERE E NATURA S.r.l. Cosenza Melfi Brand Quality parameters Fixed Electrical residue at Hardness Nitrates pH Conductivity 180°C [°F] [mg/l] [S/cm] [mg/l] 6.51 439 351 n.a. 1.8 6.25 2530 1956 n.a. n.a. 5.72 1530 1163 n.a. 0.65 Decollatura FONTEVIVA S.r.l. Calabria Spring/Aquifer Acri 7.43 202 120.7 8 5.01 Sorsy Fontenoce Sorgente Serra Policaretto n.a. Noce Acri (*) Parenti n.a. 7.45 n.a. 133 n.a. 105 n.a. 6.1 n.a. 2.8 Stilo Mangiatorella Mangiatorella Stilo 6.07 88 68.4 2.2 0.11 CERTOSA S.r.l. Polia Acqua Certosa Polia 7.50 104 88 n.a. 1.1 FABRIELLA DI G. LA TASSA S.n.c. Fabrizia Fonte Pietre Bianche Passo dell'Abate - Serricella Serricella Fabrizia 6.50 99 74 1.65 5.8 Fabrizia 6.60 100 70 1.8 2.7 FONTE DEL PRINCIPE S.r.l. Mongiana Mongiana (*) n.a. 72.4 71.7 1.4 0.98 Acqua Sila Fabrizia Serricella Fonte del Principe n.a. n.a. is not available information (*) not available information, assigned the same district of the bottling plant XII Bottling plant Macroarea Region Province Agrigento Catania Name CAVAGRANDE S.p.A. (Group Mangiatorella) Messina S.I.B.A.M. S.p.A. South and Islands ACQUASOLESI LA FONTE Palermo TERME DI GERACI SICULO S.p.A. Ragusa Sardegna Cagliari Brand District Santo Stefano Nestle' Vera NESTLE' VERA S.r.l. Quisquina - C.da Fonte S. Margimuto Rosalia REALE S.r.l. Sicilia Spring/Aquifer SI.A.M. SICIL ACQUE MINERALI FONTE S. GIACOMO DI PINNA O. & C. S.n.c. GOLDEN ACQUE S.r.l. IDROTERME VILLASOR S.r.l. Belpasso - C.da Acquarossa Milo - C.da Sciara Alì Superiore C.da Gerasia Montalbano Elicona - C.da Melizzo Palermo Altavilla Milicia C.da Sperone Geraci Siculo C.da Parco Gentile Guspini Villasor S. Rosalia Santo Stefano di Quisquina 7.10 419 263 n.a. 2.4 Belpasso 6.30 1780 1230 n.a. 10.9 Belpasso 6.40 1420 1029 n.a. 16.3 Milo 7.00 285 205 n.a. n.a. Alì 7.56 242 168.4 8.6 0.98 Montalbano Elicona 6.72 205 154.6 9.5 0.8 n.a. n.a. 43 n.a. n.a. Altavilla Milicia (*) 7.61 n.a. 610.7 n.a. n.a. Gerasia Gerasìa Fontalba Fontalba Solesi n.a. Mìlicia Fastuchera Federica Fonte S. Giacomo Fonte Linas Sattai Giara Sandalia Levia SARDA ACQUE MINERALI S.p.A. (Group S.A.M.) District Sorgente dell'Etna Sorgente Hidria dell'Etna Sorgente Cavagrande naturale dell'Etna Ruscella Modica - Loc. S. Maria Zappulla Santa Maria Villasor Name Acquarossa Geraci Siliqua Pura S. Angelo Quality parameters Fixed Electrical residue at Hardness Nitrates pH Conductivity 180°C [°F] [mg/l] [S/cm] [mg/l] Sorgenti Piano Lungo e FegottiCastagneto Ruscella Santa Maria Zappulla Palermo (*) Geraci Siculo 6.40 81 60 n.a. 1.3 Modica (*) 7.14 680 445 n.a. n.a. Modica (*) 7.06 513 383 n.a. n.a. S. Giacomo Villasor 7.60 447 271 n.a. 7.2 Linas Sattai Giara S'Acqua Cotta Antiche Fonti di Zinnigas Antiche Fonti di Zinnigas Antiche Fonti di Zinnigas Guspini Guspini Villasor Villasor 7.60 6.27 7.51 7.52 400 397 356 2100 260 283.6 228.6 1463.2 n.a. 8.4 n.a. n.a. n.a. 15.5 24.7 n.a. Siliqua 6.80 393 262 n.a. 0.6 Siliqua 7.20 411 252 n.a. 2.4 Siliqua 7.00 438 265 n.a. 0.7 n.a. is not available information (*) not available information, assigned the same district of the bottling plant XIII Bottling plant Macroarea Region Province South and Islands Cagliari Oristano Sardegna Otranto Name SARDA ACQUE MINERALI S.p.A. (Group S.A.M.) FONTI DI SAN LEONARDO DE SIETE FUENTES S.p.A. (Group S.A.M.) G.A.M. S.r.l. ACQUA MINERALE S. LUCIA A.L.B. S.p.A. Sassari SAN MARTINO S.r.l. SAN PANTALEO S.r.l. Spring/Aquifer Brand District S. Giorgio Siliqua Quercetta Santulussurgiu Altura Bonorva S. Lucia Olbia Antiche Fonti di Zinnigas Antiche Fonti di Zinnigas Siete Fuentes San Leonardo De di San Siete Fuentes Leonardo Bortigiadas Tempio Pausania Codrongianos Name S. Lucia Sorgenti Monti di Deu San Martino San Martino Alisea Fonte Fonte dei Graniti Dei Graniti Rocce Sarde Fonti di Beddoro Smeraldina San Pantaleo Fonti di Beddoro District Quality parameters Fixed Electrical residue at Hardness Nitrates pH Conductivity 180°C [°F] [mg/l] [S/cm] [mg/l] Siliqua 6.90 497 278 n.a. 0.5 Siliqua 6.86 486 279 n.a. 0.65 Santulussurgiu 7.60 166.6 129.9 n.a. 6.2 Bortigiadas n.a. n.a. n.a. n.a. n.a. Bonorva 7.10 1589 1290.8 n.a. 1.78 Tempio Pausania 6.14 205 133 n.a. n.a. Codrongianos 6.62 3300 2808.2 n.a. 3.12 Olbia 7.09 452 302 n.a. 1.15 Olbia 7.49 681 436.8 n.a. 0.29 Olbia 7.49 681 436.8 n.a. 0.29 n.a. is not available information (*) not available information, assigned the same district of the bottling plant [sources: Yearbook Bevitalia Beverfood.com 2012-2013; www.acqueitaliane.fondazioneamga.org; www.acqua2o.it; web sites of bottling plants] XIV
Scaricare