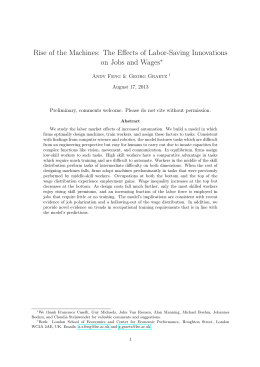
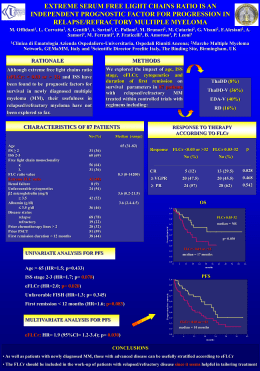
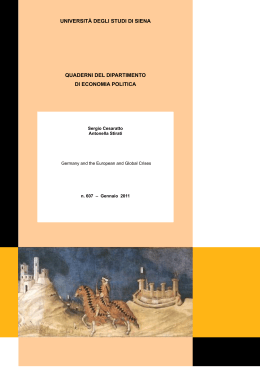
SAGGIO AD INVITO
Gender and the Labour Market:
An International Perspective
and the Case of Italy
Claudia Olivetti*
Boston University and NBER
This paper provides an overview of the literature on
international differences in the gender wage gap. It then focuses on
the Italian case and analyzes differentials in gender wage and
employment gaps across regions. The cross-regional variation
reproduces the negative correlation between gender wage and
employment gaps observed at the cross-country level. Using the
methodology in Olivetti and Petrongolo (2008), the paper shows
the importance of regional differentials in sample selection induced
by non-employment in accounting for this phenomenon. [JEL
Classification: E24, J16, J31]
In questo contributo si presenta una rassegna delle ricerche
comparate a livello internazionale sul divario salariale di genere.
Si studia poi il caso dell’Italia analizzandone le differenze regionali
fra divari occupazionali e retributivi di genere. La variazione a
livello regionale riproduce la correlazione negativa fra le due
variabili che si osserva a livello internazionale. Utilizzando la
metodologia di Olivetti e Petrongolo (2008), il saggio mostra
l’importanza delle differenze regionali nel processo di selezione alla
forza lavoro, che possono spiegare questo fenomeno.
Keywords: gender gaps, employment, wages, sample selection.
1. - Introduction1
Women have made important advances in labour markets.
Their employment rates in OECD countries have been steadily
increasing since the post-war period, and their pay gap with
* <[email protected]>.
1
Section 4 in the paper is based on OLIVETTI C. and PETRONGOLO B. (2008).
3
RIVISTA
DI
POLITICA ECONOMICA
MAGGIO-GIUGNO 2008
respect to men has fallen. Also, the distinctions between the
activities of single and married women are not as sharp as they
used to be, and ambition to do well in a job is no longer restricted
to men. However, there are some important gender inequalities
still remaining in labour markets. Most importantly, convergence
in women’s employment and pay levels with respect to men is far
from complete, and the remaining gaps cannot be completely
explained by differences in observable characteristics such as
education or labour market experience. This evidence suggests
that, a few decades after the introduction of Equal Pay and Equal
Employment Opportunity legislation in most European countries
and the US, there is still potential underutilization of women’s
skills in the labour market.
The study of the gender wage gap has attracted considerable
attention among economists.
Studies of the gender wage gap and its evolution emphasize
the importance of gender differences in human capital (education
and experience), and in the occupational structure by gender. The
residual wage gap, which is left unexplained after accounting for
differences in observed characteristics of men and women, is
typically attributed to discrimination in the labour market. In
addition, a number of authors have discussed the link between
the gender wage gap and aggregate changes in wage inequality
and in industry composition during the 1980s and 1990s (see
Altonji and Blank, 1999, for an extensive review, and references
therein).
Despite the richness of this literature, there are only a small
number of cross-country studies of the gender wage gap. Up to the
early 1990s this was partly due to the absence of a fully comparable
cross-sectional data set on the employment and earnings of men
and women. However, recent studies by Blau and Kahn (1996,
2003) and OECD (2002) use comparable cross-country data to
study the effects of differences in the wage structure on the
corresponding gender wage gap. The idea behind the link between
the wage structure and the gender wage gap is that a given level
of dissimilarities between the characteristics of working men and
women translates into a higher gender wage gap the higher the
4
C. OLIVETTI
Gender and the Labour Market: An International, etc.
overall level of wage inequality. This explanation is particularly
well-suited to the comparison of Anglo-Saxon and Scandinavian
countries as inequality is much higher in the former set of
economies. However, the inequality-adjusted wage gap in southern
Europe remains substantially lower than in the rest of Europe and
in the US.
More recently, Olivetti and Petrongolo (2008) argue that,
besides differences in wage inequality and therefore in the returns
associated to characteristics of working men and women, a
significant portion of the international variation in gender wage
gaps may be explained by differences in characteristics themselves,
whether observed or unobserved. The idea is that if women who
are employed tend to have relatively high-wage characteristics, low
female employment rates translate into low gender wage gaps
simply because it is mostly high-wage women who feature in the
observed wage distribution. This explanation is particularly wellsuited to the comparison of Anglo-Saxon and southern European
countries as female employment rates are much higher in the
former set of economies. Interestingly, previous work emphasizing
the importance of selection mostly focused on the US (see Neal,
2004, Blau and Kahn, 2006, and Mulligan and Rubinstein, 2008).
No previous study had used data for southern European countries,
where employment rates of women are lowest, and thus the
selection issue should be most relevant.
In this paper we first provide an overview of the literature on
international differences in the gender wage gap. We then analyze
the case of Italy by exploring the cross-regional variation in gender
employment and wage gaps using the same methodology as in
Olivetti and Petrongolo (2008). This methodology is particularly
relevant for this country because Italy displays the lowest female
employment rate among OECD economies as well as one of the
lowest gender pay gaps (see Table 1). Yet, as we will see in Section
4, the role of sample selection tends to be quantitatively less
significant in Italy than in other southern European economies,
with equally low female employment rates (and equally high
employment gender gaps). Why is it the case? We find that, similar
to other socio-economic variables, the aggregate statistics hide a
5
RIVISTA
DI
POLITICA ECONOMICA
MAGGIO-GIUGNO 2008
TABLE 1
GENDER EARNINGS RATIOS AND FEMALE
EMPLOYMENT RATES, 2000 (%)
Female/Male Ratio
Mean Hourly Earnings
Female
Employment Rate
Anglo-Saxon
Canada
UK
USA
83.4
78.9
77.6
70.4
68.9
70.7
Scandinavia
Denmark
Finland
Norway
Sweden
87.5
85.4
92.5
91.9
75.9
72.1
76.5
76.4
Mediterranean
Greece
Italy
Spain
87.5
95.2
85.9
49.7
46.3
52.9
Rest of Europe
Austria
Belgium
France
Germany
Ireland
Netherlands
Portugal
79.4
88.0
88.5
79.5
86.5
80.4
90.5
61.8
56.6
61.7
63.3
55.7
65.3
63.8
Notes: Statistics for 16-64 years old age group. Data sources. Gender Earnings
Ratios: ECHPS, US and Canadian Census of Population, Statistics Norway and
Statistics Sweden web pages. The gap is computed as the female/male ratio of
mean hourly earnings for all wage and salaried workers. The samples exclude the
self-employed, the military and those in full-time education. Female Employment
Rates: OECD Stat web page.
strong regional variation in gender employment and wage gaps —
with Emilia Romagna resembling Scandinavian economies,
Lombardia and the other regions of the Nord Ovest resembling
France and Belgium and southern Italy resembling Greece and
Spain. The econometric analysis shows that selection-adjusted
wage gaps are higher than actual wage gaps in most cases.
However, this difference is small in the northern Italian regions
6
C. OLIVETTI
Gender and the Labour Market: An International, etc.
and becomes sizeable for central and southern regions. That is,
the reason for the higher actual wage gaps in the north than in
the center and the south is mainly due to a different process of
selection into employment. Female participation rates in the south
are low and concentrated among high-wage women. Having
corrected for lower participation rates, the wage gap there widens
and, in some cases, becomes higher than that of the northern
Italian regions. Depending on the specification, selection
correction can explain from 10 percent to most of the observed
negative cross-regional correlation between wage and employment
gaps across genders in Italy.
The rest of the paper is organized as follows. Section 2
analyzes cross-country differences in the gender wage gap for the
countries in our sample. Section 3 discusses the existing literature
on the role played by cross-country differences in the wage
structure and country-specific institutions in explaining the crosscountry variation in gender wage gaps. In Section 4 we turn to a
discussion of how the issue of sample selection may be affecting
cross-country comparisons of the gender wage gap. In Section 5
we conclude with a discussion of the potential role of employment
selection in explaining differences in the gender wage gap across
Italian regions.
2. - Cross-Country Evidence on Gender Gaps
There are substantial differences in the gender wage gap
across countries. Column 1 in Table 1 presents 2000 data on the
female/male hourly earnings ratio for all employees.2 Women’s
hourly earnings are lower than men’s in all countries. On average,
women earn 86 percent of what mean earn. The gender gap is
smallest (less than 10 percent) in Italy, Portugal, Norway and
Sweden, and it ranges between 10 and 15 percent in Greece, Spain,
Belgium, France, Ireland and the other Scandinavian countries.
2
Here we abstract from cross-country differences in flexible work
arrangements, such as part-time work and its associated wage penalty. See
PETRONGOLO B. (2004) for a detailed analysis of this issue.
7
RIVISTA
DI
POLITICA ECONOMICA
MAGGIO-GIUGNO 2008
The gender gap is largest (around 20 percent) in the United States,
the United Kingdom, Austria, Germany and the Netherlands. Note
that some of the countries with the lowest gender gaps are
characterized by the lowest female employment rate (see column
2 in Table 1). We will come back to this observation in Section 4.
Next, in Table 2 we report the female/male hourly earnings ratio
by age groups. As shown in the table with the exception of Denmark,
Italy, Spain, Austria, Germany and Portugal, the hourly female/male
wage ratio is around 10 percentage points higher for younger women
than for older women. Both age and cohort effects are at work here.
First, young women tend to be more similar to young men in terms
TABLE 2
GENDER EARNINGS RATIOS BY AGE, 2000
25-34
35-44
45-54
Anglo-Saxon
Canada
UK
USA
88.6
87.1
82.9
80.3
73.2
72.7
74.8
71.0
67.4
Scandinavia
Denmark
Finland
91.6
91.9
93.1
82.1
88.3
80.4
Mediterranean
Greece
Italy
Spain
96.0
98.2
88.6
93.0
97.7
86.3
81.0
98.0
85.2
Rest of Europe
Austria
Belgium
France
Germany
Ireland
Netherlands
Portugal
79.9
93.5
94.1
84.6
98.1
99.3
80.3
80.5
97.1
88.9
78.1
86.0
81.6
83.4
77.6
86.8
81.7
79.9
68.6
75.6
82.0
Notes: Author’s calculations based on ECHPS data for European countries, CPS,
Demographic Files for the US and Census data for Canada. The gap is computed
as the female/male ratio of median hourly earnings for all wage and salaried
workers. The sample excludes the self-employed, the military and those in fulltime education.
8
C. OLIVETTI
Gender and the Labour Market: An International, etc.
of accumulated labour market experience. Second, for the recent
generations, the education gap has narrowed substantially.3
Finally, we turn to the analysis of how the gender wage gap
has evolved between 1986 and 2000. Table 3 presents data on the
growth of the female/male (median) earnings ratio for the subset
of countries for which longer time series data are available. The
female/male earnings ratio has been increasing in most of the
countries in our sample since the early 1980s. The largest increase
(around 2 percent per year) has occurred in Canada, Italy and the
Netherlands followed by the US and the UK (where the ratio
increased by approximately 1 percent per year). The wage gap was
essentially constant in Finland and Sweden and increased only
slightly in France and Germany. This is an interesting result because
TABLE 3
EVOLUTION OF GENDER EARNINGS RATIOS
1986
2000
Average Yearly
Growth 1986-2000
(%)
Anglo-Saxon
Canada
UK
USA
65.2
66.5
67.8
85.4
76.4
76.0
1.95
1.00
0.82
Scandinavia
Sweden
Finland
83.2
77.5
84.5
79.6
0.11
0.19
Mediterranean
Italy*
70.1
83.3
1.74
Rest of Europe
France
Germany
Netherlands
83.6
71.0
67.0
87.6
77.0
78.6
0.33
0.58
1.15
Notes: Female/Male Median Earnings Ratio for Full-time, Year-round workers. Data
source: OECD Earnings Database.
*For Italy the latest year available is 1996.
3
See DEL BOCA D. et.
J.F. (2002).
AL.
(2005) and DOLADO J.J., FELGUEROSO F. and JIMENO
9
RIVISTA
DI
POLITICA ECONOMICA
MAGGIO-GIUGNO 2008
both the strong decline in the gender wage gap in the United States,
and the stagnation in Scandinavia, occurred at a time of rising wage
inequality in the United States that by itself would tend to increase
the gender wage gap. It follows that while US women improved
their position in the earnings distribution relative to men, so as to
offset the effects of the general increase in inequality, women in
Sweden and Finland (and, to a lesser extent in France and
Germany) might have seen a worsening of their relative position.4
However, despite the increase in the female-male earnings
ratio during the 1990s, the US gender ratio in 2000 is still below
its level in Italy — where the gender gap in employment is almost
three times as large as in the United States (see Graph1) — and
Scandinavia — where the job segregation index is much larger
GRAPH 1
GENDER GAPS ACROSS OECD COUNTRIES, 1999
(Coefficient of correlation: –0.474*)
40
mean (log) wage gap (%)
USA
30
UK
Netherland
Austria
Germany
20
Ireland
Finland
Denmark
France
Belgium
10
Spain
Portugal
Greece
Italy
0
10
20
30
40
50
employment gap (%)
4
See BLAU F.D. and KAHN L.M. (1997); GUPTA N.D., OAXACA R.L. and SMITH N.
(2002); EDIN P.A. and RICHARDSON K. (2002) and OECD, Employment Outlook (2002)
for a discussion.
10
C. OLIVETTI
Gender and the Labour Market: An International, etc.
than in the United States. The next two sections discuss work by
Blau and Kahn (1996, 2003), the OECD (2002) and Olivetti and
Petrongolo (2008) which aims at reconciling these facts.
3. - Inequality and Institutions
The evidence presented in the previous section shows that
although US women perform quite well in terms of human capital
and occupational structure relative to their European
counterparts, they face a much larger wage penalty relative to
men. In this section we discuss the role of differences in wage
compression and in the institutional setting of countries in
explaining the observed cross-country patterns.
3.1 Income Inequality
Blau and Kahn (1996) highlight the importance of country
differences in the overall wage structure in accounting for crosscountry differences in the gender wage gap. Their argument is that
since women tend to be more concentrated at the bottom of the
wage distribution relative to men, due to poorer characteristics,
institutions that compress the wage distribution, such as
minimum wage legislation and highly centralized wage-setting,
will also tend to decrease the gender wage gap.
In their 1996 study, Blau and Kahn use 1985-1989
International Social Survey Program (ISSP) data for 10 countries,
supplemented by country-specific micro data sets for Italy,
Sweden, and the United States, to analyze the importance of the
overall wage structure in explaining cross-country differences in
the gender wage gap. In particular, they study the reasons
underlying the lower ranking of US women relative to their
European counterparts on this dimension.
Blau and Kahn adapt the Juhn, Murphy and Pierce (1991)
decomposition originally used to study wage differentials across
demographic groups. The results obtained for this subset of
11
RIVISTA
DI
POLITICA ECONOMICA
MAGGIO-GIUGNO 2008
countries show that US women perform better than their
counterparts along the human capital dimension (except for
Australia and Sweden). However, the US level of inequality in the
wage structure makes their relative position worse. Wage
inequality accounts for almost all the higher US pay gap relative
to all countries except Sweden, where it accounts for 74 percent
of the gap. The authors also analyze the relationship between
cross-country differences in wage setting institutions, male wage
inequality, and the wage gap and find some suggestive (although
weak) evidence that supports their conjecture.
In a more recent paper Blau and Kahn (2003) use 1984-1994
ISSP data to test their hypothesis for a larger set of countries. In
this paper they use a slightly different methodology to compare gaps
across countries. They allow for the price of observable
characteristics to differ across countries and across genders but use
the observed characteristics of men and women in the United States
as the benchmark. Moreover, they also include in the analysis
measures of the net supply of labour by women across countries.
In this case, they find stronger evidence that the variation in the
gender wage gap across countries may be attributed to differences
in the degree of inequality in the earnings distribution. They also
show that, controlling for differences in the wage structure, the
wage differential tends to be lower when the female supply of labour
is lower with respect to its demand. This result is robust to the
inclusion of institutional variables, collective bargaining, parental
leave policies, unemployment insurance and employment
protection. This evidence confirms that, to the extent that labour
market institutions are an important component in explaining the
degree of overall wage inequality, differences in labour market
institutions can account for differences in the gender wage gap.5
A similar analysis is conducted in the 2002 OECD Employment
Outlook for the EU-12 countries surveyed by the European
Community Household Panel Survey (ECHPS). The OECD study
5
For example, they found that if collective bargaining coverage were to
increase from 47 per cent to 82 per cent the gender wage gap would fall by about
10 per cent. Higher collective bargaining is known to compress the overall wage
structure and so reduce inequality along all dimensions.
12
C. OLIVETTI
Gender and the Labour Market: An International, etc.
uses the same decomposition method as in Blau and Kahn (1996)
and considers an average of the 12 ECHPS countries as the
benchmark economy. The results of this decomposition analysis
show that the unadjusted wage gap would change in each country
if its wage structure were similar to that of the benchmark economy.
In particular, the gender wage gap in the UK would be reduced by
between 2 and 4 percentage points under the benchmark (more
compressed) wage structure.
In contrast, the adjusted wage gap would increase in the
Netherlands as a consequence of women’s higher concentration in
lower-paid occupational groups. The adjustment can explain (almost
fully) the lower gender wage gaps in Denmark and Finland than in
the benchmark economy. However, it cannot explain (almost any
of) the difference in gender gaps for Italy, Spain, France, Germany
and other central European economies. For these countries, the
inequality-adjusted gender wage gaps are fairly similar to those
computed using the country-specific wage distribution.
These studies emphasize the importance of differences in
wage compression in accounting for the lower gender wage gaps
in most European countries than in the US or the UK with the
strongest, more robust, results obtained when comparing the US
to Sweden or Finland. This emphasis seems reasonable since all
widely used indexes of wage dispersion unanimously predict
higher inequality in the US than in European countries. However,
as employment levels — not just wage distributions — vary
substantially across the Atlantic, measures of wage dispersion may
not be informative enough, especially in some countries, and both
prices and quantities in the labor market need to be taken into
account in order to evaluate gender inequalities across countries.
This is the contribution of the paper by Olivetti and
Petrongolo (2008) which we will discuss in Section 4.
3.2 Institutions
We next present evidence on the role of differences in a number
of institutions, namely employment protection legislation, parental
13
RIVISTA
DI
POLITICA ECONOMICA
MAGGIO-GIUGNO 2008
leave policies, and product market regulation, in explaining the
observed cross-country differences in the gender wage gap. Besides
affecting overall wage dispersion, some institutions may have an
effect per se on the level of the wage gap in a country, over and
above the role played by wage dispersion. This discussion
summarizes findings reported in Pissarides, Garibaldi, Olivetti,
Petrongolo and Wasmer (2005).
They find that more generous measures of the unemployment
insurance system and measures of employment protection for
temporary jobs both tend to decrease gender wage gaps. However,
these effects disappear once they control for the degree of product
market regulation. It is also interesting to discuss how their results
vary by age groups. For the group of 35 to 44 year old women
they find that, consistent with Blau and Kahn (2003), larger
bargaining coverage decreases the gender gap in wages. However,
this is not the case for younger women (25 to 34). In this case, a
larger degree of bargaining coverage tends to increase the gap.
Stricter EPL for regular contracts has the same effect. This is
consistent with the story that these institutions, designed to
protect the “insiders” in the labour market, have a larger negative
impact on the employment and pay opportunities of the young.
The results suggest that the negative effect is larger for young
women than for young men. Also, for this age group, they find
that stricter EPL for temporary contracts and a larger UI benefit
replacement ratio both tend to decrease the gap. Finally, for
women 35 to 44 year old, more generous parental leave
entitlements tend to significantly increase the gender wage gap.
This finding is consistent with the evidence provided by Ruhm
(1998) and Del Boca and Pasqua (2005) who shows that parental
leave is associated with higher overall female employment but
with reductions in the female/male wage ratio. These results are
obtained on a relatively small set of countries, and should thus
be interpreted as suggestive evidence of relevant associations
rather than firm conclusions.
In order to ease this concern, Pissarides et al. (2005) also use
a variety of data sources to construct a data set of repeated crosscountry observations. This analysis confirms some of the previous
14
C. OLIVETTI
Gender and the Labour Market: An International, etc.
results. They find that union bargaining coverage tends to decrease
the gender wage gap.
This is consistent with the argument put forth by Blau and
Kahn (2003) that, since women tend to be more concentrated at
the bottom of the wage distribution relative to men, institutions
that compress the wage distribution will also tend to decrease the
gender wage gap. They also find that more generous parental leave
policies tend to significantly increase the wage gap (although this
effect disappears when country fixed effects are included in their
regressions). Finally, they find that none of these institutions has
a significant impact on cross-country differences in the gender
wage gap once they control for the occupational distribution by
gender. So again it seems that while a number of institutions have
the expected relationship with the gender wage gap, their role is
substantially diminished once relative characteristics of working
men and women are taken into account. The next section explores
the importance of cross-country differences in selection along
wage characteristics in explaining the observed international
variation in gender pay gaps.
4. - Selection
An alternative view on the cross-country variation in the
gender wage gap investigates the role of different selection pattern
of women into employment across countries, with the consequent
differences in the composition of employment. This view,
developed by Olivetti and Petrongolo (2008) (henceforth OP), is
supported by the striking international variation in gender and
employment gaps. As shown in Graph 1 these two statistics are
negatively correlated across countries. Gender pay gaps range
from about 30 percentage points in the US and the UK, to 10-20
percentage points in central and northern Europe, down to 10
percentage points or less in Scandinavia and southern Europe.
Interestingly, countries with very high wage gaps tend to have low
employment gaps and vice versa, with the exception of
Scandinavian countries were both employment and wage gaps are
15
RIVISTA
DI
POLITICA ECONOMICA
MAGGIO-GIUGNO 2008
low. Variation in employment gaps is mostly driven by variation
in female employment rates (from 40-50 percent in southern
Europe, to 75-85 percent in the UK, the US and Scandinavia). If
women’s selection into employment is non-random, one needs to
worry about the way in which selection may affect the resulting
gender wage gap. In particular, if women who are employed tend
to have relatively high-wage characteristics, low female
employment rates may become consistent with low gender wage
gaps simply because low-wage women would not feature in the
observed wage distribution. This idea could thus be well suited to
explain the negative correlation between gender wage and
employment gap that is observed in the data.
This view is explored by estimating selection-corrected wage
gaps. The main goal is to recover the counterfactual wage
distribution that would prevail in the absence of non-random
selection into work — or at least some of its characteristics. In
order to do this, OP recover information on wages for those not
in work in a given year using alternative imputation techniques.
This approach is closely related to that of Johnson, Kitamura and
Neal (2000) and Neal (2004), and simply requires assumptions on
the position of the imputed wage observations with respect to the
median. The attractive feature of median regressions is that, if
missing wage observations fall completely on one or the other
side of the median regression line, the results would only be
affected by the position of wage observations with respect to the
median. Importantly, it does not require assumptions on the
actual level of missing wages, as typically required in the
matching approach, nor it requires arbitrary exclusion restrictions
often invoked in two-stage Heckman sample selection correction
models.6
More formally, let w denote the natural logarithm of hourly
wages and F(w⎢g) the cumulative log wage distribution for each
gender, where g = 1 denotes males, and g = 0 denotes females.
The variable of interest is the difference between (log) male and
female median wages:
6
See OLIVETTI C. and PETRONGOLO B. (2008) for a discussion of alternative
sample selection methodologies and imputation rules.
16
C. OLIVETTI
Gender and the Labour Market: An International, etc.
(1)
D = m(w⎢g = 1) – m(w⎢g = 0)
where m() is the median function. The (log) wage distribution for
each gender is defined by:
(2)
F (w⎢g) = F (w⎢g; I = 1) Pr(I = 1⎢g) +
+ F (w⎢g; I = 0) [1 – Pr(I = 1⎢g)]
where I = 1 for the employed and I = 0 for the non-employed.
Estimated moments of the observed wage distribution are
based on the F (w⎢g; I = 1) term alone. If there are systematic
differences between F (w⎢g; I = 1) and F (w⎢g; I = 0), cross-country
variation in Pr(I = 1⎢g) may translate into misleading inferences
concerning the international variation in the distribution of
potential wage offers. This problem typically affects estimates of
female wage offer distributions; even more so when one is
interested in cross-country comparisons of gender wage gaps,
given the cross-country variation in Pr(I = 1⎢g = male) – Pr(I =
1⎢g = female), measuring the gender employment gap. But F (w⎢g),
the term of interest, is not identified, because data provide
information on F (w⎢g; I = 1) and Pr(I = 1⎢g), but clearly not on
F (w⎢g; I = 0) ; as wages are only observed for those who are in
work.
In particular, using (2), the median log wage for each gender,
m, is defined by
(3)
F (m⎢g; I = 1) Pr(I = 1⎢g) +
+ F (m⎢g; I = 0) [1 – Pr(I = 1⎢g)] = 1
–
2
The goal of this methodology is to retrieve gender gaps in
median (potential) wages, as illustrated in equation (1), with
gender medians defined in equation (3). This amounts to
retrieving information on F (m⎢g; I = 0), representing the
probability that non-employed individuals have potential wages
below the median.
OP use panel data sets for the US (the Panel Study of Income
Dynamics, PSID) and for European countries (ECHPS) for the
17
RIVISTA
DI
POLITICA ECONOMICA
MAGGIO-GIUGNO 2008
period 1994-2001 to estimate median wage gaps under alternative
imputation rules, i.e. under alternative conjectures over F (m⎢g;
I = 0). The impact of selection into work is assessed by comparing
estimated wage gaps on the sample of employed workers with
those obtained on the samples enlarged with wage imputation for
the non-employed, in which selection issues are alleviated.
Imputation is performed in several ways. First, they exploit
the panel nature of the data sets available, and for all those not
in work in some base year, search backward and forward to
recover hourly wage observations from the nearest wave in the
sample. The underlying identifying assumption is that, for a given
individual i, the latent wage position with respect to her predicted
(gender-specific) median when she is non-employed can be proxied
by her wage in the nearest wave in which she is employed. That
is, they assume that
(4)
F(m⎢gi; Iit = 0) = F(m⎢gi; Iit′ = 1)
where t is the base year, and t′ is the wave nearest to t in which
a non-missing wage observation is available. As the position with
respect to the median is determined using alternative information
on wages, as opposed to measured characteristics, this imputation
rule amounts to allowing for selection on unobservables.
This procedure of imputation makes sense if an individual’s
position in the wage distribution stays on the same side of the
median when switching employment status. While imputation
based on this procedure arguably uses the minimum set of
potentially arbitrary assumptions, it has the disadvantage of not
providing any wage information on individuals who never worked
during the sample period. In order to recover wage observations
also for those never observed in work, OP use observable
characteristics of the non-employed, such as (un)employment
status, education and experience, to make educated guesses
concerning their position with respect to the median.
This amounts to allowing for selection on observable
characteristics only, assuming that the non-employed would earn
wages “similar” to the wages of the employed with matching
18
C. OLIVETTI
Gender and the Labour Market: An International, etc.
characteristics, where “similar” means on the same side of the
base-year, gender-specific median. Formally this can be illustrated
with a simple example. Suppose that we assume that people who
are looking for a job tend to have worst characteristics than those
who are employed. Under this assumption the information on the
unemployment status of individuals with missing wages is used
to place them below their (gender-specific) median. More formally,
this amounts to assuming
(5)
F(m⎢gi; Ii = 0; ui = 1) = 1
where ui = 1 if the individual is unemployed.7 Having done this,
earlier or later wage observations for those with imputed wages
in the base year can shed light on the goodness of this imputation
method.8
Table 4 presents a subset of results from the paper. Column
1 reports the actual wage gap for reference: this is the median
wage gaps for individuals with an hourly wage in 1999, which is
the base year. Wage gaps of column 1 replicate very closely those
plotted in Graph 1, with the only difference that Graph 1 plotted
mean as opposed to median wage gaps.9 As in Graph 1, the US
and the UK stand out as the countries with the highest wage gaps,
followed by central Europe, and finally Scandinavia and southern
Europe.
In column 2 (selection on unobservables) missing wage
observations in 1999 are replaced with the real value of the nearest
wage observation in the whole sample period, meaning a window
of [–5, +2] years. Moving across from column 1 to column 2,
gender wage gaps tend to increase as more wage observations are
included into the imputed sample. This is indicative of positive
7
All variables in (5) refer to the (same) base year, so time subscripts are
omitted.
8
See OP for results on goodness of the alternative imputation method and
additional analysis. This includes using probability models for assigning individuals
on either side of the median of the distribution of wages and estimating bounds
to the distribution of wages (MANSKI C.F., 1994).
9
Since this approach is based on the recovery of selection-corrected median
wage gaps, the absence of any important difference between mean and median
wage gaps on the observed wage distribution is quite reassuring.
19
RIVISTA
DI
POLITICA ECONOMICA
MAGGIO-GIUGNO 2008
TABLE 4
GENDER WAGE GAPS ACROSS IMPUTATION RULES:
OECD COUNTRIES
1
2
3
4
Base sample
Imputation on
unobservables
Imputation on
observables
Imputation on
observables
Wages imputed
from other
waves (–5, +2
window)
Educated guess: Educated guess:
low wage
low (high) wage
imputed
imputed if
if unemployed education < upper
sec. (> = higher
educ.) &
experience < 10
(> = 10) yrs
US
UK
Finland
Denmark
Germany
Netherlands
Belgium
Austria
Ireland
France
Italy
Spain
Portugal
Greece
0.339
0.256
0.160
0.086
0.191
0.178
0.078
0.192
0.232
0.095
0.059
0.097
0.150
0.111
0.361
0.284
0.197
0.100
0.214
0.199
0.112
0.234
0.284
0.152
0.075
0.168
0.186
0.184
0.335
0.238
0.179
0.1
0.214
0.246
0.113
0.21
0.213
0.134
0.092
0.182
0.188
0.175
0.348
0.253
0.16
0.092
0.196
0.189
0.084
0.208
0.241
0.102
0.088
0.109
0.162
0.16
Correlation
–0.329*
–0.181
0.435
–0.200
Notes: Columns 1-2 (3-4) reproduce the same columns from Table 2 (Table 3) in
OLIVETTI C. and PETRONGOLO B. (2008). All median wage gaps are significant at the
1% level. Figures in the last row display the cross-country correlation between the
reported gender wage gap and the gender employment gap (* significant at the
10% level). Sample: aged 25-54, excluding the self-employed, the military and those
in full-time education, 1999. Source: PSID and ECHPS.
sample selection, or, in other words, estimated wage gaps on the
observed wage distribution are downward biased due to nonrandom sample selection into employment because low-wage
women are less likely to feature in the observed wage distribution.
But there is important cross-country variation in the role of
20
C. OLIVETTI
Gender and the Labour Market: An International, etc.
selection. In particular, one can see that the median wage gap
remains substantially unaffected or marginally affected in the US,
the UK, Scandinavia, Germany and the Netherlands; it increases
by around 25 percent in Austria, Ireland, Italy and Portugal; by
40 percent in Belgium; and by more than 60 percent in France,
Spain and Greece. As expected, gender wage gaps tend to respond
more strongly to selection correction in countries with high
employment gaps. This can be clearly grasped by looking at the
cross-country correlation between employment and wage gaps. In
column 1 such correlation is –0.329, and it falls by 45 percent in
column 3. Employment selection thus explains nearly a half of the
observed correlation between wage and employment gaps. Note
that this imputation method is relatively more conservative in
assessing the effect of non-random employment selection in
southern Europe than elsewhere.
This is because (non)employment status tends to be relatively
more persistent in southern Europe than elsewhere, and much
more so for women than for men. Thus one can recover relatively
fewer less-attached women in these countries.
In column 3 OP impute a wage below the median to all those
who are unemployed (as opposed to non participants) in 1999.
The unemployed by definition are receiving wage offers (if any)
below their reservation wage, while the employed have received
at least one wage offer above their reservation wage. At constant
reservation wages, the unemployed have lower potential wages
than the observed wages of the employed, and are thus assigned
an imputed wage value below the median. This imputation leaves
the median wage gap roughly unchanged with respect to the base
sample in the US, the UK, Scandinavia, Germany, Austria and
Ireland, and raises it substantially elsewhere, especially in
southern Europe. Selection now explains 64 percent of the
correlation between wage and employment gaps.
In column 4 they follow standard human capital theory and
assume that all those with less than upper secondary education
and less than 10 years of labor market experience have wage
observations below the median for their gender. Those with at
least higher education and at least 10 years of labor market
21
RIVISTA
DI
POLITICA ECONOMICA
MAGGIO-GIUGNO 2008
experience are instead placed above the median. In the four
southern European countries the gender wage gap increases
enormously with respect to the actual wage gap of column 1, and
as a consequence the correlation with employment gaps turns
positive.
To broadly summarize these findings, one could note that
whether one corrects for selection on unobservables (Column 2)
or on observables (Columns 3 and 4), the results are qualitatively
consistent in identifying a clear role of sample selection in
countries with high employment gaps, and especially France and
southern Europe. Quantitatively, the correction for sample
selection is smallest when wage imputation is performed using
wage observation from other waves in the panel, and increases
when it is instead performed using observed characteristics of
the non-employed. As argued in OP, this is mainly due to
different sizes of the imputed samples. While only individuals
with some degree of labor market attachment feature in the
imputed wage distribution in the first case, the use of observed
characteristics may in principle allow wage imputation for the
whole population, thus including individuals with no labor
market attachment at all.
5. - The Case of Italy
The results in OP show that, while the raw wage gap is much
higher in Anglo-Saxon countries than in southern Europe, the
reason is probably not to be found in more equal pay treatment
for women in the latter group of countries, but mainly in a
different process of selection into employment. Female
participation rates in Italy and the other Mediterranean countries
are low and concentrated among high-wage women. In this section
we use the same methodology, and data, as in the previous section
to analyze the case of Italy. The ECHPS classifies Italian regions
in 11 groups — that is, disaggregate information is only available
for the following “regions”: Nord Ovest, Lombardia, Nord Est,
Emilia-Romagna, Centro, Lazio, Abruzzo-Molise, Campania, Sud,
22
C. OLIVETTI
Gender and the Labour Market: An International, etc.
Sicilia and Sardegna (in Italian in the ECHPS data set and
codebook).10
Graph 2 plots raw gender gaps in log gross hourly wages and
employment rates for these regions. All estimates refer to 1999
which, for ease of comparison, will also be the base year in this
analysis. We find that, consistent with our cross-country analysis,
gender wage and employment gaps display a negative correlation
across regions of Italy. Graph 2 seems to “reproduce” Graph 1 at
a lower level of disaggregation.
At the risk of some oversimplification, one can classify regions
in three broad categories according to their levels of gender
employment gap and compare them to the countries in Graph 1.
GRAPH 2
GENDER GAPS ACROSS ITALIAN REGIONS, 1999
(Coefficient of correlation: –0.615**)
20
mean (log) wage gap (%)
Emilia-Romagna
Lombardia
Sardegna
Nord Ovest
10
Nord Est
Abruzzo-Molise
Lazio
Centro
Campania
Sud
0
–10
Sicilia
15
20
25
30
35
40
employment gap (%)
10
“Nord Ovest” includes Trentino Alto Adige, Friuli Venezia Giulia and Veneto,
“Nord Est” aggregates Valle d’Aosta, Piedmont and Liguria, “Centro” includes
Tuscany, Umbria and Marche and “Sud” pools together Apulia, Basilicata and
Calabria.
23
RIVISTA
DI
POLITICA ECONOMICA
MAGGIO-GIUGNO 2008
Emilia-Romagna — with a female employment rate of 72 percent
and a 15 percentage points gap in employment rates across
genders — is similar to the US the UK, Finland and Denmark.
Next, in Nord Ovest regions and Lombardia the gender
employment gap is below 30 percentage points. These gaps are
comparable to those observed for central/northern European
countries and Ireland. Finally, the employment gap is above 30
percentage points in the remaining regions with a maximum of
42 points in Apulia, Basilicata and Calabria. These gaps are
similar to those observed for Italy as a whole, Greece and Spain.
The gaps in employment to population ratios display a negative
correlation with gaps in (log) hourly wages. Gender wage gaps in
hourly wages are lowest, less than 5 log points, in central Italy
(excluding Lazio,) Abruzzo-Molise, Campania, Sud and Sicilia
where women’s hourly wages are about 10 log points higher than
men’s hourly wages although the difference is not statistically
significant. Next we have central and northern regions (excluding
Emilia-Romagna) and Sardinia where the gender gap in hourly
wages ranges from a minimum of 7 log points in Nord-Est, to a
maximum of 13 log points in Lombardia. Finally, at 17.4 log
points, Emilia-Romagna displays the largest gender wage gap
across all the regions (but still lower than the one observed in
Germany and Austria).
As in the cross-country analysis, such negative correlation
between wage and employment gaps may reveal significant sample
selection effects in observed wage distributions. The negative
relationship between the two series across regions is even stronger
than across countries. The coefficient of correlation between the
two series is –0.615 and significant at the 5 percent level.
Since sample sizes by region are reasonable but small (see
Table 6) in Graph 3 we replicate Graph 2 by using all available
information. That is, we pool together all the ECHPS waves and
compute gender gaps in log hourly wages and employment on this
sample (these can be interpreted as medium-run statistics). In this
case the negative correlation becomes stronger, –0.824, and
significant at the 1 percent level. The regional “rankings” by gender
employment and wage gaps are identical across the two figures.
24
C. OLIVETTI
Gender and the Labour Market: An International, etc.
GRAPH 3
GENDER GAPS ACROSS ITALIAN REGIONS, ALL WAVES
(Coefficient of correlation: –0.824***)
15
Emilia-Romagna
mean (log) wage gap (%)
Lombardia
Abruzzo-Molise
10
Nord Ovest
Nord Est
5
Sardegna
Centro
Campania
Lazio
0
Sud
–5
Sicilia
20
25
30
35
40
45
employment gap (%)
This evidence supports the view that, if women who are
employed in Southern Italy tend to have relatively high-wage
characteristics, low female employment rates in these regions may
become consistent with low gender wage gaps simply because lowwage women do not work and thus they do not feature in the
observed wage distribution. We explore this conjecture by
replicating the analysis in the previous section across Italian
regions.
The results are reported in Table 5 which follows the same
structure as Table 4. Column 1 reports the actual median wage
gap (for reference), column 2 the results using imputation from
the nearest available wave, columns 3 and 4 refer to imputation
on observables using unemployment status and education and
experience, respectively.
Column 1 shows that while gender wage gaps are negative,
relatively large and statistically significant in all the northern
25
RIVISTA
DI
POLITICA ECONOMICA
MAGGIO-GIUGNO 2008
TABLE 5
GENDER WAGE GAPS ACROSS IMPUTATION RULES:
ITALIAN REGION
1
2
3
4
Base sample
Imputation on
unobservables
Imputation on
observables
Imputation on
observables
Wages imputed
from other
waves (–5, +2
window)
Nord Ovest
Lombardia
Nord Est
EmiliaRomagna
Centro (I)
Lazio
AbruzzoMolise
Campania
Sud
Sicilia
Sardegna
Correlation
Educated guess: Educated guess:
low wage
low (high) wage
imputed
imputed if
if unemployed education < upper
sec. (> = higher
educ.) &
experience < 10
(> = 10) yrs
–0.100***
–0.102***
–0.094***
–0.109***
–0.097***
–0.097***
–0.089**
–0.113***
–0.101***
–0.125***
–0.117***
–0.104***
–0.172***
–0.049
–0.082**
–0.155***
–0.091**
–0.099***
–0.170***
–0.102***
–0.085*
–0.181***
–0.122***
–0.269***
–0.087
–0.006
0.008
0.022
–0.107
–0.118**
–0.114**
0.01
–0.009
–0.102*
–0.191***
–0.142*
–0.179***
–0.176
–0.333***
–0.223***
–0.884***
–
–
–0.788***
–0.750***
–0.674**
0.103
0.353
Notes: Figures in the last row display the cross-country correlation between the
reported gender wage gap and the gender employment gap. *** Significant at the
1% level, ** significant at the 5% level, * significant at the 10% level. Sample: aged
25-54, excluding the self-employed, the military and those in full-time education,
1999. Source: ECHPS.
regions and Lazio, for all remaining regions women’s and men’s
wages are not significantly different from each other (although
they tend to be negative for most regions except for Sud and Sicilia
where women seem to earn more than men do).
Moving from column 1 to column 2, one can see that the
26
C. OLIVETTI
Gender and the Labour Market: An International, etc.
median wage gap remains substantially unaffected or marginally
affected in all the northern regions and Sardinia and increases
substantially in the remaining regions. Interestingly, the gender
gap on the imputed distribution actually declines (by 5 and 10
percent, respectively) in Lombardia and Emilia-Romagna — thus
implying a negative selection in the labor force for these regions.11
That is, in this case it is women with high-wage characteristics
who seem to have a more intermittent participation to the labor
market. The gap increases by around 20 percent in Lazio and
Campania, becoming (more) statistically significant; by 35 percent
in Abruzzo-Molise; and by more than 80 percent in Centro regions.
The gap also increases in the Sud and in Sicilia — where it
becomes negative, although it remains not statistically different
from zero. Once again, gender wage gaps tend to respond more
strongly to selection correction in regions with higher employment
gaps and this is reflected in the cross-regional correlation between
employment and wage gaps which falls from –0.750 in column 1
to –0.674 in column 3 (a 10 percent decline) and looses
significance. The fact that under this imputation rule we obtain
a small effect of non-random employment selection is not
surprising. In columns 1-4 of Table 6 we report the proportion of
the adult population that is either working or has an imputed
wage. When moving from column 1 to 2, the fraction of women
included increases in most regions, including some regions where
the estimated wage gap is not greatly affected by the sample
inclusion rules. However, although female employment rates in
the southern regions increase their level remain quite low (38
percent in Sicilia and around 45 percent in Sud, Campania and
Sardegna). That is, we can recover relatively fewer less-attached
women in these regions than elsewhere because they are
characterized by more persistent employment patterns. Entries in
Table 6 also show that the fraction of men included in the sample
increases, albeit less than for women. It is thus not simply the
11
This is an interesting feature of the OP methodology. Imputation based on
unobservable does not requite any assumption on the “sign” of selection into
employment ex-ante. Thus, we can potentially obtain lower estimate of the gender
wage gap on the imputed than on the actual wage distribution.
27
RIVISTA
DI
POLITICA ECONOMICA
MAGGIO-GIUGNO 2008
TABLE 6
PERCENTAGE OF ADULT POPULATION IN SAMPLES
FOR TABLE 5
No. obs.
1999
M
Nord Ovest
Lombardia
Nord Est
EmiliaRomagna
Centro (I)
Lazio
AbruzzoMolise
Campania
Sud
Sicilia
Sardegna
F
1
M
2
F
M
3
F
M
4
F
M
F
265
292
317
288 87.9 64.9 93.6 75.0 95.8 70.5 88.7 71.2
372 93.2 65.3 97.6 74.7 96.2 68.0 94.2 68.3
390 92.1 59.2 96.2 72.3 94.6 64.1 92.7 63.6
144
342
197
173 87.5 72.3 96.5 86.1 93.8 79.8 87.5 75.7
386 90.9 55.4 97.7 66.8 95.6 62.4 92.1 67.1
242 82.2 41.7 93.9 55.0 91.9 47.1 87.3 60.3
196
354
473
286
223
213
401
580
391
280
68.9
66.4
74.4
63.3
66.8
36.2
31.4
32.1
26.1
31.8
87.8
82.8
88.6
83.6
89.7
50.2
46.9
45.3
37.9
45.4
83.7
91.8
89.9
85.7
90.1
54.0
45.9
48.1
44.5
49.3
70.9
75.7
79.1
69.9
76.7
52.1
60.1
61.2
64.7
65.0
Notes: Figures in columns 1-4 represent the proportions of males and females
included in the sample for columns 1-4 in Tables 5. Sample: aged 25-54, excluding
the self-employed, the military and those in full-time education. Source: ECHPS.
Sample inclusion rules by column:
1. Employed at time of survey in 1999.
2. Wage imputed from other waves when non-employed (–5, +2 window).
3. Impute wage < median when unemployed.
4. Impute wage < median when non-employed & education < upper secondary &
experience < 10 years.
Impute wage > median when non-employed & education > = higher educ. &
experience > = 10.
lower female employment rate in several regions that drives our
findings, it is also the fact that in some regions selection into work
seems to be less correlated to wage characteristics than in others.
This is clear when we compare column 1 to columns 3 and
4. In both columns we use observable characteristics to impute
wages for the non-employed. Median wage gaps are only
marginally affected in the Nord Ovest down to Emilia-Romagna.
However, in the remaining regions the gender wage gap increases
enormously with respect to the actual wage gap of column 1,
28
C. OLIVETTI
Gender and the Labour Market: An International, etc.
especially so in Campania, Sud and Sicilia. As a consequence the
correlation with employment gaps turns positive (and
insignificant). Under this imputation rule, selection explains
virtually all the negative cross-regional correlation between wage
and employment gaps.
A similar pattern emerges in column 4. In Campania and
Sardegna we obtain median gender wage gaps of approximately
80 percentage points on the imputed distribution. Moreover, we
cannot report estimates for Sud and Sicilia since the inference in
this case is not valid. This is because the female median wage on
the imputed sample falls in the imputed set. That is, more than
half of the female sample not in work in 1999 has low-wage
characteristics (lower than upper-secondary education and less
than 10 years of labor market experience). Very few observations
are imputed above the median because in these regions most if
not all of the women with high education (a college degree or
higher) and experience on the labor market (10 years or higher)
actually are at work in 1999. These findings are revealing. They
suggest that, especially for this group of regions, the most salient
characteristics of “missing” women in the labor market are (low)
education and (low) labor market experience.
As in the cross-country analysis, the results reported in this
section consistently indicate the importance of sample selection
(on a small set of observable characteristics) in regions with high
employment gaps.
6. - Concluding Remarks
The study of international or regional differences might have
important implications for Equal Opportunity policies. In areas
where selection dominates, stricter implementation of equal pay
policies would have a limited impact, as the problem is rather
rooted in low female employment rates. In this case equal
employment policies would be best suited, and these range from
anti-discrimination hiring regulations to family policies aimed at
raising participation of mothers such as the rights to flexible
29
RIVISTA
DI
POLITICA ECONOMICA
MAGGIO-GIUGNO 2008
working times and subsidized child-care. With this in mind, we
conclude with a brief discussion of potential determinants of the
regional variation in the level and composition of female
employment.
One important factor is identified in a recent paper by Del
Boca and Vuri (2007). Their analysis shows that while the quality
of public child care is quite high in general, and fairly
homogeneous across regions, both the availability and the
flexibility in the hours of child care services are limited and
heterogenous with respect to household characteristics such as
income and area of residence. They also show that these factors
are important determinants of female employment and child-care
decisions. Given these premises their argument that differences in
the characteristics of the child care system across regions might
have a significant role in explaining the observed cross-regional
variation in female employment seems quite convincing.
Differences in cultural beliefs about gender roles and family
values (see Fernández and Fogli, 2009, Fernández, 2007 and
Fortin, 2005) might also play a role. Besides affecting women’s
incentives to work, these “fuzzy” variables may also shape
employers’ beliefs about women’s labor force attachment, and thus
the demand for female labor. In addition, labor market conditions
as well as the sectorial composition of the (local) economy may
also be significant determinants of gender employment gaps.
Disentangling supply and demand factors that drive the observed
variation in female employment rates is interesting and important
but rather complicated. In ongoing work Olivetti and Petrongolo
(2009) exploit employment and wage differences across countries,
genders and skills to address this issue. Similarly to the analysis
discussed in this paper, their findings might have interesting
implications for understanding the variation in women’s labor
market outcomes across Italian regions.
30
C. OLIVETTI
Gender and the Labour Market: An International, etc.
BIBLIOGRAPHY
ALTONJI J.G. - BLANK R.M., «Race and Gender in the Labor Market», in ASHENFELTER O. - CARD D. (eds.), Handbook of Labor Economics, vol. 3C, North-Holland, 1999, pages 3141-3259.
BLAU F.D. - KAHN L.M., «Wage Structure and Gender Earnings differentials: An International Comparison», Economica, no. 63, 1996, pages 29-62.
— — - — —, «Swimming Upstream: Trends in the Gender Wage Differentials in
the 1980s», Journal of Labor Economics, no. 15, 1997, pages 1-42.
— — - — —, «Understanding International differences in the Gender Pay Gap»,
Journal of Labor Economics, no. 21, 2003, pages 106-144.
— — - — —, «The US Gender Pay Gap in the 1990s: Slowing Convergence?», Industrial and Labor Relations Review, no. 60, 2006, pages 45-66.
DEL BOCA D. - AABERGE R. - COLOMBINO U. - ERMISH J. - FRANCESCONI M. - PASQUA
S. - STRØM S., «Labour Market Participation of Women and Fertility: The effect
of Social Policies», in BOERI T. - DEL BOCA D. - PISSARIDES C. (eds.), Women at
Work: An Economic Perspective, Oxford, Oxford University Press, 2005.
DEL BOCA D. - PASQUA S., «Labor Supply and Fertility in Europe and in the US»,
in BOERI T. - DEL BOCA D. - PISSARIDES C. (eds.), Women at Work: An Economic Perspective, Oxford, Oxford University Press, 2005.
DEL BOCA D. - VURI D., «The Mismatch between Employment and Child Care in
Italy: The Impact of Rationing», Journal of Population Economics, no. 20 (4),
2007, pages 805-832.
DOLADO J.J.- FELGUEROSO F. - JIMENO J.F., «Recent Trends in Occupational Segregation by Gender: A Look Across the Atlantic», IZA, Discussion Paper, no. 524,
2002.
EDIN P.A. - RICHARDSON K., «Swimming with the Tide: Solidary Wage Policy and
the Gender Earnings Gap», Scandinavian Journal of Economics, no. 104 (1),
2002, pages 49-67.
FERNÁNDEZ R., «Women, Work, and Culture», Journal of the European Economic
Association, no. 5 (2-3), 2007, pages 305-332.
FERNÁNDEZ R. - FOGLI A., «Culture: An Empirical Investigation of Beliefs, Work,
and Fertility», American Economic Journal, Macroeconomics, no. 1 (1), 2009,
pages 146-177.
FORTIN N.M., «Gender Role Attitudes and the Labour Market Outcomes of Women
Across OECD Countries», Oxford Review of Economic Policy, no. 21, 2005, pages
416-438.
GUPTA N.D. - OAXACA R.L. - SMITH N., «Swimming Upstream, Floating Downstream:
Trends in the US and Danish Gender Wage Gaps», CLS, Working Papers, n. 01-6,
Aarhus School of Business, Centre for Labour Market and Social Research,
2002.
JOHNSON W.R. - KITAMURA Y. - NEAL D., «Evaluating a Simple Method for Estimating Black-White Gaps in Median Wages», American Economic Review, no.
90, 2000, pages 339-343.
JUHN C. - MURPHY K.M. - PIERCE B., «Wage Inequality and the Rise in Returns to
Skill», Journal of Political Economy, no. 101 (3), 1993, pages 410-442.
MANSKI C.F., «The Selection Problem», in SIMS C.A. (eds.), Advances in Econometrics, Sixth World Congress, vol. 1, Cambridge University Press, 1994.
31
RIVISTA
DI
POLITICA ECONOMICA
MAGGIO-GIUGNO 2008
MULLIGAN C.B. - RUBINSTEIN Y., «Selection, Investment, and Women’s Relative
Wages Over Time», Quarterly Journal of Economics, no. 123 (3), 2008, pages
1061-1110.
NEAL D., «The Measured Black-White Wage Gap Among Women is Too Small»,
Journal of Political Economy, no. 112, 2004, pages 1-28.
OECD, Employment Outlook, Paris, 2002.
OLIVETTI C. - PETRONGOLO B., «Unequal Pay or Unequal Employment? A CrossCountry Analysis of Gender Gaps», Journal of Labor Economics, no. 26, 2008,
pages 621-654.
— — - — —, Gender Gaps across Skills: Demand or Supply Forces?, manuscript,
Boston University, 2009.
PETRONGOLO B., «Gender Segregation in Employment Contracts», Journal of the
European Economic Association, no. 2, 2004, pages 331-345.
PISSARIDES C. - GARIBALDI P. - OLIVETTI C. - PETRONGOLO B. - WASMER E., «Women
in the Labour Force: How well is Europe Doing?», in BOERI T. - DEL BOCA D. PISSARIDES C. (eds.), Women at Work: An Economic Perspective, Oxford, Oxford
University Press, 2005.
RUHM C.J., «The Economic Consequences of Parental Leave Mandates: Lessons from
Europe», Quarterly Journal of Economics, no. 113 (1), 1998, pages 285-317.
32
Scaricare