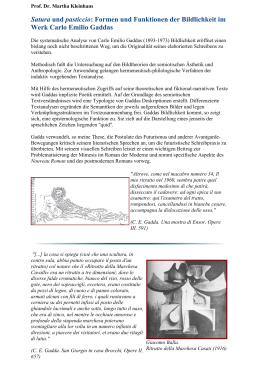
Bildungsmonitoring Schweiz
Für das Leben gerüstet ?
Die Grundkompetenzen der Jugendlichen –
Kurzfassung des nationalen Berichtes PISA 2000
Urs Moser
OECD – PISA Programme for International Student Assessment
Inhalt
Zum Geleit
Seite 4
Vorwort
Seite 6
PISA im Überblick
Seite 8
Die Schweiz im
internationalen Vergleich
Seite 11
Sprachregionale Besonderheiten
Seite 17
Potenzial für die Zukunft
Seite 18
Ausblick
Seite 23
Testbeispiele
Seite 24
Herausgeber
Bundesamt für Statistik (BFS) und
Schweizerische Konferenz der kantonalen
Erziehungsdirektoren (EDK)
Zum Geleit
Im vergangenen Jahrzehnt hat sich die
Bildungspolitik in der Schweiz vor allem
mit dem inhaltlichen und strukturellen
Umbau des Bildungswesens befasst. Es
geht darum, die nachfolgenden Generationen mit Kompetenzen auszustatten,
die zur innovativen Bewältigung der
steigenden gesellschaftlichen Anforderungen notwendig sind. Aktuelle politische Themen sind: Ausdehnung der
Lernprozesse auf den gesamten Lebenszyklus, Qualitätsmessung und Qualitätsmanagement, effizienter Einsatz
von Finanzen und Personen, Netz von
relevanten Steuerungsinformationen.
Die Qualitätssicherung des Bildungswesens setzt sinnvollerweise bei den
Resultaten des Bildungsprozesses an.
Die schulischen Leistungen von Schülerinnen und Schülern in den Kernbereichen Lesen, Mathematik und Naturwissenschaften am Ende der obligatorischen Schule können dabei als kumulierte Effekte der schulischen Karrieren
interpretiert werden. Ein Leistungsvergleich mit andern Bildungssystemen
liefert wertvolle Informationen zu
Stärken und Schwächen des eigenen
Bildungssystems.
Vor diesem Hintergrund hat sich die
Schweiz entschlossen, am internationa-
BFS/EDK 2001 FÜR DAS LEBEN GERÜSTET ?
SEITE 4
len Projekt PISA (Programme for International Student Assessment) teilzunehmen. Der Entscheid fiel ihr insofern
leicht, als sie sich auf eine solide Basis
von Erfahrungen stützen konnte, die in
ähnlich konzipierten Vorläuferprojekten
gesammelt wurden (z.B. TIMSS, IALS).
Die PISA-Messungen werden zudem
über einen Zeitraum von 10 Jahren
durchgeführt, was erlaubt, die Wirkungen politischer Massnahmen zu überprüfen.
Bemerkenswert an der schweizerischen
Projektstruktur ist die enge Zusammenarbeit zwischen Bund (Bundesamt für
Statistik, BFS) und Kantonen (Schweiz.
Konferenz der kantonalen Erziehungsdirektoren, EDK), in deren Zentrum
die gemeinsame Finanzierung steht.
Diese Zusammenarbeit wird um eine
weitere Dimension bereichert. Im
Rahmen einer Sonderreihe sollen zukünftig Fakten, Analysen, Konzepte und
Indikatoren publiziert werden, die für
die Qualitätssicherung des Bildungswesens von zentraler Bedeutung sind.
Herausgegeben wird die Reihe von BFS
und EDK.
Die Teilnahme an internationalen Leistungsmessungen wie PISA erfordert
einen beträchtlichen Einsatz finanzieller
ZUM GELEIT
Mittel und hohe wissenschaftliche
Kompetenzen. Unter diesen Umständen
ist es besonders erfreulich, dass das
Projekt erfolgreich durchgeführt werden
konnte. Die jetzt vorliegenden Resultate
zu den Leistungen der Schülerinnen und
Schüler in der Schweiz zeigen jedoch,
dass weitere vertiefende Analysen nötig
sind, um die Funktionsweise unseres
Bildungswesens besser verstehen und
konkrete Massnahmen einleiten zu können. Die Bildungspolitik ist gefordert,
für die analytischen Arbeiten und die
notwendige Weiterentwicklung der wissenschaftlichen Kompetenzen die
Ressourcen bereitzustellen.
Allen Beteiligten, die mit grossem
Engagement zum Gelingen von PISA
beigetragen haben, danken wir herzlich.
DIE STEUERUNGSGRUPPE PISA.ch
Martine Brunschwig Graf
Carlo Malaguerra
Regierungsrätin und Erziehungsdirektorin, Genf
Direktor Bundesamt für Statistik, Neuenburg
Ernst Buschor
Gerhard M. Schuwey
Regierungsrat und Bildungsdirektor, Zürich
Direktor Bundesamt für Bildung und Wissenschaft,
Hans Ambühl
Bern
Generalsekretär EDK, Bern
BFS/EDK 2001 FÜR DAS LEBEN GERÜSTET ?
SEITE 5
Vorwort
Das Projekt PISA (Programme for International Student Assessment) ermöglicht jedem beteiligten Land eine Standortbestimmung der Kompetenzen seiner
Jugendlichen am Ende der obligatorischen Schulbildung. Diese Standortbestimmung kann und soll gesellschaftliche und bildungspolitische Grundfragen aufwerfen: Welches sind die
relevanten Fähigkeiten, die unsere
Schulen den Schülerinnen und Schülern
vermitteln sollen, damit sie später
erfolgreich an der Gesellschaft partizipieren können? Welche Grundbildung
ist Voraussetzung, um den Herausforderungen einer globalisierten und technologisierten Welt gewachsen zu sein?
Welches sind im internationalen Vergleich die relativen Stärken und Schwächen des eigenen Bildungssystems?
Grundlagen und Anhaltspunkte für eine
Diskussion dazu liefern jetzt die ersten
Resultate der Erhebung PISA 2000.
Der hier präsentierte Kurzbericht «Für
das Leben gerüstet?» bezieht sich auf
den nationalen Bericht gleichen Titels,
der im Frühjahr 2002 veröffentlicht
wird. Die Kurzfassung enthält nun die
zentralen Resultate und greift wichtige
Hintergrundinformationen zum Projekt
PISA und zu einigen aktuellen Themen
der Bildungsforschung auf. Auch die
BFS/EDK 2001 FÜR DAS LEBEN GERÜSTET ?
SEITE 6
OECD publiziert einen ersten, umfangreichen PISA-Bericht unter dem Titel
«Lernen für das Leben». Mit diesen
nationalen und internationalen Berichten schliesst die erste Phase des Projektes PISA erfolgreich ab.
Zum Gelingen der Studie haben zahlreiche Personen und Institutionen beigetragen. Unser besonderer Dank gilt allen
Schülerinnen und Schülern in der
Schweiz, die an PISA 2000 teilgenommen haben. Für die Durchführung und
Organisation der Tests bedanken wir
uns bei den Schulen, insbesondere den
Schulkoordinatorinnen und Schulkoordinatoren, den Testleiterinnen und Testleitern sowie den regionalen Koordinationszentern, die die Erhebung in den
Testregionen kompetent umgesetzt
haben. Die nationale Finanzierung und
die strategische Ausrichtung garantieren
der Bund und die Kantone mit Vertreterinnen und Vertretern in der Steuerungsgruppe. Ausserdem wird die nationale Projektleitung in konzeptioneller,
inhaltlicher und methodischer Hinsicht
von verschiedenen Seiten aktiv unterstützt. Diesbezüglich zu danken ist den
Personen aus Wissenschaft, Bildungspolitik und Bildungspraxis des PISA-Netzwerks, den Fachdidaktikerinnen und
-didaktikern für die aktive Beteiligung
VORWORT
an der Entwicklung des internationalen
Testmaterials, der Gruppe «Sampling»
für die Konstruktion und Ziehung der
Stichprobe, den Bildungsforscherinnen
und -forschern des Analysenetzwerks
für die Erarbeitung einer kohärenten
Auswertungsstrategie PISA 2000 sowie
den Verfasserinnen und Verfassern des
ersten nationalen Berichtes.
Haupttests. Mit viel Spannung erwarten
wir die Resultate dieses zweiten Zyklus,
erlauben sie uns doch erste Trendaussagen durch den Vergleich der beiden
Erhebungsjahre 2000 und 2003. Wir
hoffen wiederum auf die grosse Unterstützung und kompetente Mitarbeit
und auch auf so viel oder noch mehr
Interesse am Projekt PISA.
Die internationale Organisation und
Koordination des Gesamtprojektes verdanken wir dem OECD-Sekretariat des
PISA-Programms, die übergreifenden
Entscheidungen und damit auch die
politische Verantwortung dem «Ausschuss der Teilnehmerländer» und die
operationelle und technisch-praktische
Abwicklung dem internationalen Konsortium, das auf langjährige Erfahrung
in der Konzeption und Realisierung von
nationalen und internationalen Erhebungen zurückgreifen kann. Dank schulden wir auch den in Arbeitsgruppen
zusammengefassten Expertinnen und
Experten aus den Teilnehmerstaaten, die
gewährleisten, dass sich die Zielsetzungen von PISA auf die besten verfügbaren fachwissenschaftlichen und verfahrens-technischen Kompetenzen im
Bereich des internationalen Leistungsvergleichs stützen.
Huguette McCluskey und das Team
DIE PROJEKTLEITUNG PISA.ch
PISA ist ein mehrjähriges Programm.
Die Vorbereitungen für den zweiten
Zyklus haben bereits begonnen. Im
April und Mai 2002 findet in einigen
ausgewählten Schulen erneut ein Pilottest statt. Im Frühling 2003 erfolgt
sodann die Durchführung des zweiten
BFS/EDK 2001 FÜR DAS LEBEN GERÜSTET ?
SEITE 7
PISA im
Überblick
Kontinuität beim internationalen Vergleich
der Schulleistungen
Jährigen in Lesen, Mathematik und Naturwis-
Mit PISA ist eine neue Epoche des internationalen
senschaften zur Verfügung zu stellen. Darüber
Vergleichs von Schulleistungen eingeleitet worden:
hinaus werden auch die Voraussetzungen für
Zum ersten Mal wurden im Auftrag der Organisa-
selbst reguliertes Lernen wie Interesse am Ler-
tion für wirtschaftliche Zusammenarbeit und
nen oder die Unterstützung des Lernens
Entwicklung (OECD) die unmittelbaren Ergebnisse
durch den Einsatz von Strategien erfasst.
der Bildungssysteme international verglichen. Zwar
Ausserdem beteiligt sich ein Teil der Länder an
hat die OECD schon längst auf die Bedeutung des
einem internationalen Vergleich der Vertraut-
hohen Bildungsniveaus für die volkswirtschaftliche
heit im Umgang mit dem Computer.
Wohlfahrt eines Landes hingewiesen. Sie beschränk-
PISA ist ein Programm, das vorerst drei
te sich jedoch bei den jährlich erstellten Bildungsindi-
Zyklen mit unterschiedlichen Schwerpunkten
katoren bis anhin auf zählbare Parameter wie bei-
umfasst. Schwerpunkt des ersten Zyklus
spielsweise die finanziellen Ausgaben für Bildung
(PISA 2000) bildet die differenzierte Beschrei-
oder die Häufigkeiten von Abschlüssen auf verschie-
bung der Lesekompetenz, während die
denen Stufen des Bildungssystems. Die Messung der
Ergebnisse in Mathematik und Naturwissen-
Ergebnisse des Lehr-Lern-Prozesses hingegen über-
schaften weniger ausführlich präsentiert wer-
liess sie anderen Organisationen. Ausserdem bilden
den. PISA 2003 widmet sich dann speziell der
die präsentierten Ergebnisse zum ersten Mal nicht
Mathematik, PISA 2006 den Naturwissen-
einfach den Abschluss einer einmaligen Untersu-
schaften.
chung. PISA ist ein Programm und baut auf Kontinuität. Alle drei Jahre wird den beteiligten Ländern eine
250 000 Schülerinnen und Schüler
internationale Standortbestimmung in Bezug auf
aus 32 Ländern
verschiedene Kompetenzen ermöglicht. Dadurch
Im Frühjahr 2000 haben rund 250 000 Schü-
können auch Trends verfolgt und allfällige bildungs-
lerinnen und Schüler aus 32 Ländern einen
politische Massnahmen auf ihre Wirkung hin geprüft
Leistungstest und einen Fragebogen ausge-
werden.
füllt. Pro Land haben sich in der Regel mindestens 4500 Schülerinnen und Schüler aus
150 Schulen beteiligt.
Um einen angemessenen internationalen
INFO 1
Eckdaten von PISA
Vergleich zu ermöglichen, mussten die Schülerinnen und Schüler zum Testzeitpunkt im
Bildung für die Zukunft
15. Altersjahr stehen. Auf Grund des späten
Das «Programme for International Student
Schuleintrittsalters haben die Schülerinnen
Assessment» (PISA) ist Teil des Indikatoren-
und Schüler der Schweiz im internationalen
programms
Educational
Vergleich eher weniger Schuljahre hinter sich.
Systems» (INES) der Organisation für wirt-
Weil der internationale Vergleich von Schüle-
schaftliche Zusammenarbeit und Entwicklung
rinnen und Schülern des gleichen Alters die-
(OECD). Ziel von PISA ist es, den OECD-Staa-
sem Umstand keine Rechnung trägt, wurde
ten Indikatoren für die Kompetenzen der 15-
für Vergleiche innerhalb der Schweiz zusätz-
«Indicators
of
BFS/EDK 2001 FÜR DAS LEBEN GERÜSTET ?
SEITE 8
PISA IM ÜBERBLICK
weite Strecken selbst zu gestalten. Selbst reguliertes
lich eine repräsentative Stichprobe der Schü-
Lernen ist eine Voraussetzung dafür, dass Schüle-
lerinnen und Schüler der 9. Klassenstufe aus-
rinnen und Schüler ihr Leistungspotenzial optimal
gewählt. In der Schweiz wurden deshalb
ausschöpfen können, und in diesem Sinne ist es ein
insgesamt mehr als 13 000 Jugendliche (15-
fundamentales Qualitätskriterium für ein Bildungs-
Jährige und 9. Klassenstufe) getestet und
system.
befragt.
In der heutigen Wissensgesellschaft ist zudem der
sichere Umgang mit aktuellen Informations- und
Grundbildung oder für das Leben gerüstet
Kommunikationstechnologien eine Voraussetzung
Im Alter von 15 Jahren steht der grösste Teil
für eine erfolgreiche schulische und berufliche Lauf-
der Jugendlichen vor dem Abschluss der obli-
bahn. Mit PISA wurde deshalb auch die Vertrautheit
gatorischen Schulzeit und sollte über ange-
im Umgang mit dem Computer erfasst.
messene Kompetenzen in Lesen, Mathematik
und Naturwissenschaften verfügen. PISA
Internationaler Vergleich bei 15-Jährigen
prüft deshalb in diesen Bereichen die Grund-
Die im Folgenden präsentierten Ergebnisse stammen
bildung oder anders ausgedrückt: jene
von rund 250 000 15-jährigen Jugendlichen aus 31
Kompetenzen in Lesen, Mathematik und
Ländern, darunter 6100 15-Jährige aus der Schweiz.
Naturwissenschaften, die zum Rüstzeug der
Am internationalen Vergleich haben sich 27 OECD-
15-Jährigen gehören. Diese Kompetenzen
Länder sowie Brasilien, Lettland, Liechtenstein und
werden zwar in der Schule vermittelt und
Russland beteiligt. Die Ergebnisse des internationalen
gelernt, sind jedoch nicht an einen spezifi-
Vergleichs sind für die 15-jährigen Jugendlichen der
schen Lehrplan gebunden, sondern können in
beteiligten Länder repräsentativ.
unterschiedlichem Kontext angewendet werden. Über diese Grundbildung sollte eine Person in unserer Gesellschaft verfügen.
INFO 2
Lesen, Mathematik
und Naturwissenschaften
Die Grundbildung am Ende
der obligatorischen Volksschule
Grundbildung Lesen
Ein weiterer Vorteil von PISA liegt in der Vielfalt und
Zur Grundbildung in Lesen gehört das Ver-
der Definition der erfassten Leistungen. Den eigent-
stehen bestimmter Informationen in einem
lichen Kern der Untersuchung bilden Leistungstests,
Text, das Identifizieren zentraler Aussagen
die differenzierte Aussagen über die Kompetenzen
eines Textes, aber auch das Interpretieren
von 15-Jährigen im Lesen, in der Mathematik und in
und kritische Bewerten des Inhalts oder der
den Naturwissenschaften ermöglichen. PISA orien-
Form eines Textes. Die Jugendlichen mussten
tiert sich dabei nicht einfach an curricularem, primär
deshalb eine Reihe von Aufgaben bearbeiten,
in der Schule vermitteltem Wissen, sondern an einer
die unterschiedliche Anforderungen an das
Grundbildung, über die Jugendliche am Ende der
Verstehen und Nutzen eines Textes sowie an
obligatorischen Schulbildung verfügen sollten.
das Reflektieren über einen Text stellten. Die
Im Hinblick auf weiterführende Bildungswege
Texte orientierten sich an Alltagssituationen
und auf den Einstieg ins Arbeitsleben reichen fach-
und waren thematisch auf die erfolgreiche
liche Kompetenzen alleine allerdings nicht aus. Infol-
Teilnahme am gesellschaftlichen Leben aus-
gedessen wurden auch wichtige Voraussetzungen
gerichtet.
für erfolgreiches Lernen wie die Anwendung von
Entsprechend diesem Verständnis konnten
Lernstrategien, das Interesse am Lernen und das
die Ergebnisse im Lesen auch für die drei
Selbstvertrauen in die eigene Leistungsfähigkeit
Bereiche «Informationen aus einem Text her-
erfasst. Interessierte und selbstbewusste Jugendliche
aussuchen», «Einen Text interpretieren» und
wenden Lernstrategien gezielt an und verfügen
«Über einen Text reflektieren sowie Form und
daher über eine hohe Handlungskompetenz als
Inhalt beurteilen» dargestellt werden.
Lernende. Sie sind fähig, ihren Lernprozess über
BFS/EDK 2001 FÜR DAS LEBEN GERÜSTET ?
SEITE 9
PISA IM ÜBERBLICK
Grundbildung Mathematik
Die mathematische Grundbildung umfasst
mathematisches Wissen und Können vom
Beherrschen mathematischer Standardverfahren bis zum komplexen mathematischen Verständnis. Die Mathematikaufgaben orientierten sich in erster Linie an Konzepten, die der
Mathematik zu Grunde liegen, wie Zufall,
Veränderung und Wachstum oder Raum und
Form. Die für die Schule üblichen Disziplinen
Arithmetik, Algebra und Geometrie waren in
diesen Aufgaben integriert. Auch in der
Mathematik resultierten die Aufgaben aus
den Anforderungen des gegenwärtigen und
künftigen Lebens.
Grundbildung Naturwissenschaften
Zur naturwissenschaftlichen Grundbildung
gehört es, die Welt mit Hilfe naturwissenschaftlicher Konzepte zu verstehen, naturwissenschaftliche Fragen zu erkennen und daraus
Schlussfolgerungen zu ziehen. Die geprüften
naturwissenschaftlichen Konzepte betrafen
aktuelle Themen wie Leben und Gesundheit,
Erde und Umwelt sowie Technologie. Sie entsprechen in diesem Sinne durchaus den gängigen Konzepten aus Physik, Chemie, Biologie
und Erdwissenschaften. In den Tests wurde
aber nicht einfach die Kenntnis dieser Konzepte abgefragt, sondern die Konzepte mussten auf aktuelle Themen und Alltagssituationen angewendet werden.
BFS/EDK 2001 FÜR DAS LEBEN GERÜSTET ?
SEITE 10
Die Schweiz im
internationalen Vergleich
Gut in Mathematik, mittelmässig im Lesen
und aus Schweden. Die Schülerinnen und Schüler
und in den Naturwissenschaften
Japans erreichen in der Mathematik die besten Leis-
In allen drei geprüften Bereichen sind die Jugend-
tungen aller Länder. In den Naturwissenschaften
lichen aus Finnland, Japan und Südkorea an der Spit-
erreichen die Jugendlichen aus Japan und aus
ze. Ebenfalls herausragende Ergebnisse in Lesen,
Schweden ebenfalls signifikant bessere Leistungen
Mathematik und Naturwissenschaften erreichen die
als jene aus der Schweiz, während die Ergebnisse der
Schülerinnen und Schüler aus Neuseeland, Kanada,
Jugendlichen aus den USA nahe bei jenen aus der
Australien und Grossbritannien (vgl. Tabelle 1).
Schweiz liegen.
Die Jugendlichen aus der Schweiz erreichen in der
Mathematik – wie schon in früheren Jahren hinter
den führenden Nationen Japan und Südkorea, aber
auch hinter Neuseeland, Finnland, Australien und
Kanada – ein gutes Ergebnis. Im Lesen und in den
Naturwissenschaften hingegen liegen die Ergebnisse
der Schweizer Jugendlichen im Mittelfeld. Dies ent-
INFO 3
Statistisch signifikante
Unterschiede
spricht den Erwartungen auf Grund der Ergebnisse
aus neueren internationalen Studien wie der Third
Weil in den teilnehmenden Ländern nicht alle
International Mathematics and Science Study, TIMSS
15-Jährigen (Population), sondern Stichpro-
(1997), dem International Adult Literacy Survey,
ben der 15-Jährigen untersucht wurden, wer-
IALS (1996), oder der IEA-Reading-Literacy-Study
den die Ergebnisse eines Landes auf Grund
(1993). Die Schweizer Schülerinnen und Schüler
der Ergebnisse jener 15-Jährigen geschätzt,
gehören in der Mathematik weltweit zu den besten,
die der Stichprobe angehören. Die Schätzun-
im Lesen und in den Naturwissenschaften liegen sie
gen der Ergebnisse – z.B. der Mittelwerte der
jedoch deutlich hinter den führenden Ländern.
Länder auf der Leseskala – sind deshalb mit
Ein Vergleich mit den Nachbarländern zeigt, dass
einem Stichprobenfehler behaftet. Je nach
die Schweizer Jugendlichen im Durchschnitt etwa
Genauigkeit der Stichprobe streuen die
gleich gute Ergebnisse im Lesen erreichen wie jene
geschätzten Ergebnisse der 15-Jährigen in
aus Österreich, Frankreich, Italien und Deutschland.
einem grösseren oder kleineren Bereich (Ver-
In der Mathematik ist das Ergebnis der Jugendlichen
trauensintervall) um den wahren Wert der 15-
aus der Schweiz signifikant besser als jenes der
Jährigen.
Jugendlichen aus Deutschland und Italien. In den
Bei der Prüfung der Ergebnisse auf statis-
Naturwissenschaften erzielen die Jugendlichen aus
tisch gesicherte Unterschiede zwischen den
Österreich signifikant bessere Leistungen als jene aus
Ländern werden die Stichprobenfehler be-
der Schweiz.
rücksichtigt. Ein Unterschied zwischen zwei
Im Vergleich zu Japan, Schweden und den USA
Ländern wird dann als signifikant bezeichnet,
schneiden die Schweizer Jugendlichen im Lesen
wenn er durch ein statistisches Testverfahren
leicht schlechter ab, wobei der Rückstand gegenüber
überprüft und als gültig befunden worden ist.
den Jugendlichen aus den USA statistisch nicht signi-
Unterschiede, die sich nicht als statistisch
fikant ist. In der Mathematik hingegen sind die
signifikant erwiesen haben, sind nicht von
Ergebnisse der Schweizer Schülerinnen und Schüler
Bedeutung.
statistisch signifikant besser als jene aus den USA
BFS/EDK 2001 FÜR DAS LEBEN GERÜSTET ?
SEITE 11
DIE SCHWEIZ IM INTERNATIONALEN VERGLEICH
TABELLE 1:
Ergebnisse der 15-Jährigen in der Schweiz im internationalen Vergleich, 2000
Lesen
Mathematik
Naturwissenschaften
Jugendliche aus den
Finnland
Japan
Südkorea
aufgeführten Ländern
Kanada
Südkorea
Japan
erreichen statistisch
Neuseeland
Finnland
signifikant bessere
Australien
Grossbritannien
Leistungen als die
Irland
Kanada
Jugendlichen in der
Südkorea
Neuseeland
Schweiz
Grossbritannien
Australien
Japan
Österreich
Schweden
Irland
Schweden
Jugendliche aus den
Österreich
Neuseeland
Tschechien
aufgeführten Ländern
Belgien
Finnland
Frankreich
erreichen Leistungen,
Island
Australien
Norwegen
die sich von jenen
Norwegen
Kanada
USA
der Jugendlichen in
Frankreich
(Schweiz)
Ungarn
der Schweiz statis-
USA
Grossbritannien
Island
tisch nicht signifikant
Dänemark
Belgien
Belgien
unterscheiden
(Schweiz)
Frankreich
(Schweiz)
Spanien
Österreich
Spanien
Tschechien
Dänemark
Deutschland
Italien
Island
Polen
Deutschland
Liechtenstein
Dänemark
Liechtenstein
Ungarn
Polen
Jugendliche aus den
Griechenland
Schweden
Italien
aufgeführten Ländern
Portugal
Irland
Liechtenstein
erreichen signifikant
Russland
Norwegen
Griechenland
schlechtere Leistun-
Lettland
Tschechien
Russland
gen als die Jugend-
Luxemburg
USA
Lettland
lichen in der Schweiz
Mexiko
Deutschland
Portugal
Brasilien
Ungarn
Luxemburg
Russland
Mexiko
Spanien
Brasilien
Polen
Lettland
Italien
Portugal
Griechenland
Luxemburg
Mexiko
Brasilien
© BFS/EDK
BFS/EDK 2001 FÜR DAS LEBEN GERÜSTET ?
SEITE 12
DIE SCHWEIZ IM INTERNATIONALEN VERGLEICH
ABBILDUNG 1:
Verteilung der 15-Jährigen auf die Kompetenzniveaus im Lesen, 2000
Jugendliche aus
Finnland
den aufgeführten
Kanada
Ländern erreichen
Neuseeland
statistisch signifikant bessere
Australien
Leistungen als die
Irland
Jugendlichen in
Südkorea
der Schweiz
Grossbritannien
(vgl. Tabelle 1)
Japan
Schweden
Jugendliche aus
Österreich
den aufgeführten
Belgien
Ländern erreichen
Island
Leistungen, die
sich von jenen der
Norwegen
Jugendlichen in der
Frankreich
Schweiz statistisch
USA
nicht signifikant
Dänemark
unterscheiden
Schweiz
(vgl. Tabelle 1)
Spanien
Tschechien
Italien
Deutschland
Liechtenstein
Ungarn
Polen
Jugendliche aus
Griechenland
den aufgeführten
Portugal
Ländern erreichen
Russland
signifikant schlechtere Leistungen als
Lettland
die Jugendlichen
Luxemburg
in der Schweiz
Mexiko
(vgl. Tabelle 1)
Brasilien
0%
Niveau < 1
20%
Niveau 1
40%
Niveau 2
60%
Niveau 3
80%
100%
Niveau 4
Niveau 5
© BFS/EDK
BFS/EDK 2001 FÜR DAS LEBEN GERÜSTET ?
SEITE 13
DIE SCHWEIZ IM INTERNATIONALEN VERGLEICH
Grosser Anteil schlechter Leserinnen und Leser
Auffallend beim Ergebnis der Schweizer Jugendlichen
INFO 4
Lesekompetenzen
im Lesen ist, dass ein überdurchschnittlich grosser
Anteil nur über sehr geringe Lesekompetenzen ver-
Die differenzierte Erfassung der Lesekompe-
fügt (vgl. Info 4 und Abbildung 1: Niveau kleiner als
tenz im ersten PISA-Zyklus führte dazu, dass
1 oder Niveau 1). Gleich wie in Deutschland sind
eine aussagekräftige Aufzeichnung des Bil-
mehr als 20 Prozent der Schülerinnen und Schüler am
dungsstands der Jugendlichen im Lesen am
Ende der obligatorischen Schulzeit nicht in der Lage,
Ende der obligatorischen Schulzeit gemacht
einfache Texte vollständig richtig zu verstehen und
werden konnte. Für die Bildungsplanung ist
den Inhalt sinngemäss zu interpretieren. Sie verfügen
nicht primär von Interesse, welche Länder die
nur über rudimentäre Kompetenzen im Lesen und
höchsten Mittelwerte erreichen, sondern wie
Verstehen der Unterrichtssprache. Für rund 7 Prozent
diese Mittelwerte zu Stande kommen. Die
der Schülerinnen und Schüler ist es sogar kaum mög-
Leistungen der teilnehmenden Schülerinnen
lich, aus einem schriftlichen Text auch nur einfache
und Schüler wurden deshalb verschiedenen
Informationen zu ermitteln. Sie gehören im Hinblick
Niveaus zugeteilt.
auf die berufliche und schulische Integration zu einer
Niveau 5: Jugendliche, die das höchste Kom-
Risikogruppe, weil sie ernsthafte Probleme haben
petenzniveau erreichen, sind in der Lage,
werden, die Anforderungen einer Berufslehre oder
anspruchsvolle Texte mit nicht vertrautem
von Weiterbildungsangeboten zu erfüllen (Niveau
Inhalt bis ins letzte Detail zu verstehen. Sie
kleiner als 1). In Japan beispielsweise sind diese Antei-
sind fähig, die relevanten Informationen zu
le nur gerade halb so gross: rund 10 Prozent verfügen
erkennen und auf Grund dieser Hypothesen
nur über rudimentäre Lesekompetenzen und knapp 3
kritisch zu testen, auch wenn es sich um fach-
Prozent gehören zur eigentlichen Risikogruppe. Der
spezifische Texte handelt.
Anteil Jugendlicher, die zur Risikogruppe gehören,
Niveau 4: Jugendliche, die Kompetenzniveau
liegt in den USA bei 6,4 Prozent, in Italien bei 5,4 Pro-
4 erreichen, sind fähig, schwierige Aufgaben
zent, in Österreich bei 4,4 Prozent, in Frankreich bei
zu lösen wie eingeschobene Informationen zu
4,2 Prozent und in Schweden bei 3,3 Prozent. In
lokalisieren, sprachliche Nuancen zu erkennen
Deutschland ist dieser Anteil mit 9,9 Prozent aller-
und Texte kritisch zu beurteilen.
dings noch wesentlich höher als in der Schweiz.
Niveau 3: Jugendliche, die Kompetenzniveau
3 erreichen, sind fähig, Texte mittlerer Kom-
Durchschnittlicher Anteil
plexität zu verstehen, Informationen aus ver-
sehr guter Leserinnen und Leser
schiedenen Textteilen miteinander in Verbin-
Die OECD misst der Lesekompetenz eine hohe
dung zu bringen und diese zum vertrauten
Bedeutung für eine erfolgreiche berufliche Karriere
Alltagswissen in Beziehung zu setzen.
zu. Wenn Jugendliche in der Lage sind, anspruchs-
Niveau 2: Jugendliche, die Kompetenzniveau
volle Texte mit nicht vertrautem Inhalt bis ins letzte
2 erreichen, sind fähig, einen Text für grund-
Detail zu verstehen und sowohl Form und Inhalt des
legende Aufgaben zu nutzen: etwa auf Grund
Textes plausibel zu kritisieren, auch wenn es sich um
der Informationen aus dem Text einfache
einen fachspezifischen Text handelt, dann haben sie
Schlüsse zu ziehen oder die Bedeutung
beste Voraussetzungen, eine höhere Bildung zu
begrenzter Textteile mit Hilfe des eigenen
absolvieren und sich beruflich zu profilieren (vgl. Info
Wissens zu verstehen.
4 und Abbildung 1: Niveau 5). Im internationalen
Niveau 1: Jugendliche, die Kompetenzniveau
Durchschnitt gehören 9,4 Prozent der Jugendlichen
1 erreichen, verfügen bestenfalls über rudi-
zu dieser Elite. In Australien, Kanada, Finnland, Neu-
mentäre Lesekompetenzen. Sie können zwar
seeland und Grossbritannien verfügen mehr als 15
in einfachen Texten einzelne Informationen
Prozent der Jugendlichen über ausgezeichnete Lese-
ermitteln und diese mit dem bestehenden Wis-
kompetenzen, in Belgien, Irland und in den USA
sen verbinden. Es gelingt ihnen aber nur unge-
rund 12 Prozent.
nügend, das Lesen für das Lernen zu nutzen.
Von den Schweizer Jugendlichen erreichen 9,2
Prozent das höchste Kompetenzniveau im Lesen.
BFS/EDK 2001 FÜR DAS LEBEN GERÜSTET ?
SEITE 14
DIE SCHWEIZ IM INTERNATIONALEN VERGLEICH
Ähnlich hoch sind die Anteile an sehr guten Leserin-
zudem in der Lage sind, ihr Lernen mittels geeigne-
nen und Lesern in Schweden (11,2 Prozent), Japan
ten Strategien selbst zu regulieren, erreichen in der
(9,9 Prozent), Deutschland (8,8 Prozent), Österreich
Schule nicht nur bessere Leistungen, sondern sind
(8,8 Prozent) und Frankreich (8,5 Prozent). Wesent-
generell besser auf das Lernen im Leben vorbereitet.
lich geringer als in der Schweiz ist der Anteil sehr
Das Interesse am lebenslangen Lernen zu wecken
guter Leserinnen und Leser in Italien (5,3 Prozent). In
gehört zu den Hauptaufgaben der Schule.
Russland, Spanien und Portugal liegen die Anteile
Der innerhalb von PISA erstmals durchgeführte
internationale Vergleich zum selbst regulierten Ler-
gar unter 5 Prozent.
nen deckte einige Schwächen der Schweizer JugendSchwierigkeiten beim Reflektieren
lichen auf. Das Interesse am Lesen und an der
und Beurteilen von Texten
Mathematik ist bei den 15-Jährigen in der Schweiz
Am meisten Schwierigkeiten im Lesen hatten die
im Vergleich zu Ländern wie Dänemark, Finnland
Schweizer Jugendlichen bei Aufgaben, die eine Re-
und Schweden nicht sonderlich ausgeprägt. Etwas
flexionsleistung verlangten, um einen Text kritisch
besser sieht es bei der Anwendung von Lernstrate-
beurteilen zu können. Deutlich weniger Mühe hatten
gien aus. Die Schweizer Schülerinnen und Schüler
sie bei Aufgaben, bei denen die Informationen im
bewegen sich im internationalen Durchschnitt, wenn
Text lokalisiert werden mussten oder bei Aufgaben,
es beim Lesen von Texten darum geht, (a) sich neue
die eine Interpretationsleistung erforderten. Verste-
Informationen im Gedächtnis einzuprägen (Memo-
hen und Interpretieren sind Voraussetzungen für
rierstrategien), (b) neue Informationen in bestehen-
Reflektieren und Beurteilen. Den komplexen Fähig-
de Wissensstrukturen zu integrieren (Elaborations-
keiten wird im Sprachunterricht in der Schweiz – im
strategien) und (c) das eigene Lernen zu überprüfen
Vergleich zu anderen Ländern – vermutlich weniger
(Kontrollstrategien).
Die Ergebnisse des internationalen Vergleichs zum
Beachtung geschenkt.
selbst regulierten Lernen sind allerdings nicht ganz
Kein besonderes Interesse am Lernen
einfach zu interpretieren, weil sie zum einen auf
Interesse am Lernen ist eine notwendige Vorausset-
Grund von Selbsteinschätzungen der Jugendlichen
zung für erfolgreiches Lernen. Jugendliche, die
zu Stande gekommen und zum andern auch kulturell
ABBILDUNG 2:
Nutzung des Computers der 15-Jährigen in der Schule und zu Hause, 2000
Dänemark
Finnland
Schweden
USA
Schweiz
Deutschland
0%
10%
20%
30%
40%
50%
60%
70%
80%
90%
100%
Nutzung mehrmals pro Woche
in der Schule
zu Hause
© BFS/EDK
BFS/EDK 2001 FÜR DAS LEBEN GERÜSTET ?
SEITE 15
DIE SCHWEIZ IM INTERNATIONALEN VERGLEICH
geprägt sind. So schätzen die Jugendlichen in Südkorea ihr Interesse am Lesen und an der Mathematik
vergleichsweise als gering ein, obwohl sie ausgezeichnete Leistungen erreichen. Innerhalb eines Landes sind die Zusammenhänge zwischen den Merkmalen des selbst regulierten Lernens und den
erreichten Leistungen allerdings positiv: Interessierte
Jugendliche, die den Lehr-Lern-Prozess durch den
Gebrauch von Lernstrategien unterstützen, erreichen
auch bessere Leistungen, sowohl in Südkorea als
auch in der Schweiz.
Keine Angst vor dem Computer
63 Prozent der 15-Jährigen in der Schweiz nutzen
den Computer mehrmals pro Woche und 43 Prozent
gehen mehrmals pro Woche aufs Internet (vgl.
Abbildung 2). Ähnlich gross sind die Anteile der 15Jährigen in den USA, in Finnland, Deutschland und
Dänemark. In Schweden hingegen nutzen über 80
Prozent der Jugendlichen den Computer mehrmals
pro Woche und 77 Prozent gehen mehrmals pro
Woche ins Internet. Die Schule spielt für die Nutzung
des Computers allerdings nur eine untergeordnete
Rolle. In sämtlichen Ländern wird der Computer
mehrheitlich zu Hause gebraucht. In der Schweiz
sind es nur gerade 21 Prozent der 15-Jährigen, die
den Computer in der Schule mehrmals pro Woche
nutzen. Einzig in Deutschland ist die regelmässige
Nutzung des Computers in der Schule noch geringer
als in der Schweiz, während sie in den USA (30 Prozent), Schweden (45 Prozent), Finnland (46 Prozent)
und Dänemark (57 Prozent) höher ist. Die vergleichsweise geringe Nutzung des Computers in
Schweizer Schulen ist wahrscheinlich eine Folge der
mangelnden Ausstattung. Am Interesse für den
Computer fehlt es hingegen den Schweizer Schülerinnen und Schülern erfreulicherweise nicht. Dieses
ist in der Schweiz vorhanden, wenn auch bei den
Mädchen deutlich weniger als bei den Knaben. Einzig in den USA und in Deutschland schätzen die
Jugendlichen das Interesse am Computer noch höher
ein als in der Schweiz. Leider hat ein grosser Teil der
Länder an der Umfrage zur Vertrautheit im Umgang
mit dem Computer nicht teilgenommen, weshalb
sich der internationale Vergleich nur auf wenige Länder beziehen kann.
BFS/EDK 2001 FÜR DAS LEBEN GERÜSTET ?
SEITE 16
Sprachregionale
Besonderheiten
Die Schweiz stellt mit ihrer kulturellen und sprach-
Das unterschiedliche Alter der Jugendlichen in
lichen Vielfalt innerhalb des internationalen Ver-
den 9. Klassen scheint sich nicht in hohem Masse auf
gleichs von Schulleistungen eine Besonderheit dar.
die Lesekompetenz auszuwirken. In der Deutsch-
Die Ergebnisse der Schweiz stammen von Jugend-
schweiz liegt der Anteil der Schülerinnen und Schü-
lichen, die zum Teil sehr unterschiedliche Bildungs-
ler, die kaum oder nur schlecht lesen können, mit
systeme durchlaufen haben. So liegt beispielsweise
rund 6 Prozent zwar etwas höher als in der italieni-
zwischen dem Alter beim Schuleintritt im Tessin und
schen und in der französischen Schweiz (vgl. Abbil-
in der Deutschschweiz beinahe ein Jahr. Die Jugend-
dung 3: Niveau kleiner als 1 oder Niveau 1). Mit über
lichen in der Deutschschweiz sind in der 9. Klasse
8 Prozent ist aber auch der Anteil sehr kompetenter
rund zehn Monate älter als jene in der italienischen
Leserinnen und Leser (Niveau 5) in der Deutsch-
Schweiz und rund vier Monate älter als jene in der
schweiz am höchsten.
In der Mathematik und in den Naturwissenschaf-
französischen Schweiz.
Durch die Variation der Merkmale von Bildungs-
ten erreichen die Jugendlichen der 9. Klassen unter-
systemen besteht ein Interesse am Vergleich des Bil-
schiedliche Resultate zwischen der italienischen
dungsstands am Ende der Sekundarstufe I innerhalb
Schweiz, der Deutschschweiz und der französischen
der Schweiz. Dazu wurden die Leistungen der
Schweiz. Inwieweit diese Ergebnisse durch das Alter
Jugendlichen in den 9. Klassen sprachregional ver-
bedingt sind oder ob auch andere Besonderheiten
glichen, obschon die Ausgangsbedingungen durch
der Bildungssysteme eine Rolle spielen, werden ver-
das unterschiedliche Schuleintrittsalter nicht iden-
tiefte Analysen zeigen müssen.
tisch sind.
ABBILDUNG 3:
Verteilung der Jugendlichen in der 9. Klasse auf die Kompetenzniveaus im Lesen
in den drei untersuchten Sprachregionen der Schweiz, 2000
Deutschschweiz
Französische Schweiz
Italienische Schweiz
0%
Niveau < 1
20%
Niveau 1
40%
Niveau 2
60%
Niveau 3
80%
Niveau 4
100%
Niveau 5
© BFS/EDK
BFS/EDK 2001 FÜR DAS LEBEN GERÜSTET ?
SEITE 17
Potenzial
für die Zukunft
Gründe für das Ergebnis der Schweiz
Finnland in allen drei geprüften Kompetenzen Spit-
«Gut in Mathematik, mittelmässig im Lesen und in
zenergebnisse, obwohl sie mit 15 Jahren etwa gleich
den Naturwissenschaften» – ein Urteil, das nach
lange zur Schule gegangen sind wie die Jugendlichen
Erklärung verlangt: Weshalb erreichen die Schweizer
aus der Schweiz.
Schülerinnen und Schüler nicht in allen drei geprüften Kompetenzen sehr gute Leistungen? Diese Frage
Bildungsferne Familien
lässt sich zwar nicht hinreichend beantworten, doch
Unser Bildungssystem hat die Voraussetzungen dafür
auf Grund einiger vertiefter Analysen zu den Ergeb-
zu schaffen, dass alle Kinder und Jugendlichen, unab-
nissen der Schweiz gibt es zumindest deutliche
hängig von ihrem sozialen und ökonomischen Hinter-
Anhaltspunkte, in welchen Bereichen für das schwei-
grund, Bildungsangebote wahrnehmen können, die
zerische Bildungssystem ein noch nicht ausgeschöpf-
ihren Fähigkeiten entsprechen. Vom Bildungssystem
tes Leistungspotenzial der Schülerinnen und Schüler
wird erwartet, dass es den Schülerinnen und Schülern
vorhanden ist. Bevor auf Grund der Ergebnisse im
ermöglicht, ihr Leistungspotenzial optimal auszu-
internationalen Vergleich Rückschlüsse auf die Qua-
schöpfen. Wie gut dies gelingt, hängt zu einem gros-
lität des Schweizer Bildungssystems gemacht wer-
sen Teil davon ab, inwieweit die Schule in der Lage ist,
den, sollten zumindest die Bedingungen, unter
die ungünstigen Lernvoraussetzungen von Kindern
denen der Lehr-Lern-Prozess stattfindet, genauer
und Jugendlichen zu kompensieren.
beschrieben werden.
Ungünstige Lernvoraussetzungen als Folge der
sozialen Herkunft zeigen sich insbesondere in der
Späte Einschulung
Ausbildung der Eltern, im Beruf und in der Erwerbs-
Bei internationalen Vergleichen wird immer wieder
tätigkeit der Eltern sowie in der Bildungsnähe des
deutlich, dass die Einschulung in der Schweiz – vor
Elternhauses. Mit Bildungsnähe sind einerseits eine
allem in der Deutschschweiz – vergleichsweise spät
Affinität der Eltern zu Büchern, zu klassischer Litera-
erfolgt. Während die Jugendlichen in den OECD-
tur und zu Kunstwerken gemeint, aber auch die
Ländern im Alter von 15 Jahren im Durchschnitt
Bereitschaft der Eltern, mit ihren Kindern Diskussio-
bereits 9,5 Jahre die Schule besucht haben, sind es in
nen über soziale, politische oder kulturelle Themen
der Schweiz erst knapp 9 Schuljahre (vgl. Tabelle 2).
zu führen. Andererseits gehören zur Bildungsnähe
Die vergleichsweise geringe Anzahl besuchter
auch Ressourcen wie der Zugang zum Internet oder
Schuljahre im Alter von 15 Jahren vermag die mittel-
ein ruhiger Platz zum Lernen.
mässigen Ergebnisse im Lesen und in den Naturwis-
Jugendliche mit guten Ergebnissen in den drei
senschaften allerdings nur bedingt zu erklären. Tat-
geprüften Kompetenzen wachsen in einem Eltern-
sächlich besucht die Mehrheit der Schülerinnen und
haus auf, das sich durch Bildungsnähe auszeichnet.
Schüler aus Ländern mit besseren Ergebnissen im
Die Bildungsnähe des Elternhauses erweist sich als
Lesen und in den Naturwissenschaften die Schule um
äusserst wichtig für die fachlichen Kompetenzen,
meist ein halbes bis ein ganzes Jahr länger als Schü-
wobei sie für den Erfolg im Lesen und in den Natur-
lerinnen und Schüler aus der Schweiz (Kanada, Neu-
wissenschaften noch die grössere Bedeutung hat als
seeland, Australien, Südkorea, Grossbritannien,
für gute Mathematikleistungen. Die für den Lerner-
Japan oder Österreich). Es gibt allerdings auch Aus-
folg günstige Umgebung zu Hause wird vor allem
nahmen, die zeigen, dass das Alter bei der Einschu-
von gut ausgebildeten Eltern ermöglicht.
lung nicht zwingend für das Ergebnis eines Landes
Eine nicht zu unterschätzende Bedeutung für
verantwortlich ist. So erreichen die Jugendlichen aus
hohe Kompetenzen im Lesen hat aber auch der
BFS/EDK 2001 FÜR DAS LEBEN GERÜSTET ?
SEITE 18
POTENZIAL FÜR DIE ZUKUNFT
Die Ergebnisse über Zusammenhänge zwischen
TABELLE 2:
Anzahl in der Schule verbrachte
Jahre bis zum Testzeitpunkt im
15. Altersjahr, 2000
verschiedenen Merkmalen der sozialen Herkunft von
Jugendlichen und ihren Leistungen in Lesen, Mathematik und Naturwissenschaften zeigen, dass es den
Schulen in der Schweiz nicht gelingt, den Einfluss der
Brasilien
8.5
unterschiedlichen Lernvoraussetzungen auf die Leis-
Liechtenstein
8.9
tungen aufzuheben.
Finnland
8.9
Schweiz
8.9
INFO 5
Herkunft und Schulerfolg
Dänemark
9.0
Schweden
9.0
Polen
9.0
Die schlechteren Schulleistungen von Jugend-
Luxemburg
9.1
lichen aus bildungsfernen Familien werden
Deutschland
9.1
häufig unter dem Stichwort mangelnde Chan-
Ungarn
9.2
cengleichheit diskutiert. Aber nicht allein die
Portugal
9.3
Qualität von Bildungsangeboten, sondern ins-
Mexiko
9.4
besondere die Unterstützung durch das
Lettland
9.4
Elternhaus beeinflusst in entscheidendem
Österreich
9.4
Masse die Entwicklungschancen von Kindern
Irland
9.5
und Jugendlichen.
Frankreich
9.5
Die OECD sieht im engen Zusammenhang
Tschechien
9.5
zwischen der sozialen Herkunft und den Leis-
USA
9.5
tungen in Lesen, Mathematik und Naturwis-
Belgien
9.6
senschaften auch ein Problem der mangeln-
Russland
9.7
den Ausschöpfung des Leistungspotenzials
Spanien
9.7
einer Gesellschaft. In Anlehnung an die Bil-
Kanada
9.8
dungsökonomie werden aus einer gesell-
Italien
9.9
schaftlichen Perspektive Wissen und Fähigkeiten auch als Humankapital bezeichnet.
10.0
Kinder werden in unterschiedlicher Weise
Japan
10.0
mit Ressourcen ausgestattet, die für das
Island
10.0
Humankapital bzw. für die Nutzung des Bil-
Norwegen
10.0
dungsangebots von entscheidender Bedeu-
Griechenland
10.1
tung sind. Zu den Ressourcen zählt nicht nur
Australien
10.1
das ökonomische Kapital, beispielsweise in
Grossbritannien
10.7
Form von finanziellen Mitteln, Macht oder
Südkorea
Prestige, sondern auch das kulturelle und
Neuseeland
11.0
soziale Kapital. Beim kulturellen Kapital handelt es sich beispielsweise um Bildungszerti-
© BFS/EDK
fikate oder Gegenstände mit kultureller
Bedeutung wie Bücher und Bilder. Beim so-
Berufsstatus der Eltern. Väter und Mütter, die einen
zialen Kapital handelt es sich um Netzwerke
Beruf mit hohem Prestige und entsprechendem
sozialer Beziehungen, die den Zugang zur Bil-
Gehalt ausüben, garantieren zu Hause ein bildungs-
dung erleichtern. Ökonomisches, kulturelles
nahes Umfeld, und ihre Kinder erreichen bessere
und soziales Kapital erweitern den Hand-
Leseleistungen. Innerhalb der OECD-Länder sind in
lungsspielraum von Personen und beeinflus-
Belgien, Deutschland und in der Schweiz die Lese-
sen ihre sozioökonomische Stellung positiv,
kompetenzen am deutlichsten vom Berufsstatus der
was sich auf die Nutzung des Bildungsange-
Eltern geprägt.
BFS/EDK 2001 FÜR DAS LEBEN GERÜSTET ?
SEITE 19
POTENZIAL FÜR DIE ZUKUNFT
sprachigen Sozialisation eigentlich zu erwarten wäre.
bots ebenfalls günstig auswirkt. Zur Steige-
Allerdings gibt es auch einen kleinen Teil Jugend-
rung des Humankapitals lohnen sich deshalb
licher, der über gute oder gar ausgezeichnete Lese-
auch Investitionen in kulturelles und soziales
kompetenzen in der Unterrichtssprache verfügt und
Kapital.
in der Lage ist, äusserst komplexe Texte zu verste-
Für die Bildungspolitik ist es insbesondere
hen. Dass die sprachliche Integration erfolgreich ver-
wichtig zu erfahren, ob der Zusammenhang
laufen kann, beweisen jene Schülerinnen und Schü-
zwischen sozialer Herkunft und Leistung in
ler, die sich höchste Kompetenzen im Verständnis der
allen Ländern ähnlich vorhanden ist, oder ob
Unterrichtssprache anzueignen vermochten (vgl.
er auf bestimmte Merkmale des Bildungs-
Abbildung 4). Mit zunehmender Verweildauer im
systems zurückzuführen ist.
Sprachgebiet nehmen zudem die Leistungsrückstände im Lesen, in der Mathematik und in den Naturwissenschaften ab. PISA zeigt, dass das Bildungs-
Benachteiligung für Jugendliche
system durch die kulturelle Vielfalt zwar zunehmend
aus immigrierten Familien
herausgefordert ist, trotzdem aber ausgezeichnete
Der Anteil Jugendlicher aus immigrierten Familien ist
Leistungen in Lesen, Mathematik und Naturwissen-
in der Schweiz in den letzten Jahren kontinuierlich
schaften von Jugendlichen aus immigrierten Familien
angestiegen und betrug im Jahr 2001 rund 21
möglich sind.
Prozent. Jugendliche aus immigrierten Familien sind
meist in mehrfacher Weise benachteiligt. Zunächst
erhalten sie aus dem Elternhaus keine ausreichende
Unterstützung und Förderung, meist fehlt den Eltern
auch die Kenntnis des hiesigen Bildungssystems und
INFO 6
Muttersprache –
Unterrichtssprache
zudem sind die Jugendlichen durch ihre sprachlichen
Schwierigkeiten in besonderem Masse gefordert, um
Bei der Interpretation der Ergebnisse von
dem Unterricht in sämtlichen Fächern folgen zu
Jugendlichen aus immigrierten Familien muss
können.
berücksichtigt werden, dass die Unterrichts-
Diese Benachteiligung schlägt sich sowohl im
sprache in der Schweiz für diese Schülerinnen
Lesen als auch in der Mathematik und in den Natur-
und Schüler der ersten Fremdsprache ent-
wissenschaften nieder. Rund ein Viertel der Jugend-
spricht. Aus diesem Grund führen die Ergeb-
lichen aus immigrierten Familien verstehen die in
nisse aus einem Test in der Unterrichtssprache
PISA verwendeten Texte nicht und verfügen kaum
nicht zu einer Beurteilung der Lesekompe-
über die grundlegenden Fähigkeiten und Fertigkei-
tenz, sondern sie zeigen, wie gut diese
ten im Lesen von Texten in der Unterrichtssprache.
Jugendlichen Texte in der ersten Fremdspra-
Ein weiteres Viertel hat ernsthafte Schwierigkeiten,
che verstehen. Der gleiche Test in der Mutter-
einfache Texte in der Unterrichtssprache zu verste-
sprache würde vermutlich zu anderen Ergeb-
hen. Auch in der Mathematik und in den Naturwis-
nissen führen. Aus der Sicht der Betroffenen
senschaften weisen die Jugendlichen aus immigrier-
misst der PISA-Test bei einheimischen Jugend-
ten Familien deutliche Leistungsrückstände auf. Die-
lichen und solchen aus immigrierten Familien
ses Ergebnis macht offenkundig, dass unser Bil-
nicht das Gleiche. Aus einer bildungspoliti-
dungssystem vor einer grossen Herausforderung
schen Perspektive mit dem Ziel der Integra-
steht: der optimalen schulischen Integration der
tion von Jugendlichen aus immigrierten Fami-
meist mehrsprachig aufwachsenden Jugendlichen
lien ist der Vergleich aber notwendig. Denn
aus immigrierten Familien.
die Kenntnis der jeweiligen Landessprache ist
Weil ihre Familien meist ökonomisch schlechter
eine unabdingbare Voraussetzung für die
gestellt sind, ihre Eltern häufig über niedrige Bil-
schulische Integration sowie für die berufliche
dungsabschlüsse verfügen und das familiäre Umfeld
und höhere (Weiter-)Bildung, aber auch für
als bildungsfern zu bezeichnen ist, sind die faktischen
die Teilnahme am gesellschaftlichen und poli-
Leistungsrückstände der Jugendlichen aus immigrier-
tischen Leben.
ten Familien grösser, als es auf Grund ihrer mehr-
BFS/EDK 2001 FÜR DAS LEBEN GERÜSTET ?
SEITE 20
POTENZIAL FÜR DIE ZUKUNFT
ABBILDUNG 4:
Lesekompetenz in der 9. Klassenstufe nach Verweildauer im Sprachgebiet, 2000
Einheimische
Jugendliche
mehr als 12 Jahre
im Sprachgebiet
9 –12 Jahre im
Sprachgebiet
5– 8 Jahre im
Sprachgebiet
1– 4 Jahre im
Sprachgebiet
0%
Niveau < 1
20%
Niveau 1
40%
Niveau 2
60%
Niveau 3
80%
Niveau 4
100%
Niveau 5
© BFS/EDK
Unterschiedliche Zugänge von Knaben
Freizeit nicht für Bücher» – weitgehend für das
und Mädchen zur fachlichen Bildung
schlechte Selbstvertrauen Jugendlicher in die schuli-
Trotz vieler umgesetzter Massnahmen zur Gleich-
sche Leistungsfähigkeit verantwortlich sind.
stellung der Geschlechter in der Schule sind auch
Problematisch sind die festgestellten Unterschiede
heute noch Unterschiede in den Leistungen zwi-
bei Fachleistungen und Lernvoraussetzungen sowohl
schen Knaben und Mädchen nachweisbar, wenn
für Mädchen als auch für Knaben. Durch die mathe-
auch eher in geringem Ausmass: Knaben erreichen
matisch-naturwissenschaftliche Ausrichtung vieler
bessere Leistungen in Mathematik und Naturwis-
Berufsfelder, vor allem der anspruchsvolleren, erge-
senschaften, Mädchen haben Vorteile im Lesen. In
ben sich für die Mädchen schlechtere Berufsaussich-
der gleichen Richtung unterscheiden sich auch die
ten als für die Knaben. Problematisch sind aber auch
Lernvoraussetzungen zwischen Knaben und Mäd-
die schlechteren Lesekompetenzen von Knaben, weil
chen. Mädchen haben Spass am Lesen und schätzen
sie Nachteile beim Erwerb sozialer Kompetenzen
sich im Lesen auch durchschnittlich als kompetenter
bedeuten, die als «social skills» mit der zunehmen-
ein als Knaben. Diese hingegen interessieren sich
den Vernetzung unserer Gesellschaft unbedingt
deutlich stärker für mathematische und naturwis-
erforderlich sind.
senschaftliche Inhalte und schätzen auch ihre Kompetenzen in diesen Fachbereichen klar höher ein als
Wesentlich mehr Talente im Lesen
Mädchen.
bei den Mädchen
Die Ursachen für die Unterschiede in den indivi-
Abbildung 5 zeigt, wie viele Knaben und Mädchen in
duellen Lernvoraussetzungen liegen zu einem gros-
den drei geprüften Bereichen des Lesens «Informa-
sen Teil bei den Schülerinnen und Schülern selbst. Es
tionen aus einem Text heraussuchen», «Einen Text
wird vermutet, dass immer noch rollenspezifische
interpretieren» und «Über einen Text reflektieren
Verhaltensmuster und Stereotype – beispielsweise
sowie Form und Inhalt beurteilen» jeweils zu den
«Für Mädchen ist Mathematik nicht so wichtig wie
sehr kompetenten Leserinnen und Lesern oder zur
für Knaben» oder «Knaben interessieren sich in ihrer
Risikogruppe gehören.
BFS/EDK 2001 FÜR DAS LEBEN GERÜSTET ?
SEITE 21
POTENZIAL FÜR DIE ZUKUNFT
Die Unterschiede zwischen den Knaben und den
Mädchen hingegen ist wesentlich grösser. Besonders
Mädchen zeigen sich insbesondere bei den schlech-
eklatant sind die Unterschiede in den Leseleistungen
ten und bei den sehr guten Leserinnen und Lesern.
zwischen den Knaben und Mädchen im Bereich
Knaben gehören weit häufiger der Risikogruppe an,
«Reflektieren und Beurteilen». Mädchen kommen
je nach geprüftem Bereich zwischen rund 21 und 27
mit komplexen Texten und Anforderungen weit bes-
Prozent. Der Anteil sehr guter Leserinnen bei den
ser zurecht als Knaben.
ABBILDUNG 5:
Lesekompetenz von Knaben und Mädchen in der 9. Klassenstufe, 2000
Risikogruppe
Kompetenzniveau 1 und < 1
Reflektieren und
beurteilen
Texte interpretieren
Informationen aus
Texten heraussuchen
5%
0
5
10%
Mädchen
10
15%
Knaben
15
20%
25%
20
25
30%
30
© BFS/EDK
Sehr gute Leserinnen und Leser
Kompetenzniveau 5
ilen
Reflektieren und
beurteilen
ren
Texte interpretieren
hen
0%
Informationen aus
Texten heraussuchen
0%
5%
0
5
Mädchen
10%
15%
Knaben
15
10
20%
20
© BFS/EDK
BFS/EDK 2001 FÜR DAS LEBEN GERÜSTET ?
SEITE 22
Ausblick
Die ungleichen Lernvoraussetzungen für Kinder und
Analysen, die zur Erklärung der Ergebnisse der
Jugendliche unterschiedlicher sozialer und kultureller
Schweizer Jugendlichen beitragen werden. Berichte
Herkunft sowie für Knaben und Mädchen sind
über eine vertiefte Betrachtung dieser Ergebnisse
sowohl aus individueller als auch aus gesellschaft-
werden in den nächsten zwei Jahren regelmässig
licher Perspektive problematisch und verlangen nach
erscheinen und die internationale Standortbestim-
bildungspolitischen Massnahmen. Schlechte Lern-
mung in ein neues Licht setzen. Bereits in drei Jahren
voraussetzungen bedeuten meist nicht den Fähigkei-
werden die Ergebnisse des zweiten Zyklus von PISA
ten entsprechende Leistungen und demzufolge man-
präsentiert. Der Vergleich mit den heutigen Ergebnis-
gelhafte Ausschöpfung des vorhandenen Leistungs-
sen ist dann von grösstem Interesse, weil er Informa-
potenzials.
tionen über die Wirkungen der in der Schweiz einge-
Dies ist zum einen eine individuelle Tragik, weil
die Arbeitsmöglichkeiten für schlecht ausgebildete
Arbeitskräfte rückläufig sind. Ausreichende Kompe-
schlagenen Richtung in der Bildungspolitik geben
wird.
Die Schweizerische Konferenz der kantonalen
tenzen in den Kulturtechniken wie Lesen, Schreiben
Erziehungsdirektoren wird für unsere Bildungspolitik
und Mathematik sowie eine minimale naturwissen-
wesentliche Themen vertiefen, um daraus mögliche
schaftliche Grundbildung sind eine Voraussetzung
Massnahmen zu entwickeln.
für die erfolgreiche berufliche Laufbahn, aber auch
für die allgemeine und berufliche Weiterbildung,
ohne die mit den gesellschaftlichen und wirtschaftlichen Entwicklungen nicht mehr Schritt gehalten
werden kann. Zum andern hat die mangelnde Ausschöpfung des Leistungspotenzials auch gesellschaftliche Konsequenzen, weil ein hohes Bildungsniveau die Grundlage für den wirtschaftlichen Erfolg
eines Landes und das Bestehen im Wettbewerb auf
innovativen Märkten ist. Gerade dieses hohe
Bildungsniveau ist durch die Vernachlässigung der
Förderung von Kindern und Jugendlichen mit
ungünstigen Lernvoraussetzungen in hohem Masse
gefährdet.
Inwieweit die schlechten Lernvoraussetzungen
eines relativ grossen Anteils Jugendlicher für das
Ergebnis der Schweiz mitverantwortlich sind, kann
durch die hier vorgelegten Ergebnisse nicht gesagt
werden. Die auf den ersten Blick als plausibel
erscheinenden Erklärungen müssten durch internationale Vergleiche der Zusammenhänge zwischen
den Lernvoraussetzungen und den Leistungen erhärtet werden. PISA baut auf Kontinuität: die vorliegenden Ergebnisse bilden in diesem Sinne die Grundlage
für Hypothesen und sind Ausgangspunkt für weitere
BFS/EDK 2001 FÜR DAS LEBEN GERÜSTET ?
SEITE 23
Testbeispiele
Testbeispiel 1: Leseaufgabe
ERWERBSTÄTIGE BEVÖLKERUNG
Das folgende Baumdiagramm zeigt die Struktur der erwerbstätigen Bevölkerung bzw. der «Bevölkerung im
Erwerbsalter» eines Landes. Die Gesamtbevölkerung des Landes betrug 1995 etwa 3,4 Millionen.
Die Struktur der erwerbstätigen Bevölkerung Stand 31. März 1995 (in Tsd.) 1
Bevölkerung
im Erwerbsalter2
2656,5
Dem Arbeitsmarkt
zur Verfügung stehend
1706,5 64,2%
Dem Arbeitsmarkt nicht
zur Verfügung stehend3
949,9 35,8%
Beschäftigt
1578,4 92,5%
Vollzeit
1237,1 78,4%
Nicht beschäftigt
128,1 7,5%
Teilzeit
341,3 21,6%
Vollzeitbeschäftigung
suchend
101,6 79,3%
Vollzeitbeschäftigung
suchend
23,2 6,8%
Teilzeitbeschäftigung
suchend
26,5 20,7%
Keine Vollzeitbeschäftigung suchend
318,1 93,2%
Anmerkungen
1
Bevölkerungszahlen in Tausend (Tsd.).
2
Die Bevölkerung im Erwerbsalter ist definiert als Menschen zwischen 15 und 65 Jahren.
3
«Dem Arbeitsmarkt nicht zur Verfügung stehend» bezieht sich auf Personen, die nicht aktiv Arbeit suchen
und/oder für Arbeit nicht zur Verfügung stehen.
Quelle: D. Miller, Form 6 Economics, ESA Publications, Box 9453, Newmarket, Auckland NZ, p. 64.
BFS/EDK 2001 FÜR DAS LEBEN GERÜSTET ?
SEITE 24
TESTBEISPIELE
Benutze die Informationen auf der gegenüberliegenden Seite über die Erwerbsbevölkerung eines Landes, um
die nachstehenden Fragen zu beantworten.
Frage 1: ERWERBSTÄTIGE BEVÖLKERUNG
Wie viele Personen im Erwerbsalter standen dem Arbeitsmarkt nicht zur Verfügung? (Schreibe die Anzahl Personen, nicht den Prozentsatz.)
Frage 2: ERWERBSTÄTIGE BEVÖLKERUNG
Zu welchem Teil des Baumdiagramms, wenn überhaupt, würde jede in der Tabelle unten aufgelistete Person
gehören?
Antworte, indem du jeweils beim zutreffenden Kästchen in der Tabelle ein Kreuz machst. Das erste Kreuz
Unter keine Kategorie fallend
zur Verfügung stehend»
«Dem Arbeitsmarkt nicht
stehend: nicht beschäftigt»
«Dem Arbeitsmarkt zur Verfügung
stehend: beschäftigt»
«Dem Arbeitsmarkt zur Verfügung
wurde bereits für dich gemacht.
Ein Teilzeitkellner, 35 Jahre
x
■
■
■
■
Eine Geschäftsfrau, 43 Jahre,
■
■
■
■
Ein Vollzeitstudent, 21 Jahre
■
■
■
■
Ein Mann, 28 Jahre, der vor kurzem sein
■
■
■
■
■
■
■
■
■
■
■
■
mit einer 60-Stunden-Woche
Geschäft verkauft hat und jetzt Arbeit sucht
Eine Frau, 55 Jahre, die nie berufstätig war
oder sein wollte
Eine Grossmutter, 80 Jahre, die immer noch
jeden Tag ein paar Stunden am Marktstand
ihrer Familie arbeitet
BFS/EDK 2001 FÜR DAS LEBEN GERÜSTET ?
SEITE 25
TESTBEISPIELE
Frage 3: ERWERBSTÄTIGE BEVÖLKERUNG
Stelle dir vor, diese Information über die Struktur der erwerbstätigen Bevölkerung würde jedes Jahr in einem
Baumdiagramm wie diesem veröffentlicht.
Unten sind vier Bestandteile des Baumdiagramms aufgelistet. Gib an, ob du erwarten würdest, dass diese
Bestandteile sich von Jahr zu Jahr ändern oder nicht, indem du «Veränderung» oder «Keine Veränderung»
einkreist. Der erste Kreis wurde schon für dich gemacht.
Bestandteile des Baumdiagramms
Antwort
Die Beschriftung in jedem Kästchen
Veränderung / Keine Veränderung
(z.B. «Dem Arbeitsmarkt zur Verfügung stehend»)
Die Prozentsätze (z.B. «64,2%»)
Veränderung / Keine Veränderung
Die Zahlen (z.B. «2656,5»)
Veränderung / Keine Veränderung
Die Fussnoten unter dem Baumdiagramm
Veränderung / Keine Veränderung
Frage 4: ERWERBSTÄTIGE BEVÖLKERUNG
Die Informationen über die Struktur der erwerbstätigen Bevölkerung werden als Baumdiagramm dargestellt,
hätten aber auch auf verschiedene andere Arten dargestellt werden können, etwa als schriftliche Beschreibung, als Tortendiagramm, als Balkendiagramm oder als Tabelle.
Das Baumdiagramm wurde wahrscheinlich gewählt, weil es sich besonders gut eignet für die Darstellung
A der Veränderungen im Zeitverlauf.
B der Grösse der Gesamtbevölkerung des Landes.
C der Kategorien innerhalb jeder Gruppe.
D der Grösse jeder Gruppe.
Testbeispiel 2: Mathematikaufgabe
GESCHWINDIGKEIT EINES RENNWAGENS
Dieses Diagramm zeigt, wie die Geschwindigkeit eines Rennwagens während seiner zweiten Runde auf einer
drei Kilometer langen ebenen Rennstrecke variiert.
Geschwindigkeit eines Rennwagens auf einer 3 km Rundstrecke (2. Runde)
180
160
140
Geschwindigkeit (km/h)
120
100
80
60
40
20
0.5
1.5
2.5
0
0
0.2
0.4
0.6
0.8
1
1.2
Startlinie
BFS/EDK 2001 FÜR DAS LEBEN GERÜSTET ?
1.4
1.6
1.8
2
2.2
2.4
2.6
2.8
3
Entfernung vom Startpunkt der Bahn (km)
SEITE 26
TESTBEISPIELE
Frage 1: GESCHWINDIGKEIT EINES RENNWAGENS
Wie gross ist die ungefähre Entfernung von der Startlinie bis zum Beginn des längsten geraden Abschnitts der
Rennstrecke?
A 0,5 km
B 1,5 km
C 2,3 km
D 2,6 km
Frage 2: GESCHWINDIGKEIT EINES RENNWAGENS
Wo wurde während der zweiten Runde die geringste Geschwindigkeit aufgezeichnet?
A an der Startlinie
B bei etwa 0,8 km
C bei etwa 1,3 km
D etwa nach der halben Runde
Frage 3: GESCHWINDIGKEIT EINES RENNWAGENS
Was kannst du über die Geschwindigkeit des Wagens zwischen den Markierungen von 2,6 km und 2,8 km
sagen?
A Die Geschwindigkeit des Wagens bleibt konstant.
B Die Geschwindigkeit des Wagens nimmt zu.
C Die Geschwindigkeit des Wagens nimmt ab.
D Die Geschwindigkeit des Wagens kann anhand des Diagramms nicht bestimmt werden.
Frage 4: GESCHWINDIGKEIT EINES RENNWAGENS
Hier siehst du Abbildungen von fünf Rennstrecken:
Auf welcher dieser Rennstrecken fuhr der Wagen, sodass das am Anfang gezeichnete Geschwindigkeitsdiagramm entstand?
S
S
B
A
S
C
S
D
S
E
S = Startlinie
BFS/EDK 2001 FÜR DAS LEBEN GERÜSTET ?
SEITE 27
TESTBEISPIELE
Testbeispiel 3: Aufgabe in Naturwissenschaften
SEMMELWEIS’ TAGEBUCH
Text 1
«Juli 1846. Nächste Woche trete ich meine Stelle als ‹Herr Doktor› auf der ersten Station der Entbindungsklinik im Allgemeinen Krankenhaus von Wien an. Ich war entsetzt, als ich vom Prozentsatz verstorbener Patienten in dieser Klinik hörte. In diesem Monat starben dort sage und schreibe 36 von 208 Müttern, alle an Kindbettfieber. Ein Kind zur Welt zu bringen ist genauso gefährlich wie eine Lungenentzündung ersten Grades.»
Todesfälle je 100 Geburten
wegen Kindbettfiebers
Diese Zeilen aus dem Tagebuch von Ignaz Semmel15
weis (1818–1865) illustrieren die verheerenden Aus-
10
Anzahl Todesfälle
wirkungen des Kindbettfiebers, einer ansteckenden
Erste
Station
Krankheit, an der viele Frauen nach der Geburt eines
Kindes starben. Semmelweis sammelte sowohl auf
der ersten wie auf der zweiten Station Informationen
über die Anzahl Todesfälle aufgrund von Kindbett-
5
Zweite
Station
1841
1842
1843
fieber (vgl. Diagramm 3).
1844
1845
1846
Die Ärzte, darunter auch Semmelweis, tappten in bezug auf die Ursache des Kindbettfiebers völlig im Dunkeln.
Semmelweis schrieb:
«Dezember 1846. Warum sterben so viele Frauen nach einer völlig problemlosen Geburt an diesem Fieber?
Seit Jahrhunderten lehrt uns die Wissenschaft, es handle sich um eine unsichtbare Epidemie, die Mütter tötet.
Als mögliche Ursachen gelten Veränderungen in der Luft, irgendwelche ausserirdischen Einflüsse oder eine
Bewegung der Erde, ja selbst ein Erdbeben.»
Heutzutage würde kaum jemand ausserirdische Einflüsse oder ein Erdbeben als mögliche Ursachen für Fieber
in Erwägung ziehen. Mittlerweile wissen wir, dass die hygienischen Bedingungen eine wichtige Rolle spielten.
Zu Lebzeiten von Semmelweis glaubten allerdings viele, auch Wissenschaftler, an solche Erklärungen! Semmelweis wusste jedoch, dass ausserirdische Einflüsse oder ein Erdbeben als Ursachen für Fieber eher unwahrscheinlich waren. Anhand der unterschiedlichen Sterblichkeitsraten auf den beiden Stationen an der Klinik versuchte er, seine Kollegen davon zu überzeugen.
Text 2
Zur Forschung in den Krankenhäusern gehörte das Sezieren. Der Körper einer verstorbenen Person wurde
geöffnet, um die Todesursache herauszufinden. Semmelweis schrieb, dass auf der Ersten Station tätige Studenten üblicherweise am Sezieren von Frauen teilnahmen, die am Vortag gestorben waren. Direkt anschliessend untersuchten sie Frauen, die gerade ein Kind geboren hatten. Sie achteten nicht besonders darauf, sich
nach dem Sezieren zu waschen. Manche waren sogar stolz darauf, dass man riechen konnte, dass sie vorher in
der Leichenhalle gearbeitet hatten, weil man daran ihren Fleiss erkennen konnte!
Ein Freund von Semmelweis starb, nachdem er sich beim Sezieren geschnitten hatte. Eine Obduktion seines
Leichnams zeigte, dass er dieselben Symptome aufwies wie Mütter, die an Kindbettfieber gestorben waren.
Dadurch bekam Semmelweis eine neue Idee.
BFS/EDK 2001 FÜR DAS LEBEN GERÜSTET ?
SEITE 28
TESTBEISPIELE
Frage 1: SEMMELWEIS’ TAGEBUCH
Nimm an, du wärst Dr. Semmelweis. Nenne einen Grund dafür (ausgehend von den Informationen, die er
sammelte), dass Erdbeben als Ursache für Kindbettfieber unwahrscheinlich sind.
Frage 2: SEMMELWEIS’ TAGEBUCH
Semmelweis‘ neue Idee stand im Zusammenhang mit dem hohen Prozentsatz verstorbener Frauen auf den
Entbindungsstationen und dem Verhalten der Studenten.
Was war seine Idee?
A Wenn man die Studenten veranlasst, sich nach dem Sezieren zu waschen, sollte das Kindbettfieber zurückgehen.
B Die Studenten sollten nicht beim Sezieren mitwirken, weil sie sich schneiden könnten.
C Die Studenten riechen übel, weil sie sich nach dem Sezieren nicht waschen.
D Die Studenten wollen ihren Fleiss unter Beweis stellen und sind deshalb beim Untersuchen der Frauen
unachtsam.
Frage 3: SEMMELWEIS’ TAGEBUCH
Semmelweis‘ Versuche, die Anzahl Todesfälle aufgrund von Kindbettfieber zu senken, zeigten Erfolg. Aber
selbst heute bleibt Kindbettfieber eine Krankheit, die sich schwer ausmerzen lässt.
Schwer zu heilende Arten von Fieber sind in den Krankenhäusern immer noch ein Problem. Durch zahlreiche
Routinemassnahmen wird das Problem unter Kontrolle gehalten. Zu diesen Massnahmen zählt das Waschen
der Bettwäsche bei hoher Temperatur.
Erkläre, warum das Waschen der Bettwäsche bei hoher Temperatur dazu beiträgt, das Risiko, dass Patienten
Fieber bekommen, zu senken.
Frage 4: SEMMELWEIS’ TAGEBUCH
Viele Krankheiten können durch den Einsatz von Antibiotika geheilt werden. In den letzten Jahren hat jedoch
die Wirksamkeit einiger Antibiotika gegen Kindbettfieber nachgelassen.
Worauf ist das zurückzuführen?
A Nach ihrer Herstellung verlieren Antibiotika allmählich ihre Wirksamkeit.
B Bakterien werden gegen Antibiotika widerstandsfähig.
C Diese Antibiotika sind nur gegen Kindbettfieber, nicht jedoch gegen andere Krankheiten wirksam.
D Der Bedarf an diesen Antibiotika hat nachgelassen, weil sich die Bedingungen im Gesundheitswesen in
den letzten Jahren beträchtlich verbessert haben.
BFS/EDK 2001 FÜR DAS LEBEN GERÜSTET ?
SEITE 29
Für das Leben gerüstet?
Die Grundkompetenzen der Jugendlichen – Kurzfassung des nationalen Berichtes PISA 2000
Impressum
Herausgeber
Internet
Bundesamt für Statistik (BFS) und Schweizerische
Diese Broschüre befindet sich auf Internet unter
Konferenz der kantonalen Erziehungsdirektoren
www.pisa.admin.ch
(EDK)
Sprachversionen
Autor
Diese Broschüre ist auch in französischer
Urs Moser, Kompetenzzentrum für Bildungs-
(474-0000), italienischer (475-0000) und
evaluation und Leistungsmessung an der
englischer (476-0000) Sprache verfügbar.
Universität Zürich (KBL)
Titelgrafik/Grafik/Layout
Auskunft
eigenart, Büro für Layout und Gestaltung,
Andrea Meyer, BFS, Sektion Schul-
Stefan Schaer, Bern
und Berufsbildung, Tel. 032 713 67 35,
E-Mail: [email protected]
Titelfoto
kontrast, Atelier für Fotografie,
Vertrieb
Thomas Wiedmer, Schönbühl-Urtenen
Bundesamt für Statistik
CH-2010 Neuchâtel
Druck
Tel. 032 713 60 60 / fax 032 713 60 61
Druckerei Paul Haupt AG, Bern
Bestellnummer
Copyright
473-0000
BFS/EDK, Neuchâtel 2001
Abdruck – ausser für kommerzielle Nutzung –
Preis
unter Angabe der Quelle gestattet.
Gratis
ISBN
Reihe
3-303-15245-4
Bildungsmonitoring Schweiz
BFS/EDK 2001 FÜR DAS LEBEN GERÜSTET ?
SEITE 30
Pilotage du système de formation en Suisse
Préparés pour la vie?
Les compétences de base des jeunes –
Synthèse du rapport national PISA 2000
Urs Moser
OCDE – PISA Programme International pour le Suivi des Acquis des élèves
Table des
matières
Préambule
page 4
Avant-propos
page 6
PISA dans les grandes lignes
page 8
La Suisse en comparaison internationale
page 11
Spécificités propres
aux régions linguistiques
page 17
Un potentiel pour le futur
page 18
Perspectives
page 23
Exemples de test
page 24
Editeurs
Office fédéral de la statistique (OFS) et
Conférence suisse des directeurs cantonaux
de l‘instruction publique (CDIP)
Préambule
Au cours de la dernière décennie, la
réforme du système éducatif, dans sa
substance comme dans ses structures, a
été au centre de la politique de l’éducation en Suisse. Cette réforme a pour but
de doter les futures générations de compétences nouvelles afin de leur permettre de répondre aux défis multiples
de la société. Dans ce contexte, l’allongement du processus d’apprentissage
tout au long de la vie, la mesure et le
management de la qualité, l’utilisation
efficiente des ressources financières et
humaines ainsi que la mise en réseau
des informations pouvant servir de
bases de décision sont autant de thèmes
d’actualité.
L’assurance de la qualité appliquée au
système éducatif implique logiquement
que l’on commence par examiner les
résultats du processus d’apprentissage.
A cet égard, on peut considérer que
les compétences dont les élèves font
preuve à la fin de leur scolarité dans les
branches principales que sont la lecture,
les mathématiques et les sciences représentent la somme des acquis de leur
parcours scolaire. Une comparaison de
ces compétences avec celles obtenues
dans d’autres pays fournit de précieuses
informations sur les forces et les faiblesses du système éducatif national.
OFS/CDIP 2001 PRÉPARÉS POUR LA VIE ?
PAGE 4
La Suisse a par conséquent décidé de
participer au projet international PISA
(Programme International pour le Suivi
des Acquis des élèves). La décision était
d’autant plus facile à prendre que notre
pays pouvait s’appuyer sur une solide
expérience, acquise lors de projets antérieurs conçus dans la même optique
(TIMSS, IALS, p. ex.). Le cycle d’enquêtes PISA devant durer une dizaine
d’années, il permettra par ailleurs de
contrôler les effets des mesures prises
dans le domaine de l’éducation.
En Suisse, la réalisation du projet PISA
se caractérise par une étroite collaboration entre la Confédération (Office
fédéral de la statistique, OFS) et les
cantons (Conférence suisse des directeurs cantonaux de l’instruction publique, CDIP), par le biais d’un financement commun. Il est prévu de donner
une autre dimension à cette collaboration avec la publication, dans une série
spéciale, de faits, d’analyses, de concepts et d’indicateurs, qui s’avéreront
d’une très grande utilité pour l’assurance de la qualité du système éducatif.
Cette série sera éditée par l’OFS et la
CDIP.
La participation à un programme international de mesure des connaissances
PRÉAMBULE
comme PISA requiert des moyens financiers considérables et des compétences
scientifiques élevées. Dès lors, il y a
tout lieu de se féliciter de constater que
le projet a pu être mené à bien. Les
résultats dont nous disposons à présent
sur les compétences des élèves scolarisés en Suisse nous montrent toutefois la
nécessité de réaliser des analyses plus
poussées pour mieux comprendre comment fonctionne notre système éducatif
afin de mettre en route des mesures
concrètes. Nous appelons les responsables de la politique de l’éducation à
fournir les ressources indispensables à la
réalisation de ces analyses et au développement des compétences scientifiques requises.
Que toutes les personnes qui ont contribué à la réussite de PISA par leur engagement trouvent ici l’expression de nos
vifs remerciements.
LE GROUPE DE PILOTAGE PISA.ch
Martine Brunschwig Graf
Carlo Malaguerra
Conseillère d’Etat chargée du Département
Directeur de l’Office fédéral de la statistique,
de l’instruction publique de Genève
Neuchâtel
Ernst Buschor
Gerhard M. Schuwey
Conseiller d’Etat chargé du Département
Directeur de l’Office fédéral de l’éducation et
de l’instruction publique de Zurich
de la science, Berne
Hans Ambühl
Secrétaire général de la CDIP, Berne
OFS/CDIP 2001 PRÉPARÉS POUR LA VIE ?
PAGE 5
Avant-propos
Le projet PISA (Programme International
pour le Suivi des Acquis des élèves)
constitue pour les pays participants
l’occasion de dresser le bilan des compétences des jeunes au terme de leur
scolarité obligatoire. Ce bilan doit
notamment soulever des questions
fondamentales sur la politique sociale
et éducative du pays: Quelles connaissances et quel savoir-faire l’école doitelle transmettre aux élèves pour qu’ils
soient à même de participer pleinement
à la vie en société? Quels sont les
acquis dont ils doivent disposer pour
pouvoir faire face aux exigences du
monde actuel, à l’heure de la mondialisation et des nouvelles technologies?
Quels sont les points forts et les points
faibles relatifs des systèmes éducatifs en
comparaison internationale? Les résultats de l’enquête PISA 2000 fournissent
désormais de précieuses informations
pour débattre de ces questions.
La présente synthèse intitulée «Préparés
pour la vie?» se réfère au rapport national du même nom qui sera publié au
printemps 2002. Cette synthèse ne présente que les résultats principaux et
reprend les informations les plus importantes sur le projet PISA et certains
thèmes actuels dans la recherche sur
l’enseignement. L’OCDE publie égale-
OFS/CDIP 2001 PRÉPARÉS POUR LA VIE ?
PAGE 6
ment un premier rapport complet sur
PISA sous le titre de «Connaissances et
compétences: des atouts pour la vie».
La publication de ces deux rapports met
un terme provisoire au premier cycle du
projet PISA.
De nombreuses personnes et institutions
ont contribué à la réussite de l’étude
PISA 2000. Nous remercions particulièrement tous les élèves qui y ont pris
part en Suisse. Nos remerciements vont
également, pour la réalisation et l’organisation des tests, aux écoles, et plus
précisément aux personnes chargées de
la coordination dans ces dernières, aux
responsables de la passation des tests
ainsi qu’aux centres de coordination
régionaux, qui ont parfaitement orchestré la réalisation de l’enquête au niveau
régional. La Confédération et les cantons assurent le financement national
et sa gestion stratégique par l’intermédiaire de leurs représentants dans le
groupe de pilotage. Par ailleurs, différentes entités soutiennent activement la
direction nationale du projet au niveau
de la conception, du contenu et de la
méthodologie. Nous adressons à ce
sujet nos remerciements aux experts
membres du réseau PISA qu’ils soient
scientifiques, politiques ou praticiens,
aux didacticiens pour leur participation
AVANT-PROPOS
active au développement du matériel de
test, au groupe d’échantillonnage pour
l’établissement et le tirage de l’échantillon, aux chercheurs du réseau d’analyse pour la conception d’une stratégie
d’évaluation cohérente pour PISA 2000
ainsi qu’aux personnes chargées de la
rédaction du premier rapport national.
Nos remerciements vont également au
secrétariat à l’OCDE du programme
PISA pour l’organisation et la coordination internationales du projet global,
à la commission des pays participants
(Board of participating countries) à
laquelle incombent les principales décisions et, par conséquent, la responsabilité politique et, enfin, au consortium
international, qui s’occupe des aspects
techniques et pratiques du déroulement
de l’enquête en mettant à profit sa
longue expérience dans la conception et
la réalisation d’enquêtes nationales et
internationales. Nous tenons aussi à
remercier les experts des différents pays
participants réunis dans les groupes de
travail pour avoir fait bénéficier le projet PISA de leurs connaissances scientifiques ou méthodologiques en matière
de comparaison internationale.
les deux cycles d’enquête (2000 et
2003). Nous espérons que le projet PISA
continuera à susciter au moins autant
d’intérêt qu’il l’a fait jusqu’à présent et
que nous pourrons encore compter à
l’avenir sur le soutien et la coopération
dont nous avons bénéficié jusqu’ici.
Huguette McCluskey et l’équipe
DIRECTION DU PROJET PISA.ch
PISA est un programme pluriannuel. Les
travaux préparatoires pour le deuxième
cycle ont déjà démarré. Un test pilote
se déroulera à nouveau en avril et en
mai 2002 avant la réalisation, au printemps 2003, du deuxième test principal.
Les résultats de ce deuxième cycle sont
très attendus car ils serviront à définir
les premières tendances en comparant
OFS/CDIP 2001 PRÉPARÉS POUR LA VIE ?
PAGE 7
PISA dans
les grandes lignes
Comparaison internationale des acquis des élèves:
un projet à long terme
quête PISA a pour but de fournir aux pays
Le programme PISA marque le début d’une nouvelle
membres de l’OCDE des indicateurs sur les
ère en matière de comparaison internationale des
performances des jeunes de 15 ans en lec-
compétences des élèves. Pour la première fois, en
ture, en mathématiques et en sciences. Elle
effet, les performances directes des systèmes éduca-
porte également sur les conditions requises
tifs ont été comparées sur le plan international, sur
pour l’apprentissage auto-dirigé telles que la
mandat de l’Organisation de Coopération et de
motivation et les stratégies d’apprentissage.
Développement économiques (OCDE). Depuis long-
Certains des pays participants prennent part
temps, l’OCDE soulignait l’importance d’un haut
en outre à une étude internationale compara-
niveau de formation pour la prospérité économique
tive sur l’aisance avec laquelle les élèves utili-
d’un pays. En produisant chaque année ses indica-
sent l’ordinateur.
teurs de l’éducation, elle se limitait toutefois jusqu’à
Le projet PISA s’articule en premier lieu
présent à des paramètres qui pouvaient être chiffrés,
autour de trois cycles mettant chacun l’accent
tels que les dépenses en faveur de l’éducation ou le
sur un domaine. Le premier cycle (PISA 2000)
nombre de diplômes délivrés à chaque niveau du
s’est concentré principalement sur la descrip-
système éducatif. Elle laissait à d’autres organisations
tion des compétences en lecture, tandis que
le soin d’évaluer les résultats du processus enseigne-
l’analyse des compétences en mathématiques
ment-apprentissage. Par ailleurs et pour la première
et en sciences était moins approfondie. Le
fois aussi, les données présentées ci-après ne consti-
domaine prioritaire de l’enquête PISA de
tuent pas l’aboutissement d’une enquête unique:
2003 sera les mathématiques, tandis que
PISA est un programme conçu pour durer. Les pays
l’enquête de 2006 sera consacrée avant tout
participants auront la possibilité d’établir tous les
aux sciences.
trois ans un bilan international de diverses compétences des jeunes et, ainsi, de suivre l’évolution des
250 000 élèves dans 32 pays
tendances et de contrôler l’efficacité des mesures
Au printemps 2000, 250 000 élèves de 15 ans
relevant de la politique de l’éducation.
ont effectué un test de compétence et rempli
un questionnaire dans 32 pays. Cela correspond en moyenne à un minimum de 4500
élèves et de 150 écoles par pays.
INFO 1
Les données de référence
de l’enquête PISA
Afin de disposer de données qui soient
comparables au niveau international, seuls
des élèves ayant 15 ans durant l’année du
Une formation pour l’avenir
test ont été interrogés. Les enfants étant
Le «Programme International pour le Suivi
généralement scolarisés plus tard en Suisse
des Acquis des élèves» (PISA) fait partie du
que dans les autres pays, ils avaient un peu
programme des indicateurs des systèmes
moins d’années d’école à leur actif au
éducatifs INES (Indicators of Educational Sys-
moment du test. Etant donné que l’enquête
tems) de l’Organisation de Coopération et de
internationale ne tient pas compte de cette
Développement économiques (OCDE). L’en-
réalité, on a tiré pour les comparaisons à l’in-
OFS/CDIP 2001 PRÉPARÉS POUR LA VIE ?
PAGE 8
PISA DANS LES GRANDES LIGNES
auto-dirigé constitue de ce fait un critère de qualité
térieur de la Suisse un échantillon supplé-
fondamental de tout système éducatif.
mentaire représentatif des élèves de 9 année
Dans notre société de l’information, il est en
scolaire. Cela porte à plus de 13 000, le
outre indispensable de savoir utiliser les technologies
nombre de jeunes interrogés en Suisse dans le
modernes de l’information et de la communication
cadre de l’enquête PISA.
pour poursuivre avec succès une formation scolaire
e
et professionnelle. L’aisance avec laquelle les jeunes
Les acquis ou la préparation à la vie adulte
utilisent l’ordinateur a par conséquent aussi fait l’ob-
A l’âge de 15 ans, la plupart des jeunes sont
jet de l’enquête PISA.
à la fin de leur scolarité obligatoire et
devraient disposer de certaines compétences
Compétences des jeunes âgés de 15 ans
en lecture, en mathématiques et en sciences.
Les résultats présentés ci-après concernent quelque
L’enquête PISA évalue justement ces compé-
250 000 jeunes âgés de 15 ans originaires de 31
tences qui constituent les acquis des jeunes
pays, dont 6100 scolarisés en Suisse. Les 27 pays
de 15 ans. Ces compétences, qui s’acquièrent
membres de l’OCDE ainsi que le Brésil, la Lettonie, le
également à l’école, ne sont pas liées cepen-
Liechtenstein et la Russie ont participé à la compa-
dant à un programme d’enseignement spéci-
raison internationale des compétences. Les résultats
fique, mais peuvent être mises en oeuvre
obtenus sont représentatifs des compétences des
dans différents contextes. Ces acquis sont
jeunes de 15 ans des pays concernés.
indispensables pour participer pleinement à la
société.
Les acquis des élèves au terme
INFO 2
Lecture, mathématiques
et sciences
de l’école obligatoire
PISA présente un autre avantage: celui de couvrir un
La compréhension de l’écrit
large éventail de compétences. Les tests de compé-
Les compétences en lecture se mesurent à la
tences proprement dits, qui fournissent des informa-
capacité de comprendre des informations
tions différenciées sur les connaissances et le savoir-
données dans un texte et d’en identifier les
faire des jeunes de 15 ans en lecture, en mathéma-
messages centraux, ainsi que d’interpréter et
tiques et en sciences, en constituent certes la sub-
de porter un jugement critique sur son conte-
stance principale. Il n’en demeure pas moins que
nu et sa forme. Les tests de compétences
PISA ne se limite pas à ce savoir scolaire, mais évalue
consistaient par conséquent en une série de
l’ensemble des acquis que les jeunes devraient pos-
tâches exigeant toutes sortes d’aptitudes
séder au terme de la scolarité obligatoire.
quant à la compréhension et à l’utilisation
A elles seules, les compétences dans l’une ou
d’un texte ainsi qu’à la réflexion à son sujet.
l’autre matière ne permettent pas aux jeunes de
Les textes choisis mettaient en scène des
poursuivre leur formation et d’entrer dans la vie ac-
situations quotidiennes et les sujets abordés
tive. L’enquête a par conséquent également porté sur
devaient révéler la disposition des élèves à
des facteurs qui contribuent de manière déterminan-
participer activement à la société.
te à un apprentissage réussi, notamment l’application
Les aptitudes examinées ont été réparties
de stratégies d’apprentissage, l’intérêt pour l’étude et
en trois groupes: «trouver des informations»,
la confiance des élèves en leurs propres capacités. Les
«interpréter un texte» et «réfléchir sur son
jeunes qui sont motivés et sûrs d’eux-mêmes ont
contenu et sa forme et porter un jugement
recours à des stratégies d’apprentissage et sont par
critique».
conséquent dotés de compétences élevées pour
apprendre. Ils sont capables de diriger personnelle-
La culture mathématique
ment d’importants aspects de leurs processus d’ap-
La
prentissage. Condition préalable pour que les élèves
connaissances et savoir-faire mathématiques,
culture
mathématique
englobe
les
exploitent au mieux leur potentiel, l’apprentissage
OFS/CDIP 2001 PRÉPARÉS POUR LA VIE ?
PAGE 9
PISA DANS LES GRANDES LIGNES
de la maîtrise des processus standard aux raisonnements mathématiques complexes. Les
problèmes soumis aux élèves se concentraient en premier lieu sur des concepts
mathématiques fondamentaux tels que le
hasard, les variations et la croissance ou l’espace et les formes. Ces exercices portaient
également sur les disciplines enseignées d’ordinaire telles que l’arithmétique, l’algèbre et
la géométrie. Dans le domaine des mathématiques également, les élèves avaient à
résoudre des tâches inspirées des exigences
de leur vie actuelle et future.
La culture scientifique
La culture scientifique inclut ici la capacité de
comprendre le monde grâce à la maîtrise de
concepts scientifiques, d’identifier les questions scientifiques et d’en tirer des conclusions. Les concepts scientifiques évalués dans
le cadre de l’enquête PISA concernaient des
sujets d’actualité tels que la vie et la santé, la
terre et l’environnement ainsi que la technologie. Ils étaient donc parfaitement adaptés
aux concepts courants se rapportant à la physique, à la chimie, à la biologie et aux sciences
de la terre. Les questions n’avaient pas simplement pour but de vérifier si les élèves
connaissaient ces concepts, mais de déterminer s’ils étaient en mesure d’appliquer ces
derniers en relation avec des thèmes et des
situations de la vie quotidienne.
OFS/CDIP 2001 PRÉPARÉS POUR LA VIE ?
PAGE 10
La Suisse en comparaison
internationale
Des résultats très bons en mathématiques,
quement pas significatif. En mathématiques, en
mais moyens en lecture et en sciences
revanche, les performances des élèves suisses sur-
Les jeunes de Finlande, du Japon et de Corée du Sud
passent celles relevées aux Etats-Unis et en Suède de
arrivent en tête de classement dans les trois
manière statistiquement significative. La culture
domaines examinés. Les résultats obtenus par les
scientifique des jeunes interrogés au Japon et en
élèves en Nouvelle-Zélande, au Canada, en Australie
Suède est également supérieure à celle des élèves en
et en Grande-Bretagne (tableau 1) sont également
Suisse, tandis que cette dernière est proche des per-
excellents tant en lecture qu’en mathématiques et en
formances enregistrées aux Etats-Unis.
sciences.
Les élèves interrogés en Suisse ont obtenu un bon
résultat en mathématiques et se placent, comme il y
a plusieurs années, derrière le peloton de tête formé
par le Japon et la Corée du Sud, ainsi qu’après la
Nouvelle-Zélande, la Finlande, l’Australie et le Canada. Par contre, la Suisse arrive en milieu de classe-
INFO 3
Des écarts statistiquement
significatifs
ment en lecture et en sciences. Ces constats confirment les résultats des dernières études menées au
L’enquête ne porte pas sur l’ensemble des
niveau international, telles que la «Third Internatio-
jeunes de 15 ans (population) des pays parti-
nal Mathematics and Science Study» (TIMSS; 1997)
cipants, mais sur des échantillons de cette
et l’enquête «International Adult Literacy Survey»
population. Ainsi, les résultats d’un pays sont
(IALS; 1996) ou l’étude de l’association internatio-
estimés sur la base de ceux obtenus par les
nale pour l’évaluation du rendement scolaire «Rea-
élèves de 15 ans inclus dans l’échantillon. De
ding-Literacy-Study» (IEA; 1993). La Suisse figure
ce fait, les résultats estimés, tels que les
donc parmi les meilleurs pays au monde pour ce qui
valeurs moyennes des pays sur l’échelle des
est des compétences de ses élèves en mathéma-
compétences en lecture, comprennent une
tiques, mais arrive loin derrière le peloton de tête en
erreur d’échantillonnage. La dispersion des
lecture et en sciences.
résultats estimés pour les élèves de 15 ans
La comparaison avec les pays voisins révèle que
(intervalle de confiance) par rapport à la
les résultats obtenus en lecture par les élèves en
valeur réelle des performances de cette popu-
Suisse sont quasiment aussi bons que ceux des per-
lation varie selon la précision de l’échantillon-
sonnes interrogées en Autriche, en France, en Italie
nage.
et en Allemagne. En mathématiques, en revanche,
En examinant si les écarts entre les pays
les jeunes de Suisse réalisent de bien meilleures per-
sont statistiquement significatifs dans les
formances que ceux d’Allemagne et d’Italie. Dans le
résultats, on tient compte des erreurs
domaine scientifique, par contre, les performances
d’échantillonnage. Un écart entre deux pays
des élèves en Autriche dépassent de loin celles rele-
est considéré comme statistiquement signifi-
vées en Suisse.
catif s’il a été examiné et prouvé au moyen
Les compétences en lecture des personnes inter-
d’une méthode d’analyse statistique. Les
rogées en Suisse sont légèrement inférieures à celles
écarts qui ne se sont pas révélés statistique-
des jeunes du Japon, de Suède et des Etats-Unis,
ment significatifs n’ont pas d’importance.
l’écart avec ces derniers n’étant néanmoins statisti-
OFS/CDIP 2001 PRÉPARÉS POUR LA VIE ?
PAGE 11
LA SUISSE EN COMPARAISON INTERNATIONALE
TABLEAU 1:
Les performances des jeunes de 15 ans en Suisse en comparaison internationale,
en 2000
Lecture
Mathématiques
Sciences
Les jeunes des pays
Finlande
Japon
Corée du Sud
ci-contre réalisent
Canada
Corée du Sud
Japon
des performances qui
Nouvelle-Zélande
Finlande
surpassent de maniè-
Australie
Grande-Bretagne
re statistiquement
Irlande
Canada
significative celles
Corée du Sud
Nouvelle-Zélande
des jeunes interrogés
Grande-Bretagne
Australie
en Suisse
Japon
Autriche
Suède
Irlande
Suède
Les jeunes des pays
Autriche
Nouvelle-Zélande
République tchèque
ci-contre réalisent
Belgique
Finlande
France
des performances qui
Islande
Australie
Norvège
ne se distinguent pas
Norvège
Canada
Etats-Unis
de manière statisti-
France
(Suisse)
Hongrie
quement significative
Etats-Unis
Grande-Bretagne
Islande
de celles des jeunes
Danemark
Belgique
Belgique
interrogés en Suisse
(Suisse)
France
(Suisse)
Espagne
Autriche
Espagne
République tchèque
Danemark
Allemagne
Italie
Islande
Pologne
Allemagne
Liechtenstein
Danemark
Liechtenstein
Hongrie
Pologne
Les performances
Grèce
Suède
Italie
des jeunes des pays
Portugal
Irlande
Liechtenstein
ci-contre sont nette-
Russie
Norvège
Grèce
ment inférieures à
Lettonie
République tchèque
Russie
celles des jeunes
Luxembourg
Etats-Unis
Lettonie
interrogés en Suisse
Mexique
Allemagne
Portugal
Brésil
Hongrie
Luxembourg
Russie
Mexique
Espagne
Brésil
Pologne
Lettonie
Italie
Portugal
Grèce
Luxembourg
Mexique
Brésil
© OFS/CDIP
OFS/CDIP 2001 PRÉPARÉS POUR LA VIE ?
PAGE 12
LA SUISSE EN COMPARAISON INTERNATIONALE
FIGURE 1:
Répartition des jeunes de 15 ans dans les différents niveaux de compétences
en lecture, en 2000
Les jeunes des
Finlande
pays ci-contre réa-
Canada
lisent des perfor-
Nouvelle-Zélande
mances qui surpassent de manière
Australie
statistiquement
Irlande
significative celles
Corée du Sud
des jeunes inter-
Grande-Bretagne
rogés en Suisse
Japon
(voir tableau 1)
Suède
Les jeunes des
Autriche
pays ci-contre réa-
Belgique
lisent des perfor-
Islande
mances qui ne se
distinguent pas de
Norvège
manière statisti-
France
quement significa-
Etats-Unis
tive de celles des
Danemark
jeunes interrogés
Suisse
en Suisse
Espagne
(voir tableau 1)
République tchèque
Italie
Allemagne
Liechtenstein
Hongrie
Pologne
Les performances
Grèce
des jeunes des
Portugal
pays ci-contre
Russie
sont nettement
inférieures à celles
Lettonie
des jeunes inter-
Luxembourg
rogés en Suisse
Mexique
(voir tableau 1)
Brésil
0%
Niveau < 1
20%
Niveau 1
40%
Niveau 2
60%
80%
Niveau 3
100%
Niveau 4
Niveau 5
© OFS/CDIP
OFS/CDIP 2001 PRÉPARÉS POUR LA VIE ?
PAGE 13
LA SUISSE EN COMPARAISON INTERNATIONALE
Une part importante d’élèves médiocres en lecture
Une part particulièrement importante des élèves
interrogés en Suisse réalise de très faibles résultats en
lecture (info 4 et figure 1; niveau ≥ 1). En Suisse
INFO 4
Les compétences
en lecture
comme en Allemagne, plus de 20% des élèves de
Suisse en fin de scolarité obligatoire ne sont pas en
Le premier cycle de l’enquête PISA dresse un
mesure de comprendre entièrement des textes
tableau représentatif des niveaux de com-
simples et d’en interpréter le contenu sans en modi-
pétences en lecture des jeunes au terme de la
fier le sens. Ces jeunes n’ont que des compétences
scolarité obligatoire. Dans la perspective de
rudimentaires lorsqu’il s’agit de lire et de comprendre
la politique de l’éducation, le but premier
un texte dans la langue d’enseignement. Environ 7%
n’est pas de déterminer dans quels pays les
des élèves ont même beaucoup de peine à retirer des
moyennes sont les meilleures, mais de définir
informations simples d’un texte écrit. Dans la pers-
les aptitudes correspondant aux moyennes
pective de leur avenir professionnel, ces élèves sont à
obtenues. On a pour ce faire défini les cinq
considérer comme un groupe à risque en raison des
niveaux de compétences suivants:
difficultés qu’ils rencontreront face aux exigences
d’un apprentissage professionnel ou d’une formation
Niveau 5: Les jeunes qui se classent dans le
continue (niveau < 1). Au Japon, par exemple, les
niveau supérieur sont capables de com-
parts correspondantes sont deux fois moins impor-
prendre en détail des textes peu usuels, d’en
tantes: environ 10% des élèves ont des compétences
trouver les informations centrales, de porter
rudimentaires en lecture et tout juste 3% font partie
des jugements critiques et d’échafauder des
du groupe à risque. La part des jeunes appartenant à
hypothèses même s’il s’agit de textes spécia-
ce dernier est de 6,4% aux Etats-Unis, de 5,4% en
lisés.
Italie, de 4,4% en Autriche, de 4,2% en France et de
Niveau 4: Les jeunes qui atteignent le niveau
3,3% en Suède. Atteignant 9,9%, cette part est
4 maîtrisent des tâches de lecture difficiles:
encore nettement supérieure en Allemagne à celle de
repérer certaines informations, dégager un
la Suisse.
sens à partir de finesses linguistiques et examiner un texte sous un angle critique.
Une part moyenne de très bons résultats
Niveau 3: Le niveau 3 suppose de pouvoir lire
en lecture
et comprendre des textes de complexité
L’OCDE donne beaucoup de poids aux compétences
moyenne, en identifiant différents éléments
des élèves en lecture dans la perspective de leur car-
d’information. Les personnes testées doivent
rière professionnelle. Les jeunes qui sont à même de
également pouvoir mettre en relation diffé-
comprendre en détail un texte exigeant et peu usuel
rentes parties du texte et raccrocher celles-ci
et d’émettre une critique pertinente sur sa forme et
à des aspects de la vie quotidienne.
son contenu même s’il s’agit d’un texte spécialisé ont
Niveau 2: A l’intérieur du niveau 2, les jeunes
toutes les chances de suivre avec succès des études
sont capables de trouver des informations
supérieures et de se profiler au niveau professionnel
dans un texte pour résoudre des exercices
(info 4 et figure 1: niveau 5). En moyenne interna-
élémentaires: tirer des conclusions simples,
tionale, 9,4% des jeunes de 15 ans font partie de
dégager la signification d’une partie en
cette élite. En Australie, au Canada, en Finlande, en
exploitant les connaissances qu’ils ont
Nouvelle-Zélande et en Grande-Bretagne, plus de
acquises.
15% des élèves interrogés ont d’excellentes compé-
Niveau 1: Les jeunes du niveau 1 ont des
tences en lecture, ce qui est le cas d’environ 12% des
compétences rudimentaires en lecture. Ils
jeunes en Belgique, en Irlande et aux Etats-Unis.
sont certes à même de localiser une informa-
En Suisse, 9,2% des personnes interrogées ont
tion unique dans un texte simple et d’établir
atteint le niveau de compétences supérieur en lec-
des liens avec les connaissances dont ils dis-
ture. La proportion des très bons élèves dans ce
posent, mais ne sont pas capables d’utiliser
domaine est semblable en Suède (11,2%), au Japon
un texte à des fins d’apprentissage.
(9,9%), en Allemagne (8,8%), en Autriche (8,8%) et
OFS/CDIP 2001 PRÉPARÉS POUR LA VIE ?
PAGE 14
LA SUISSE EN COMPARAISON INTERNATIONALE
en France (8,5%), mais nettement plus petite en
mieux préparés de manière générale pour continuer
Italie (5,3%). En Russie, en Espagne et au Portugal,
à apprendre après avoir achevé leur scolarité. Eveiller
cette même proportion n’atteint pas 5%.
chez les élèves l’intérêt de poursuivre leur apprentissage tout au long de leur vie constitue donc une des
Réfléchir et porter un jugement critique:
tâches principales de l’école.
un exercice qui donne du fil à retordre aux
La comparaison internationale de l’apprentissage
élèves en Suisse
auto-dirigé, réalisée pour la première fois dans le
C’est dans les exercices nécessitant de la réflexion en
cadre de PISA, a mis en lumière quelques points
vue de porter un jugement critique sur un texte que
faibles chez les jeunes Suisses. Comparés aux jeunes
les élèves interrogés en Suisse ont rencontré le plus
du même âge au Danemark, en Finlande et en
de difficultés. Ils étaient nettement plus à l’aise lors-
Suède, les élèves de 15 ans scolarisés dans notre pays
qu’il s’agissait de trouver des informations dans le
ne montrent pas particulièrement d’intérêt pour la
texte ou de fournir une interprétation. La compré-
lecture et les mathématiques. La situation est un peu
hension et l’interprétation sont des conditions néces-
meilleure en ce qui concerne l’application de straté-
saires pour pouvoir réfléchir sur le contenu et la
gies d’apprentissage. Les élèves suisses se situent
forme d’un texte et porter un jugement critique sur
dans la moyenne internationale lorsqu’il s’agit, en
celui-ci. Apparemment, l’importance accordée dans
lisant des textes, a) de retenir des informations nou-
la langue d’enseignement à ces facultés complexes
velles (stratégies de mémorisation), b) d’intégrer les
est moins grande en Suisse que dans d’autres pays.
informations nouvelles dans le savoir existant (stratégies d’élaboration) et c) de contrôler la matière
Pas d’intérêt particulier pour l’apprentissage
apprise (stratégies de contrôle).
Un apprentissage mené avec succès suppose un
Les résultats de cette comparaison internationale
minimum d’intérêt de la part de l’apprenant. Les
ne sont toutefois pas simples à interpréter, d’une part
jeunes qui sont capables de diriger eux-mêmes leur
parce qu’ils ont été établis à partir des appréciations
apprentissage en recourant à des stratégies non seu-
personnelles des jeunes et, d’autre part parce qu’ils
lement réussissent mieux à l’école, mais sont aussi
sont influencés par des facteurs culturels. En Corée du
FIGURE 2:
Utilisation de l’ordinateur par les jeunes de 15 ans à l’école et à la maison,
en 2000
Danemark
Finlande
Suède
Etats-Unis
Suisse
Allemagne
0%
10%
20%
30%
40%
50%
60%
70%
80%
90%
100%
Utilisation quelques fois par semaine
à l’école
à la maison
© OFS/CDIP
OFS/CDIP 2001 PRÉPARÉS POUR LA VIE ?
PAGE 15
LA SUISSE EN COMPARAISON INTERNATIONALE
Sud, par exemple, les jeunes jugent leur intérêt pour
la lecture et les mathématiques relativement faible, en
comparaison avec l’intérêt manifesté dans les autres
pays, alors que leurs compétences sont excellentes.
Au sein de chaque pays, néanmoins, on observe une
corrélation positive entre les différentes composantes
de l’apprentissage auto-dirigé et les compétences
dont font preuve les élèves: ceux qui s’intéressent à la
matière étudiée et qui mettent en œuvre des stratégies d’apprentissage en complément de l’enseignement reçu obtiennent aussi de meilleurs résultats, en
Corée du Sud comme en Suisse.
L’ordinateur ne fait pas peur
En Suisse, 63% des jeunes de 15 ans utilisent l’ordinateur quelques fois par semaine et 43% naviguent
sur Internet à une fréquence aussi élevée (voir la
figure 2). Les Etats-Unis, la Finlande, l’Allemagne et
le Danemark indiquent des proportions équivalentes.
En Suède, en revanche, les jeunes de 15 ans qui utilisent l’ordinateur et ceux qui surfent sur la Toile
quelques fois par semaine sont respectivement plus
de 80% et 77%. A noter toutefois que, sur ce plan,
l’école joue un rôle secondaire. Dans tous les pays,
en effet, c’est à la maison que les jeunes font principalement usage de l’ordinateur. En Suisse, la part des
jeunes qui l’utilisent quelques fois par semaine à
l’école ne dépasse pas 21%. L’Allemagne est le seul
pays à afficher une proportion encore plus faible, à la
différence des Etats-Unis (30%), de la Suède (45%),
de la Finlande (46%) et du Danemark (57%). L’utilisation relativement faible de l’ordinateur dans les
écoles suisses s’explique probablement par un
manque d’équipement. L’intérêt pour l’ordinateur,
lui, ne fait heureusement pas défaut dans notre pays,
même s’il est nettement moins marqué chez les filles
que chez les garçons. Il n’y a qu’aux Etats-Unis et en
Allemagne où les jeunes déclarent un intérêt plus
grand que les adolescents suisses. Un grand nombre
de pays n’ayant malheureusement pas participé à ce
volet de l’enquête sur l’aisance des jeunes à utiliser
l’ordinateur, la comparaison internationale des résultats se limite à quelques nations seulement.
OFS/CDIP 2001 PRÉPARÉS POUR LA VIE ?
PAGE 16
Spécificités propres
aux régions linguistiques
La diversité culturelle et linguistique de la Suisse fait
L’âge variable des jeunes en 9e ne semble pas
de notre pays un cas particulier lorsqu’il s’agit de
avoir des conséquences importantes sur leurs com-
comparer les compétences des élèves sur le plan
pétences en lecture. Le pourcentage d’élèves qui
international. Les données de la Suisse proviennent
savent à peine lire ou qui lisent mal est certes un peu
de jeunes qui ont fréquenté des systèmes scolaires en
plus élevé en Suisse alémanique (6%) qu’en Suisse
partie très différents. L’âge auquel les enfants sont
italienne ou en Suisse romande (figure 3: niveau < 1
scolarisés diffère ainsi de près d’une année selon que
ou niveau 1). Mais la Suisse alémanique est aussi la
l’on se trouve au Tessin ou en Suisse alémanique. Les
région qui compte, avec plus de 8%, la proportion la
élèves de 9 ont environ 10 mois de plus en Suisse
plus élevée de très bons élèves en lecture (niveau 5).
alémanique que leurs camarades tessinois et quatre
D’une région linguistique à l’autre, les élèves de 9e
e
mois de plus que les jeunes Romands.
ont des compétences différentes en mathématiques
Du fait qu’à l’intérieur de la Suisse, les systèmes
et en sciences. Il faudra des analyses plus poussées
scolaires ne présentent pas les mêmes caractéris-
pour déterminer dans quelle mesure ces résultats
tiques, il était aussi intéressant de comparer les
sont conditionnés par l’âge ou si d’autres particulari-
acquis des élèves à la fin du degré secondaire I sur le
tés des systèmes éducatifs jouent un rôle.
plan national. On a donc procédé à la comparaison
des compétences des élèves de 9e de chaque région
linguistique, tout en gardant à l’esprit que la situation de ces derniers n’était pas totalement comparable vu qu’ils ne sont pas scolarisés au même âge.
FIGURE 3:
Distribution des élèves de 9e selon les niveaux de compétences en lecture,
dans les trois régions linguistiques considérées, en 2000
Suisse alémanique
Suisse romande
Suisse italienne
0%
Niveau < 1
20%
Niveau 1
40%
Niveau 2
60%
Niveau 3
80%
Niveau 4
100%
Niveau 5
© OFS/CDIP
OFS/CDIP 2001 PRÉPARÉS POUR LA VIE ?
PAGE 17
Un potentiel
pour le futur
Des raisons qui expliquent le classement
domaines testés bien qu’ils totalisent, à 15 ans, à peu
de la Suisse
près autant d’années de scolarité que les Suisses.
«Des résultats très bons en mathématiques, moyens
en lecture et en sciences» – un jugement qui de-
Des familles aux ressources culturelles
mande quelques explications: pourquoi les élèves
défavorables
suisses n’obtiennent-ils pas de très bons résultats
Notre système d’éducation doit offrir la possibilité
dans les trois domaines testés? S’il n’est pas possible
aux enfants et aux adolescents, de quelque origine
de faire le tour de cette question, on peut néanmoins
sociale et économique qu’ils soient, de suivre des for-
identifier, sur la base de quelques analyses plus pous-
mations adaptées à leurs capacités. Il doit leur per-
sées des résultats suisses, les domaines où le poten-
mettre d’exploiter au mieux leurs compétences
tiel de compétences des élèves n’est pas encore épui-
potentielles. La mesure dans laquelle cet objectif est
sé. Mais avant de tirer des conclusions sur la qualité
atteint dépend en grande partie de la manière dont
du système éducatif suisse, à partir de la comparai-
l’école réussit à compenser des conditions d’appren-
son internationale des compétences, il convient de
tissage défavorables pour les élèves.
décrire plus précisément les conditions dans les-
Des conditions d’apprentissage défavorables, liées
quelles a lieu le processus d’enseignement-appren-
à l’origine sociale, se manifestent notamment dans la
tissage.
formation des parents, dans la profession qu’ils exercent et dans les ressources culturelles du foyer paren-
Une scolarisation tardive
tal. Par ressources culturelles, on entend aussi bien le
Il apparaît toujours, lors de comparaisons internatio-
goût des parents pour les livres, la littérature et les
nales, que la scolarisation en Suisse, et plus particu-
oeuvres d’art classiques, que leur disponibilité pour
lièrement en Suisse alémanique, débute relativement
discuter avec leurs enfants de sujets sociaux, poli-
tard. Alors que, dans les pays de l’OCDE, les jeunes
tiques ou culturels, mais aussi certains moyens maté-
âgés de 15 ans ont déjà fréquenté l’école pendant 9
riels tels que l’accès à Internet ou un endroit tran-
ans et demi en moyenne, en Suisse, ils sont scolari-
quille pour étudier.
sés depuis seulement 9 ans à peine (tableau 2). Le
Les jeunes ayant obtenu de bons résultats dans les
nombre comparativement plus faible d’années sco-
trois domaines de compétences sont élevés dans des
laires que les élèves suisses ont derrière eux à l’âge
familles riches en ressources culturelles. Ces res-
de 15 ans ne peut toutefois expliquer qu’en partie
sources s’avèrent extrêmement importantes pour ce
leurs résultats moyens en lecture et en sciences.
qui est des compétences spécialisées; elles condition-
Certes, la majorité des élèves provenant de pays qui
nent encore plus le succès en lecture et en sciences
affichent de meilleurs résultats en lecture et en
qu’en mathématiques. Un environnement familial
sciences comptent une demi-année à une année
propice à la réussite est surtout donné par des
entière de scolarité de plus que les jeunes Suisses
parents possédant une bonne formation.
(Canada, Nouvelle-Zélande, Australie, Corée du Sud,
Le statut professionnel des parents joue, lui aussi,
Grande-Bretagne, Japon ou Autriche). Mais il y a
un rôle non négligeable sur le plan des compétences
aussi des exceptions qui confirment que l’âge auquel
en lecture de leurs enfants: si le père et la mère exer-
les enfants sont scolarisés n’est pas nécessairement
cent des métiers prestigieux impliquant des revenus
déterminant pour le niveau des résultats obtenus par
élevés, ils garantissent l’existence à la maison d’un
leur pays. Ainsi, les jeunes Finlandais se distinguent
environnement culturel riche et leurs enfants font
par des compétences excellentes dans les trois
preuve de plus grandes compétences en compréhen-
OFS/CDIP 2001 PRÉPARÉS POUR LA VIE ?
PAGE 18
UN POTENTIEL POUR LE FUTUR
TABLEAU 2:
Nombre d’années de scolarisation
au moment du test pour les élèves
de 15 ans, en 2000
INFO 5
Origine et réussite scolaire
On associe souvent l’expression «inégalité
Brésil
8.5
des chances» au fait que les jeunes issus de
Liechtenstein
8.9
familles aux ressources culturelles défavo-
Finlande
8.9
rables obtiennent de moins bons résultats
Suisse
8.9
scolaires. Ce n’est pas seulement la qualité de
Danemark
9.0
enfants et les adolescents bénéficient chez
Suède
9.0
eux qui influencent de manière déterminante
Pologne
9.0
leurs chances de développement.
Luxembourg
9.1
Selon l’OCDE, la corrélation étroite entre
Allemagne
9.1
l’origine sociale et les compétences en lec-
Hongrie
9.2
ture, en mathématiques et en sciences est
Portugal
9.3
aussi un problème de potentiel de compé-
Mexique
9.4
tences insuffisamment exploité d’une société.
Lettlonie
9.4
Par analogie avec l’économie de l’éducation,
Autriche
9.4
on désigne également dans une perspective
Irlande
9.5
sociologique les connaissances et le savoir-
France
9.5
faire par le terme de capital humain.
République tchèque
9.5
Les enfants sont diversement dotés des
Etats-Unis
9.5
ressources qui sont essentielles au capital
Belgique
9.6
humain ou, en d’autres termes, à l’utilisation
Russie
9.7
de l’offre éducative. Font partie de ces res-
Espagne
9.7
sources, outre le capital économique sous
Canada
9.8
forme par exemple de moyens financiers, de
Italie
9.9
pouvoir ou de prestige, le capital culturel et
l’offre éducative mais aussi le soutien dont les
Corée du Sud
10.0
Japon
10.0
Islande
10.0
Norvège
10.0
Grèce
10.1
Australie
10.1
Grande-Bretagne
10.7
Nouvelle-Zélande
11.0
social. Par capital culturel, on entend par
exemple les diplômes des parents ou des
objets ayant un lien avec la culture, tels que
des livres ou des tableaux. Le capital social,
quant à lui, est fait de réseaux de relations
sociales, qui facilitent l’accès à la formation.
Le capital économique, culturel et social élargit la marge de manoeuvre des individus et
influence positivement leur situation socioéconomique, ce qui à son tour a des réper-
© OFS/CDIP
cussions favorables sur leur utilisation de
sion de l’écrit. Parmi les pays de l’OCDE, la Belgique,
l’offre éducative. Pour accroître le capital
l’Allemagne et la Suisse sont ceux où le statut pro-
humain, il vaut par conséquent la peine d’in-
fessionnel des parents influence le plus les compé-
vestir dans le capital culturel et social.
tences en lecture des enfants.
En matière de politique de l’éducation, il
Il ressort de l’enquête PISA, et plus particulière-
est particulièrement important de savoir si l’on
ment du volet traitant des liens entre l’origine so-
retrouve dans tous les pays la même corréla-
ciale des jeunes et leurs compétences en lecture, en
tion entre l’origine sociale et les compétences
mathématiques et en sciences, que le système sco-
ou si cette corrélation est imputable à cer-
laire suisse ne parvient pas à compenser l’effet néga-
taines caractéristiques du système éducatif.
tif de conditions d’apprentissage inégales.
OFS/CDIP 2001 PRÉPARÉS POUR LA VIE ?
PAGE 19
UN POTENTIEL POUR LE FUTUR
Les jeunes issus de familles immigrées
résultats excellents en lecture, en mathématiques et
plus désavantagés
en sciences.
La proportion de jeunes issus de familles immigrées
n’a cessé de progresser en Suisse ces dernières
Garçons et filles: des conditions
années pour atteindre environ 21% en 2001. La plu-
d’apprentissage différentes
part de ces jeunes sont désavantagés à maints
En dépit de nombreuses mesures prises en faveur de
égards. Premièrement, ils ne sont pas suffisamment
l’égalité des sexes à l’école, on observe aujourd’hui
soutenus et encouragés dans leur foyer familial,
encore des différences – faibles il est vrai – entre les
ensuite leurs parents ne connaissent le plus souvent
compétences des garçons et des filles: les garçons
pas le système éducatif local et, enfin, ils doivent
obtiennent de meilleurs résultats en mathématiques
fournir des efforts particuliers pour pouvoir suivre les
et en sciences et les filles en lecture. Les conditions
cours en raison de leurs difficultés linguistiques.
d’apprentissage des uns et des autres se différencient
Ce handicap les gêne aussi bien en lecture qu’en
dans le même sens. Les filles ont du plaisir à lire et
mathématiques ou en sciences. Un quart environ des
s’estiment aussi en moyenne plus compétentes en
jeunes issus de familles immigrées ne comprennent
compréhension de l’écrit que les garçons ne le font.
pas les textes utilisés pour l’enquête PISA et ont à
Ces derniers, en revanche, s’intéressent nettement
peine les capacités et aptitudes requises pour lire des
plus aux mathématiques et aux sciences et évaluent
textes dans la langue dans laquelle l’enseignement
est donné. Un autre quart a de sérieuses difficultés à
comprendre des textes simples dans la langue d’enseignement. Ces jeunes ont aussi des retards importants en mathématiques et en sciences. Ce résultat
INFO 6
Langue maternelle –
Langue d’enseignement
met en évidence le défi important que notre système
éducatif doit relever: réussir le mieux possible l’inté-
En interprétant les résultats concernant les
gration des jeunes issus de familles immigrées qui
jeunes issus de familles immigrées, il faut
grandissent le plus souvent dans un environnement
tenir compte du fait que la langue dans
plurilingue.
laquelle l’enseignement est donné en Suisse
Les retards des jeunes issus de familles immigrées
est, pour ces élèves, la première langue étran-
s’avèrent en fait plus importants que l’on pouvait s’y
gère. Cela signifie en d’autres termes que les
attendre au vu de leur socialisation dans un envi-
résultats d’un test de lecture passé dans la
ronnement plurilingue. Plusieurs facteurs peuvent
langue d’enseignement ne permettent pas
l’expliquer: les conditions économiques plus défavo-
de juger les compétences de ces jeunes en
rables dans lesquelles ils vivent dans la majorité des
lecture, mais qu’ils montrent leur degré de
cas, l’absence, bien souvent, de formation supé-
compréhension de textes dans leur première
rieure de leurs parents et le manque de ressources
langue étrangère. Le même test passé dans
culturelles de leur environnement familial. Il con-
leur langue maternelle déboucherait proba-
vient toutefois de remarquer qu’un petit nombre de
blement sur d’autres résultats. Pour les per-
ces jeunes possèdent de bonnes compétences, voire
sonnes concernées, le test PISA ne mesure
des compétences excellentes en lecture dans la
pas la même chose chez les jeunes nés en
langue d’enseignement et qu’ils sont en mesure de
Suisse que chez les jeunes issus de familles
comprendre des textes extrêmement complexes.
immigrées. Du point de vue d’une politique
Ces jeunes prouvent que l’intégration linguistique
de l’éducation qui vise à intégrer ces derniers,
peut être une réussite (figure 4). Par ailleurs, les
la comparaison est néanmoins nécessaire. La
retards en lecture, en mathématiques et en sciences
connaissance de la langue du pays d’accueil
se comblent d’autant mieux que les jeunes sé-
est en effet une condition indispensable pour
journent depuis longtemps dans la région linguis-
permettre l’intégration scolaire et la pour-
tique considérée. PISA montre que la diversité cul-
suite de la formation, professionnelle ou
turelle accroît les défis qui sont posés au système
supérieure, mais aussi la participation à la vie
éducatif, mais, en même temps, que les jeunes issus
politique et sociale.
de familles immigrées sont capables d’obtenir des
OFS/CDIP 2001 PRÉPARÉS POUR LA VIE ?
PAGE 20
UN POTENTIEL POUR LE FUTUR
FIGURE 4:
Compétences des élèves en 9e année en lecture selon la durée de séjour
dans la région linguistique, en 2000
Jeunes nés
dans la région linguistique
depuis plus de 12 ans
dans la région linguistique
de 9 à 12 ans dans
la région linguistique
de 5 à 8 ans dans
la région linguistique
de 1 à 4 ans dans
la région linguistique
0%
Niveau < 1
Niveau 1
20%
Niveau 2
40%
Niveau 3
60%
80%
Niveau 4
100%
Niveau 5
© OFS/CDIP
leurs compétences dans ces matières de manière net-
Des filles décidément plus douées
tement plus positive que les filles.
pour la lecture
Les causes de ces différences tiennent en grande
La figure 5 montre quelles proportions de garçons et
partie aux élèves eux-mêmes. On suppose que les
de filles font respectivement partie des très bons lec-
stéréotypes et la répartition traditionnelle des rôles –
teurs ou du groupe à risque dans les trois échelles de
par exemple: «les mathématiques sont moins impor-
compréhension de l’écrit considérées, soit «trouver
tantes pour les filles que pour les garçons» ou encore
des informations dans un texte», «interpréter un
«les garçons ne s’intéressent pas aux livres durant
texte» et «réfléchir sur son contenu et sa forme et
leurs loisirs» – contribuent pour beaucoup au
porter un jugement critique».
manque de confiance que les jeunes ont en leurs
capacités.
Les différences entre les sexes sont particulièrement évidentes dans le cas de ces deux groupes de
Les différences observées aussi bien sur le plan
lecteurs. La part des garçons qui appartiennent au
des compétences que des conditions d’apprentissage
groupe à risque est nettement plus importante: elle
sont problématiques pour les filles comme pour les
oscille entre 21% et 27% selon l’échelle considérée.
garçons. L’importance des mathématiques ou des
La proportion de très bonnes lectrices est en
sciences pour nombre de professions, en particulier
revanche sensiblement supérieure. C’est dans
pour les plus exigeantes d’entre elles, rend les pers-
l’échelle «réfléchir et porter un jugement critique»
pectives professionnelles des filles plus sombres que
que l’on observe l’écart le plus grand entre garçons
celles des garçons. Mais les moins bonnes compé-
et filles: ces dernières se débrouillent beaucoup
tences des garçons en compréhension de l’écrit sont
mieux que les premiers pour comprendre des textes
aussi problématiques, car elles compromettent chez
complexes et répondre à des exigences élevées.
eux l’acquisition de compétences sociales, des compétences de plus en plus indispensables avec l’interconnexion croissante de notre société.
OFS/CDIP 2001 PRÉPARÉS POUR LA VIE ?
PAGE 21
UN POTENTIEL POUR LE FUTUR
FIGURE 5:
Compétences en lecture des garçons et des filles de 9e, en 2000
Groupe à risque
Niveau de compétences 1 et < 1
Réfléchir et porter
un jugement critique
Interpréter un texte
Trouver des informations dans un texte
5%
0
5
10%
Filles
10
15%
Garçons
15
20%
25%
20
25
30%
30
© OFS/CDIP
Très bons lecteurs et lectrices
Niveau de compétences 5
ilen
Réfléchir et porter
un jugement critique
ren
Interpréter un texte
hen
0%
Trouver des informations dans un texte
0%
5%
0
5
OFS/CDIP 2001 PRÉPARÉS POUR LA VIE ?
10%
Filles
PAGE 22
Garçons
10
15%
15
20%
20
© OFS/CDIP
Perspectives
L’inégalité des conditions d’apprentissage entre
plus poussées, qui contribueront à expliquer les
enfants et adolescents d’origines sociale et culturelle
résultats des jeunes Suisses. Des rapports approfon-
différentes et entre garçons et filles est un réel pro-
dis seront régulièrement publiés au cours des deux
blème tant sur le plan individuel que sur le plan
prochaines années qui jetteront une lumière nouvelle
social. Elle exige que des mesures soient prises en
sur l’évaluation internationale des compétences.
politique de l’éducation. L’élève qui est désavantagé
Dans trois ans, les résultats du 2e cycle de l’enquête
par des conditions d’apprentissage défavorables a le
PISA seront publiés. La comparaison de ces résultats
plus souvent des résultats inférieurs à ceux dont il
avec ceux que nous présentons aujourd’hui sera du
serait capable, ce qui signifie en d’autres termes que
plus grand intérêt parce qu’elle livrera des informa-
ses compétences potentielles sont insuffisamment
tions sur les effets de la nouvelle orientation prise
exploitées.
par la Suisse en matière de politique de l’éducation.
Cette situation est tragique sur le plan individuel,
La Conférence suisse des directeurs cantonaux de
car les personnes qui n’ont pas une solide formation
l’instruction publique a pour projet d’étudier en pro-
voient leurs perspectives d’emploi diminuer considé-
fondeur des thèmes importants pour notre politique
rablement. De bonnes compétences en lecture, en
de l’éducation afin de pouvoir en tirer des mesures
écriture et en mathématiques, ainsi qu’un minimum
concrètes.
de connaissances en sciences sont une condition
préalable pour pouvoir mener une carrière avec succès, mais aussi pour poursuivre une formation, générale ou professionnelle, sans laquelle il n’est plus possible de comprendre les évolutions de la société et de
l’économie. Sur le plan social, l’exploitation insuffisante des compétences potentielles a aussi des
conséquences, un haut niveau d’éducation étant à la
base du succès économique d’un pays et de sa capacité à soutenir la concurrence sur les marchés de
pointe. Or, ce haut niveau d’éducation est fortement
compromis si l’on néglige de pousser les enfants et
les adolescents désavantagés par des conditions
d’apprentissage défavorables.
Les résultats présentés ici ne permettent pas de
dire dans quelle mesure les mauvaises conditions
d’apprentissage d’une proportion relativement
importante de jeunes ont pesé sur le score de la
Suisse. Des explications qui paraissent plausibles à
première vue devraient être confirmées par des comparaisons internationales des corrélations existant
entre ces conditions d’apprentissage et les compétences. Comme PISA mise sur la continuité, les présents résultats peuvent servir à émettre des hypothèses et fournir un point de départ à des analyses
OFS/CDIP 2001 PRÉPARÉS POUR LA VIE ?
PAGE 23
Exemples de test
Exemple de test N° 1: épreuve de lecture
POPULATION ACTIVE
Le diagramme en arbre ci-dessous présente la structure de la population active d’un pays, c’est-à-dire sa «population en âge de travailler». En 1995, la population totale de ce pays était d’environ 3,4 millions d’habitants.
La structure de la population active au 31 mars 1995 (x 1000)1
Population
en âge de travailler2
2656,5
Sont sur le marché
du travail
1706,5 64,2%
Ne sont pas sur
le marché du travail3
949,9 35,8%
Actifs occupés
1578,4 92,5%
Temps plein
1237,1 78,4%
Chômeurs
128,1 7,5%
temps partiel
341,3 21,6%
À la recherche d’un
emploi à temps plein
101,6 79,3%
À la recherche d’un
emploi à temps plein
23,2 6,8%
À la recherche d’un
emploi à temps partiel
26,5 20,7%
Non-demandeurs d’un
emploi à temps plein
318,1 93,2%
Notes
1
Le nombre de personnes est exprimé en milliers (x 1000).
2
La population en âge de travailler est définie comme l’ensemble des personnes âgées de 15 à 65 ans.
3
Les personnes qui «ne sont pas sur le marché du travail» sont celles qui ne sont pas activement à la recherche
d’un emploi ou ne sont pas disponibles pour travailler.
Source: D. Miller, Form 6 Economics, ESA Publications, Box 9453, Newmarket, Auckland NZ, p. 64.
OFS/CDIP 2001 PRÉPARÉS POUR LA VIE ?
PAGE 24
EXEMPLES DE TEST
Utilisez les informations sur la population active d’un pays présentées sur la page ci-contre pour répondre aux
questions suivantes.
Question 1: POPULATION ACTIVE
Combien de personnes en âge de travailler ne sont pas sur le marché du travail? (Écrivez le nombre de personnes, non le pourcentage).
Question 2: POPULATION ACTIVE
À quelle catégorie du diagramme en arbre appartiennent les personnes suivantes, pour autant qu’il y ait une
catégorie qui convienne?
Indiquez votre réponse en faisant une croix dans la case appropriée.
N’est compris dans aucune catégorie
du travail»
«Ne sont pas sur le marché
chômeurs»
«Sur le marché du travail:
actifs occupés»
«Sur le marché du travail:
La première croix a été faite à votre place, à titre d’exemple.
Un serveur à mi-temps, âgé de 35 ans
x
■
■
■
■
Une femme d’affaires de 43 ans
■
■
■
■
Un étudiant à plein temps, âgé de 21 ans
■
■
■
■
Un homme, âgé de 28 ans, qui a cédé son
■
■
■
■
■
■
■
■
■
■
■
■
qui travaille 60 h par semaine
commerce récemment et qui cherche du travail
Une femme de 55 ans qui n’a jamais travaillé
ni voulu travailler en dehors de son ménage
Une grand-mère âgée de 80 ans qui travaille
encore quelques heures par jour sur le stand
que la famille tient au marché
OFS/CDIP 2001 PRÉPARÉS POUR LA VIE ?
PAGE 25
EXEMPLES DE TEST
Question 3: POPULATION ACTIVE
Supposez que des informations sur la structure de la population active soient présentées chaque année dans
un diagramme comme celui de cet exercice.
Le tableau ci-dessous présente quatre données figurant dans le diagramme. Peut-on s'attendre à ce que ces
données changent d’une année à l’autre? Répondez en entourant «Changeront» ou «Ne changeront pas» pour
chacune des quatre données. La première réponse a été entourée à votre place, à titre d’exemple.
Données du diagramme
Réponses
Les intitulés de chaque cellule
Changeront / Ne changeront pas
(par ex.: «sont sur le marché du travail»)
Les pourcentages (par ex. «64,2%»)
Changeront / Ne changeront pas
Les chiffres (par ex. «2656,5»)
Changeront / Ne changeront pas
Les notes au bas du diagramme en arbre
Changeront / Ne changeront pas
Question 4: POPULATION ACTIVE
L’information sur la population active est présentée sous forme de diagramme en arbre, mais elle aurait pu
être présentée de bien d’autres manières, par exemple une description écrite, un diagramme en «camembert »,
un graphique ou un tableau.
Le diagramme en arbre a vraisemblablement été choisi parce qu’il est particulièrement utile pour présenter:
A l’évolution dans le temps.
B la taille de la population totale du pays.
C les catégories au sein de chaque groupe.
D la taille de chacun des groupes.
Exemple de test N° 2: épreuve de mathématiques
VITESSE D'UNE VOITURE DE COURSE
Ce graphique présente les variations de vitesse d’une voiture de course sur un circuit plat de 3 km au cours du
deuxième tour.
Vitesse d’une voiture de course sur un circuit de 3 km (deuxième tour)
180
160
140
120
100
Vitesse (km/h)
80
60
40
20
0.5
1.5
2.5
0
0
0.2
0.4
0.6
0.8
1
1.2
Ligne de départ
OFS/CDIP 2001 PRÉPARÉS POUR LA VIE ?
1.4
1.6
1.8
2
2.2
2.4
2.6
2.8
3
Distance sur le circuit (km)
PAGE 26
EXEMPLES DE TEST
Question 1: VITESSE D'UNE VOITURE DE COURSE
À quelle distance approximative de la ligne de départ se situe le début de la plus longue ligne droite du
circuit?
A À 0,5 km
B À 1,5 km
C À 2,3 km
D À 2,6 km
Question 2: VITESSE D'UNE VOITURE DE COURSE
Où a-t-on enregistré la vitesse la plus basse au cours du second tour?
A À la ligne de départ
B À environ 0,8 km
C À environ 1,3 km
D À mi-parcours du circuit
Question 3: VITESSE D'UNE VOITURE DE COURSE
Que pouvez-vous dire de la vitesse de la voiture entre les bornes de 2,6 km et de 2,8 km?
A La vitesse de la voiture est constante.
B La vitesse de la voiture augmente.
C La vitesse de la voiture diminue.
D La vitesse de la voiture ne peut être déterminée à partir du graphique.
Question 4: VITESSE D'UNE VOITURE DE COURSE
Voici le tracé de cinq circuits:
Sur lequel de ces circuits la voiture roulait-elle lors de l’enregistrement du graphique de vitesse présenté au
début?
L
L
B
A
L
C
L
D
L
E
L = Ligne de départ
OFS/CDIP 2001 PRÉPARÉS POUR LA VIE ?
PAGE 27
EXEMPLES DE TEST
Exemple de test N° 3: épreuve de sciences
JOURNAL DE SEMMELWEIS
Journal de Semmelweis – texte 1
«Juillet 1846. La semaine prochaine, je prendrai mon service en tant que ‹Herr Doktor› à la première salle de
la maternité de l’Hôpital général de Vienne. J’ai été effrayé quand j’ai appris le pourcentage de patientes qui
meurent dans cette clinique. Pas moins de 36 mères sur 208 y sont mortes ce mois-ci, toutes de fièvre puerpérale. Donner naissance à un enfant est aussi dangereux qu’une pneumonie de type 1».
Nombre de décès dus à la fièvre puerpérale
pour 100 accouchements
Ces lignes tirées du journal d’Ignaz Semmelweis
15
(1818–1865) illustrent les effets dévastateurs de la
10
Nombre de décès
fièvre puerpérale, une maladie contagieuse qui tuait
Première
salle
de nombreuses femmes après leur accouchement.
Semmelweis a recueilli des données relatives au
nombre de décès dus à la fièvre puerpérale dans la
première et la deuxième salle de la maternité (voir
5
Seconde
salle
1841
1842
graphique).
1843
1844
1845
1846
Les médecins, et parmi eux Semmelweis, ne savaient pratiquement rien sur la cause de la fièvre puerpérale.
Voici un nouvel extrait du journal de Semmelweis:
«Décembre 1846. Pourquoi tant de femmes meurent-elles de cette fièvre après un accouchement sans la
moindre complication? Depuis des siècles, la science nous dit qu’il s’agit d’une épidémie invisible qui décime
les mères. Les causes pourraient être une altération de l’air, quelque influence extraterrestre ou un mouvement de la Terre elle-même, comme un tremblement de terre».
De nos jours, peu de gens envisageraient encore une influence extraterrestre ou un tremblement de terre
comme causes possibles d’une fièvre. Mais à l’époque où vivait Semmelweis, de nombreuses personnes y
croyaient, y compris des savants! À présent, nous savons que cela est lié aux conditions d’hygiène. Semmelweis savait qu’il était peu probable que la fièvre puisse être provoquée par une influence extraterrestre ou un
tremblement de terre. Il a mis en avant les données qu’il avait recueillies (voir graphique) et s’en est servi pour
tenter de convaincre ses confrères.
Journal de Semmelweis – texte 2
Une partie des recherches menées dans cet hôpital concernait la dissection. Le corps d’une personne décédée
était ouvert dans le but de découvrir la cause du décès. Semmelweis rapporte que les étudiants qui travaillaient
dans la Première salle participaient généralement aux séances de dissection des femmes qui étaient mortes le
jour précédent, avant d’aller examiner les femmes qui venaient juste d’accoucher. Ils ne prenaient pas vraiment
la peine de se laver après les dissections. Certains étaient même fiers qu’on puisse repérer, à leur odeur, qu’ils
avaient travaillé à la morgue, car cela démontrait à quel point ils étaient zélés!
Un ami de Semmelweis mourut après s’être coupé pendant une de ces séances de dissection. L’autopsie de son
corps révéla les mêmes symptômes que ceux des mères emportées par la fièvre puerpérale. Cela donna à Semmelweis une nouvelle idée.
OFS/CDIP 2001 PRÉPARÉS POUR LA VIE ?
PAGE 28
EXEMPLES DE TEST
Question 1: JOURNAL DE SEMMELWEIS
Mettez-vous à la place de Semmelweis. En vous fondant sur les données recueillies par Semmelweis, donnez
une raison de penser que la fièvre puerpérale n'est probablement pas provoquée par des tremblements de
terre.
Question 2: JOURNAL DE SEMMELWEIS
La nouvelle idée de Semmelweis est en relation avec le pourcentage élevé de femmes qui meurent dans les
salles de maternité et avec le comportement des étudiants.
Quelle est cette idée?
A Si on exigeait que les étudiants se lavent après les séances de dissection, cela devrait provoquer un recul
de la fièvre puerpérale.
B Les étudiants ne devraient pas participer aux séances de dissection parce qu’ils risquent de s’y couper.
C Les étudiants sentent mauvais parce qu’ils ne se lavent pas après les séances de dissection.
D Les étudiants veulent montrer qu’ils sont zélés, ce qui les rend négligents lorsqu’ils examinent les
patientes.
Question 3: JOURNAL DE SEMMELWEIS
Les efforts déployés par Semmelweis pour réduire le nombre de décès dus à la fièvre puerpérale ont été couronnés de succès. Toutefois, même aujourd’hui, la fièvre puerpérale demeure une maladie extrêmement difficile à éliminer.
Les fièvres difficiles à guérir restent un problème dans les hôpitaux. De nombreuses mesures de routine sont
prises pour maîtriser ce problème. Une de ces mesures consiste à laver les draps des lits à des températures
très élevées.
Expliquez pourquoi le recours à une température très élevée lors du lavage des draps permet de réduire le
risque de voir les patients contracter de la fièvre.
Question 4: JOURNAL DE SEMMELWEIS
De nombreuses maladies peuvent être soignées par les antibiotiques. Toutefois, l’efficacité de certains antibiotiques contre la fièvre puerpérale a diminué ces dernières années.
Pour quelle raison?
A Une fois produits, les antibiotiques perdent progressivement leurs principes actifs.
B Les bactéries deviennent résistantes aux antibiotiques.
C Ces antibiotiques ne sont utiles que contre la fièvre puerpérale, et pas contre d’autres maladies.
D On a moins besoin de ces antibiotiques, en raison des progrès considérables de ces dernières années en
matière de santé publique.
OFS/CDIP 2001 PRÉPARÉS POUR LA VIE ?
PAGE 29
Préparés pour la vie?
Les compétences de base des jeunes – Synthèse du rapport national PISA 2000
Impressum
Internet
Editeurs
Cette brochure est disponible à l’adresse Internet
Office fédéral de la statistique (OFS) et
www.pisa.admin.ch
Conférence suisse des directeurs cantonaux
de l‘instruction publique (CDIP)
Autres langues
Cette brochure existe également en allemand
Auteur
(473-0000), italien (475-0000) et en anglais
Urs Moser, Centre de compétences en évalua-
(476-0000).
tion des formations et des acquis à l’Université
de Zurich
Traduction
Services linguistiques de l’OFS, Neuchâtel
Complément d‘information
Andrea Meyer, OFS, section de la formation
Graphisme du titre/Graphisme/Layout
scolaire et professionelle,
eigenart, Büro für Layout und Gestaltung,
tél. 032 713 67 35,
Stefan Schaer, Berne
e-mail: [email protected]
Photo
Diffusion
kontrast, Atelier für Fotografie,
Office fédéral de la statistique
Thomas Wiedmer, Schönbühl-Urtenen
CH-2010 Neuchâtel
Tél. 032 713 60 60 / fax 032 713 60 61
Impression
Druckerei Paul Haupt AG, Berne
Numéro de commande
474-0000
Copyright
OFS/CDIP, Neuchâtel 2001
Prix
La reproduction est autorisée, sauf à des fins
gratuit
commerciales, si la source est mentionnée.
Série
ISBN
Pilotage du système de formation en Suisse
3-303-15246-2
OFS/CDIP 2001 PRÉPARÉS POUR LA VIE ?
PAGE 30
Monitoraggio della formazione in Svizzera
Pronti per la vita?
Le competenze di base dei giovani –
Sintesi del rapporto nazionale PISA 2000
Urs Moser
OECD – PISA Programme for International Student Assessment
Indice
Presentazione
pagina 4
Premessa
pagina 6
PISA in sintesi
pagina 8
La Svizzera nel
confronto internazionale
pagina 11
Peculiarità delle regioni linguistiche
pagina 17
Potenziale per il futuro
pagina 18
Prospettive
pagina 23
Esempi di prova
pagina 24
Editori
Ufficio federale di statistica (UST) e Conferenza
svizzera dei direttori cantonali della pubblica
educazione (CDPE)
Presentazione
Nello scorso decennio, la politica dell’istruzione svizzera si è occupata
soprattutto della riforma contenutistica
e strutturali dell’istruzione. Si tratta di
dotare le generazioni future delle competenze necessarie per far fronte in
modo innovativo alle crescenti esigenze
sociali. I temi politici d’attualità sono:
estensione dei processi d’apprendimento sull’arco di tutta la vita, misurazione
e gestione della qualità, uso efficiente
delle risorse finanziarie e umane, rete
di informazioni pertinenti.
L’assicurazione della qualità dell’istruzione si basa logicamente sui risultati
del processo di apprendimento. Le prestazioni scolastiche degli allievi nelle
discipline principali lettura, matematica
e scienze naturali al termine della scuola dell’obbligo possono essere interpretate come l’effetto cumulato della carriera scolastica. Un confronto con le
prestazioni di altri sistemi formativi fornisce informazioni preziose sui punti
forti e sui punti deboli del proprio sistema formativo.
È sulla base di queste premesse che la
Svizzera ha deciso di partecipare al progetto internazionale PISA (Programme
for International Student Assessment).
Non è stata una decisione difficile dal
UST/CDPE 2001 PRONTI PER LA VITA?
PAGINA 4
momento che la Svizzera vantava già
una solida base di esperienze, fatte in
precedenti progetti concepiti in modo
analogo (ad esempio TIMSS, IALS).
Inoltre, le misurazioni di PISA sono
effettuate sull’arco di dieci anni, il che
permette di analizzare l’impatto delle
misure politiche.
Un’importante caratteristica della struttura svizzera del progetto è la stretta
collaborazione tra la Confederazione
(Ufficio federale di statistica, UST) e i
Cantoni (Conferenza dei direttori cantonali della pubblica educazione, CDPE),
che ruota attorno al finanziamento
comune. Questa collaborazione è arricchita da un’altra dimensione: in futuro,
nell’ambito di una serie speciale saranno pubblicati fatti, analisi, piani e indicatori fondamentali per assicurare la
qualità dell’istruzione. La collana sarà
edita dall’UST e dalla CDPE.
La partecipazione a una valutazione
internazionale delle prestazioni come
PISA richiede un notevole investimento
di risorse finanziarie e ottime competenze scientifiche. In queste circostanze,
la buona riuscita del progetto è fonte di
particolare soddisfazione. I risultati disponibili ora sulle prestazioni degli allievi svizzeri mostrano tuttavia che sono
PRESENTAZIONE
necessarie ulteriori analisi dettagliate
per poter capire meglio il funzionamento del nostro sistema d’insegnamento
alfine d’introdurre misure concrete. La
politica dell’istruzione è chiamata a
mettere a disposizione le risorse per i
lavori d’analisi e il necessario perfezionamento delle competenze scientifiche.
Un sentito grazie vada a tutti i partecipanti, che con grande impegno hanno
contribuito al successo di PISA.
COMITATO DIRETTIVO PISA.ch
Martine Brunschwig Graf
Carlo Malaguerra
Consigliera di Stato responsabile del Dipartimento
Direttore dell’Ufficio federale di statistica, Neuchâtel
dell’istruzione pubblica di Ginevra
Gerhard M. Schuwey
Ernst Buschor
Direttore dell’Ufficio federale dell’educazione e della
Consigliere di Stato responsabile del Dipartimento
scienza, Berna
dell’istruzione pubblica di Zurigo
Hans Ambühl
Segretario generale della CDPE, Berna
UST/CDPE 2001 PRONTI PER LA VITA?
PAGINA 5
Premessa
Il progetto PISA (Programme for International Student Assessment) permette a
ogni Paese partecipante di valutare le
competenze dei propri giovani al termine della scuola dell’obbligo. Questa
valutazione può e deve sollevare interrogativi fondamentali sulla società e
sulla politica dell’istruzione: quali sono
le capacità essenziali che le nostre scuole devono trasmettere agli allievi per
consentire loro di partecipare con successo, in futuro, alla vita della società?
Qual è la formazione di base necessaria
per essere all’altezza delle sfide di un
mondo globalizzato e tecnologizzato?
Nel raffronto internazionale, quali sono i
punti forti e i punti deboli del proprio
sistema formativo? I primi risultati della
rilevazione PISA 2000 forniscono ora
basi e spunti per iniziare a discutere di
questi interrogativi.
Il rapporto di sintesi qui presentato
«Pronti per la vita?» anticipa il rapporto
nazionale dello stesso titolo, che sarà
pubblicato nella primavera del 2002. La
versione sintetica contiene i principali
risultati e riprende importanti informazioni di base sul progetto PISA e su alcuni temi attuali della ricerca sull’istruzione. Anche l’OCSE ha pubblicato un
primo rapporto PISA integrale, intitolato
«Knowledge and Skills for Life». Con
UST/CDPE 2001 PRONTI PER LA VITA?
PAGINA 6
questi rapporti nazionali e internazionali
si chiude la prima fase del progetto PISA.
Alla buona riuscita dello studio hanno
contribuito numerose persone e istituzioni. Un particolare grazie vada agli
allievi della Svizzera che hanno partecipato a PISA 2000. Per lo svolgimento e
l’organizzazione dei test ringraziamo le
scuole, e in particolare i coordinatori
scolastici, i somministratori dei test e i
centri di coordinamento regionale, che
con competenza hanno condotto la rivelazione nelle regioni partecipanti al test.
La Confederazione e i Cantoni assicurano il finanziamento nazionale e l’orientamento strategico tramite i loro rappresentanti nel Comitato direttivo. Per
quanto riguarda la concezione, i contenuti e i metodi, la direzione nazionale
del progetto ha inoltre potuto contare
sul sostegno attivo di vari attori: ringraziamo in particolare gli esponenti della
scienza, della politica dell’istruzione e
della prassi appartenenti alla rete PISA,
gli esperti di didattica per la partecipazione attiva all’elaborazione del materiale internazionale per i test, il gruppo
di campionamento per la strutturazione
e l’estrazione del campione, i ricercatori
nel campo dell’istruzione appartenenti
alla rete d’analisi per l’elaborazione di
una strategia di valutazione coerente per
PREMESSA
PISA 2000 nonché i nove autori del
primo rapporto nazionale.
L’organizzazione e il coordinamento
internazionale del progetto generale
sono stati assicurati dal Segretariato
OCSE del programma PISA, le decisioni
generali e quindi anche la responsabilità
politica dal Consiglio dei Paesi partecipanti e la realizzazione operativa nonché tecnico-pratica dal Consorzio internazionale, che vanta un’esperienza pluriennale in materia di concezione e realizzazione di rilevazioni nazionali ed
internazionali. Vogliamo rivolgere un
grazie anche agli esperti dei Paesi partecipanti, riuniti nei gruppi di lavoro, che
garantiscono che gli obiettivi di PISA si
basino sulle migliori competenze scientifiche e procedurali disponibili nel campo
degli studi comparativi internazionali.
PISA è un programma pluriennale. I preparativi per il secondo ciclo sono già iniziati. In aprile e maggio 2002, in alcune
scuole selezionate avrà luogo un nuovo
test pilota. Nella primavera del 2003
verrà poi realizzato il secondo test principale. È con trepidazione che aspettiamo i risultati di questo secondo ciclo,
che ci consentiranno di paragonare i due
anni 2000 e 2003 e di formulare prime
osservazioni sull’evoluzione. Speriamo
ancora nel grande sostegno, nella collaborazione competente e in un interesse
pari o addirittura superiore nei confronti
del progetto PISA.
Huguette McCluskey e la direzione
DEL PROGETTO PISA.ch
UST/CDPE 2001 PRONTI PER LA VITA?
PAGINA 7
PISA
in sintesi
Continuità nel confronto internazionale
delle prestazioni scolastiche
Con PISA è stata inaugurata una nuova epoca di
INFO 1
I dati fondamentali di PISA
confronto internazionale delle prestazioni scolastiche: per la prima volta, su mandato dell’Organizza-
Un’istruzione per il futuro
zione per la cooperazione e lo sviluppo economico
Il «Programme for International Student As-
(OCSE), sono stati paragonati a livello internazionale
sessment» (PISA) fa parte del programma
i risultati diretti dei sistemi formativi. È da tempo che
d’indicatori «Indicators of Educational Sys-
l’OCSE attira l’attenzione sull’importanza di un livel-
tems» (INES) dell’Organizzazione per la co-
lo d’istruzione elevato per il benessere dell’economia
operazione e lo sviluppo economico (OCSE).
nazionale di un Paese, ma finora, nell’ambito degli
Lo scopo di PISA è quello di fornire agli Stati
indicatori della formazione calcolati annualmente, si
membri dell’OCSE indicatori delle competen-
era sempre limitata a parametri quantificabili, come
ze dei quindicenni in lettura, matematica e
le spese per l’istruzione o la frequenza di diplomi ai
scienze naturali. Vengono rilevate anche le
vari livelli del sistema formativo, lasciando ad altre
condizioni per l’apprendimento autonomo,
organizzazioni il compito di misurare i risultati del
come l’interesse nei confronti dell’apprendi-
processo d’insegnamento e apprendimento. I risulta-
mento o il sostegno dell’apprendimento
ti presentati, inoltre, per la prima volta non rappre-
mediante opportune strategie. Una parte
sentano la conclusione di un’indagine unica: PISA è
dei Paesi partecipa inoltre a un confronto
invece un programma che punta sulla continuità.
internazionale della dimestichezza con il com-
Ogni tre anni, ai Paesi partecipanti è offerta la possi-
puter.
bilità di valutare la propria situazione sul piano inter-
Per il momento, PISA comprende tre cicli
nazionale in riferimento a varie competenze. È così
con priorità differenti. Il primo ciclo (PISA
possibile anche osservare l’evoluzione e valutare l’ef-
2000) mette l’accento sulla descrizione diffe-
ficacia delle misure adottate nell’ambito della politica
renciata della competenza nella lettura, men-
dell’istruzione.
tre i risultati in matematica e scienze naturali
sono presentati meno in dettaglio. PISA 2003
La formazione di base al termine
si concentrerà invece sulla matematica e PISA
della scuola dell’obbligo
2006 sulle scienze naturali.
Un altro vantaggio di PISA risiede nella molteplicità e
nella definizione delle prestazioni rilevate. Il cardine
250 000 allievi provenienti da 32 Paesi
dell’indagine è costituito dai test, che consentono
Nella primavera del 2000, circa 250 000 allie-
conclusioni differenziate sulle competenze dei quin-
vi provenienti da 32 Paesi hanno svolto un
dicenni in lettura, matematica e scienze naturali. In
test e compilato un questionario. Di norma,
questo esercizio, PISA non si orienta solo alle nozio-
per ogni Paese hanno partecipato almeno
ni curricolari, trasmesse principalmente a scuola, ma
4500 allievi di 150 scuole.
a una formazione di base di cui dovrebbero disporre
i giovani al termine della scuola dell’obbligo.
Per consentire un confronto internazionale corretto, al momento del test gli allievi
In vista degli ulteriori percorsi formativi e dell’ac-
dovevano avere 15 anni. Vista l’età superiore
cesso al mondo del lavoro, tuttavia, le sole compe-
al momento della scolarizzazione, nel con-
tenze specifiche non bastano. Per questo motivo,
UST/CDPE 2001 PRONTI PER LA VITA?
PAGINA 8
PISA IN SINTESI
Confronto internazionale tra i quindicenni
fronto internazionale gli allievi svizzeri aveva-
I risultati presentati qui di seguito si riferiscono a circa
no alle spalle generalmente meno anni di
250 000 quindicenni provenienti da 31 Paesi, tra cui
scuola. Siccome il confronto internazionale di
6100 svizzeri. Al confronto internazionale hanno
allievi della stessa età non tiene conto di que-
partecipato 27 Stati membri dell’OCSE più il Brasile,
sta circostanza, per confronti all’interno della
la Lettonia, il Liechtenstein e la Russia. I risultati del
Svizzera è stato inoltre formato un campione
confronto internazionale sono rappresentativi per i
rappresentativo di allievi del 9° anno di scuo-
quindicenni residenti nei Paesi partecipanti.
la. In Svizzera sono quindi stati sottoposti al
test e interrogati complessivamente più di
13 000 giovani.
Formazione di base o preparazione alla vita
INFO 2
Lettura, matematica
e scienze naturali
All’età di 15 anni, la maggior parte dei giovani è alla fine della scuola dell’obbligo e
La formazione di base nella lettura
dovrebbe disporre di adeguate competenze
Nella formazione di base nella lettura rientra-
in lettura, matematica e scienze naturali. Per
no la comprensione di determinate informa-
questo motivo, PISA esamina la formazione
zioni contenute in un testo, l’identificazione
di base in queste discipline o, in altri termini,
dei messaggi centrali del testo, nonché l’inter-
le competenze in lettura, matematica e scien-
pretazione e l’analisi critica del suo contenuto
ze naturali che dovrebbero far parte del
o della sua forma. I giovani hanno quindi
bagaglio dei quindicenni. Queste competen-
dovuto svolgere una serie di compiti differen-
ze sono sì insegnate e imparate a scuola, ma
ti, dalla comprensione e utilizzazione di un
invece di essere legate a uno specifico pro-
testo alla riflessione sul testo. I testi si ispira-
gramma didattico possono essere applicate in
vano a situazioni quotidiane ed erano orienta-
vari contesti. Ogni membro della nostra
ti al tema della partecipazione alla vita sociale.
società dovrebbe disporre di questa forma-
In base a questa concezione, i risultati in
zione di base.
lettura hanno potuto essere suddivisi nei tre
ambiti «ricerca d’informazioni nel testo»,
«interpretazione del testo» e «riflessione sul
sono rilevate anche importanti condizioni per il suc-
testo e giudizio sulla forma e sul contenuto».
cesso dell’apprendimento, come l’applicazione di
strategie d’apprendimento, l’interesse nei confronti
La formazione di base in matematica
dell’apprendimento e la fiducia nelle proprie capaci-
La formazione di base in matematica com-
tà. I giovani interessati e consapevoli delle proprie
prende conoscenze e capacità matematiche,
capacità adottano strategie d’apprendimento mirate
dalla padronanza dei procedimenti matemati-
e sono quindi allievi con un’elevata competenza atti-
ci standard alla comprensione matematica
va. Sono inoltre capaci di regolare autonomamente
complessa. I compiti di matematica si orienta-
importanti aspetti del loro processo di apprendimen-
vano principalmente ai concetti alla base della
to a lungo termine. L’apprendimento autoregolato è
matematica, come il caso, la variazione e la
una premessa che consente agli allievi di sfruttare in
crescita o lo spazio e le forme. Nei compiti
modo ottimale il loro potenziale di rendimento e rap-
erano poi integrate le discipline scolastiche
presenta quindi un criterio di qualità fondamentale
classiche aritmetica, algebra e geometria.
del sistema formativo.
Anche in matematica, i compiti si ispiravano
Nell’attuale società del sapere, anche la sicurezza
alle esigenze della vita attuale e futura.
nell’uso delle moderne tecnologie dell’informazione
e della comunicazione è una premessa per il succes-
La formazione di base in scienze
so nella carriera scolastica e professionale. PISA ha
Nella formazione di base in scienze rientrano
quindi rilevato anche la dimestichezza nell’uso del
le capacità di capire il mondo mediante con-
computer.
UST/CDPE 2001 PRONTI PER LA VITA?
PAGINA 9
PISA IN SINTESI
cetti delle scienze naturali, di riconoscere gli
aspetti scientifici e di trarne delle conseguenze. I concetti scientifici inclusi nel test riguardavano temi attuali, come vita e salute, terra
e ambiente, tecnologia. In questo senso,
rispecchiavano benissimo i concetti correnti
della fisica, della chimica, della biologia e delle
scienze della terra. I test, però, richiedevano
non solo la conoscenza di questi concetti, ma
anche la capacità di applicarli ai temi attuali e
alle situazioni quotidiane.
UST/CDPE 2001 PRONTI PER LA VITA?
PAGINA 10
La Svizzera nel
confronto internazionale
Buoni in matematica, discreti in lettura
tati dei giovani svizzeri si collocano nella media. Ciò
e in scienze naturali
corrisponde alle aspettative in base ai risultati di
In tutte e tre le discipline dei test, sono in testa i gio-
recenti studi internazionali, come il Third Internatio-
vani residenti in Finlandia, Giappone e Corea del
nal Mathematics and Science Study, TIMSS (1997),
Sud. Raggiungono risultati di spicco in lettura, mate-
l’International Adult Literacy Survey, IALS (1996) o
matica e scienze naturali anche gli allievi della Nuova
l’IEA-Reading-Literacy-Study (1993). Gli allievi sviz-
Zelanda, del Canada, dell’Australia e della Gran Bre-
zeri sono tra i migliori del mondo in matematica, ma
tagna (cfr. tabella 1).
sono nettamente distaccati dai Paesi che si trovano ai
I giovani svizzeri ottengono un buon risultato in
primi posti in lettura e in scienze naturali.
matematica – attestandosi come in passato dietro le
Un confronto con i Paesi limitrofi mostra che, in
nazioni di testa Giappone e Corea del Sud, ma anche
lettura, i giovani svizzeri in media raggiungono risul-
dietro la Nuova Zelanda, la Finlandia, l’Australia e il
tati pari a quelli dei giovani austriaci, francesi, italia-
Canada. In lettura e in scienze naturali, invece, i risul-
ni e tedeschi. In matematica, il risultato dei giovani
svizzeri è nettamente migliore di quello dei giovani
tedeschi e italiani. In scienze naturali, invece, i giova-
INFO 3
Differenze statisticamente
significative
ni austriaci ottengono risultati sensibilmente migliori
degli svizzeri.
Rispetto al Giappone, alla Svezia e agli Stati Uniti,
i giovani svizzeri sono un po’ più deboli in lettura, ma
Siccome nei Paesi partecipanti non sono stati
il distacco rispetto ai giovani statunitensi non è stati-
sottoposti ai test tutti i quindicenni (popola-
sticamente significativo. In matematica, invece, i
zione), ma solo dei campioni di quindicenni, i
risultati degli allievi svizzeri sono statisticamente net-
risultati di ogni Paese sono stimati sulla base
tamente migliori di quelli degli Stati Uniti e della Sve-
dei risultati dei quindicenni inclusi nel campio-
zia. Gli allievi giapponesi realizzano le migliori presta-
ne. Le stime dei risultati – ad esempio i valori
zioni del mondo in matematica. Anche in scienze
medi nella scala di lettura – sono quindi sog-
naturali i giovani giapponesi e svedesi ottengono
gette a possibili errori di campionamento. A
risultati sensibilmente migliori di quelli della Svizzera,
seconda della precisione del campione, i risul-
mentre i risultati dei giovani statunitensi sono simili a
tati dei quindicenni stimati si muovono all’in-
quelli degli svizzeri.
terno di una fascia più o meno larga (intervallo di confidenza) attorno al valore reale.
Quota elevata di lettori scarsi
Nell’ambito del controllo dei risultati per
Nel risultato dei gioveni svizzeri in lettura colpisce il
rilevare eventuali differenze statisticamente
fatto che una quota superiore alla media dispone
dimostrabili tra un Paese e l’altro, gli errori di
solo di competenze molto limitate in lettura (cfr. illu-
campionamento sono presi in considerazione.
strazione 1 e info 4: livello inferiore o uguale a 1).
Una differenza tra due Paesi è definita signi-
Come in Germania, più del 20 per cento degli allievi
ficativa, se è verificata e avvalorata con un
al termine della scuola dell’obbligo non è in grado di
test statistico. Non assumono alcun significa-
capire correttamente semplici testi e d’interpretarne il
to le differenze non rivelatesi statisticamente
contenuto. Dispongono solo di competenze rudi-
significative.
mentali in lettura e comprensione della lingua dell’insegnamento. Per il 7 per cento circa degli allievi è
UST/CDPE 2001 PRONTI PER LA VITA?
PAGINA 11
LA SVIZZERA NEL CONFRONTO INTERNAZIONALE
TABELLA 1:
Risultati dei quindicenni svizzeri nel confronto internazionale, 2000
Lettura
Matematica
Scienze naturali
I giovani provenienti
Finlandia
Giappone
Corea del Sud
dai Paesi elencati
Canada
Corea del Sud
Giappone
raggiungono risultati
Nuova Zelanda
Finlandia
migliori di quelli dei
Australia
Gran Bretagna
giovani svizzeri in
Irlanda
Canada
misura statisticamen-
Corea del Sud
Nuova Zelanda
te significativa
Gran Bretagna
Australia
Giappone
Austria
Svezia
Irlanda
Svezia
I giovani provenienti
Austria
Nuova Zelanda
Repubblica Ceca
dai Paesi elencati
Belgio
Finlandia
Francia
raggiungono risultati
Islanda
Australia
Norvegia
che statisticamente
Norvegia
Canada
Stati Uniti
non si distinguono
Francia
(Svizzera)
Ungheria
particolarmente da
Stati Uniti
Gran Bretagna
Islanda
quelli dei giovani
Danimarca
Belgio
Belgio
svizzeri
(Svizzera)
Francia
(Svizzera)
Spagna
Austria
Spagna
Repubblica Ceca
Danimarca
Germania
Italia
Islanda
Polonia
Germania
Liechtenstein
Danimarca
Liechtenstein
Ungheria
Polonia
I giovani provenienti
Grecia
Svezia
Italia
dai Paesi elencati
Portogallo
Irlanda
Liechtenstein
raggiungono risultati
Russia
Norvegia
Grecia
peggiori di quelli dei
Lettonia
Repubblica Ceca
Russia
giovani svizzeri in
Lussemburgo
Stati Uniti
Lettonia
misura statisticamen-
Messico
Germania
Portogallo
te significativa
Brasile
Ungheria
Lussemburgo
Russia
Messico
Spagna
Brasile
Polonia
Lettonia
Italia
Portogallo
Grecia
Lussemburgo
Messico
Brasile
© UST/CDPE
UST/CDPE 2001 PRONTI PER LA VITA?
PAGINA 12
LA SVIZZERA NEL CONFRONTO INTERNAZIONALE
ILLUSTRAZIONE 1:
Distribuzione dei quindicenni tra i livelli di competenza in lettura, 2000
I giovani prove-
Finlandia
nienti dai Paesi
Canada
elencati raggiun-
Nuova Zelanda
gono risultati
migliori di quelli
Australia
dei giovani sviz-
Irlanda
zeri in misura
Corea del Sud
statisticamente
Gran Bretagna
significativa
Giappone
(cfr. tabella 1)
Svezia
I giovani prove-
Austria
nienti dai Paesi
Belgio
elencati raggiun-
Islanda
gono risultati che
statisticamente
Norvegia
non si distinguono
Francia
particolarmente
Stati Uniti
da quelli dei
Danimarca
giovani svizzeri
Svizzera
(cfr. tabella 1)
Spagna
Repubblica Ceca
Italia
Germania
Liechtenstein
Ungheria
Polonia
I giovani prove-
Grecia
nienti dai Paesi
Portogallo
elencati raggiun-
Russia
gono risultati peggiori di quelli dei
Lettonia
giovani svizzeri in
Lussemburgo
misura statistica-
Messico
mente significativa
Brasile
(cfr. tabella 1)
0%
Livello < 1
20%
Livello 1
40%
Livello 2
60%
Livello 3
80%
100%
Livello 4
Livello 5
© UST/CDPE
UST/CDPE 2001 PRONTI PER LA VITA?
PAGINA 13
LA SVIZZERA NEL CONFRONTO INTERNAZIONALE
addirittura quasi impossibile estrarre anche solo semplici informazioni da un testo scritto. In vista dell’integrazione professionale e scolastica, questi allievi
INFO 4
Competenze in lettura
appartengono a un gruppo a rischio, dato che
avranno gravi problemi a soddisfare i requisiti di un
La rilevazione differenziata della competenza
tirocinio professionale o di un corso di perfeziona-
in lettura nel primo ciclo PISA ha permesso
mento professionale (livello inferiore a 1). In Giappo-
una rilevazione rappresentative del livello di
ne, ad esempio, queste quote sono pari a neanche la
competenza in lettura dei giovani al termine
metà: dispone solo di competenze rudimentali in let-
della scuola dell’obbligo. Per pianificare l’i-
tura il 10 per cento circa degli allievi e appartiene al
struzione, non è tanto importante sapere
vero e proprio gruppo a rischio appena il 3 per cento.
quali Paesi raggiungono i valori medi più ele-
La quota di giovani appartenenti al gruppo a rischio
vati, ma piuttosto come si formano questi
è del 6,4 per cento negli Stati Uniti, del 4,4 per cento
valori medi. Per questo motivo, le prestazioni
in Austria, del 4,2 per cento in Francia, del 5,4 per
degli allievi partecipanti sono state ripartite in
cento in Italia e del 3,3 per cento in Svezia. In Ger-
vari livelli.
mania, con il 9,9 per cento, questa quota è tuttavia
nettamente superiore che in Svizzera.
Livello 5: i giovani che raggiungono il livello
massimo di competenza sono in grado di
Quota media di ottimi lettori
capire fin nei minimi dettagli testi complessi
L’OCSE attribuisce alla competenza in lettura un
dal contenuto non familiare. Sono capaci
ruolo importante per il successo nella carriera profes-
d’individuare le informazioni pertinenti e,
sionale. I giovani in grado di capire fin nei minimi
sulla base di tali informazioni, di giudicare cri-
dettagli un testo complesso dal contenuto non fami-
ticamente delle ipotesi, anche con testi
liare e di analizzare criticamente e plausibilmente sia
appartenenti a settori specifici.
la forma che il contenuto del testo, anche se appar-
Livello 4: i giovani che raggiungono il livello
tiene a un settore specifico, dispongono delle condi-
di competenza 4 sono capaci di risolvere
zioni migliori per seguire una formazione superiore e
compiti difficili, come individuare informazio-
profilarsi professionalmente (cfr. illustrazione 1 e info
ni tra le righe, riconoscere sfumature linguisti-
4: livello 5). Nella media internazionale, appartiene a
che e valutare criticamente i testi.
questa élite il 9,4 per cento dei giovani. In Australia,
Livello 3: i giovani che raggiungono il livello
Canada, Finlandia, Nuova Zelanda e Gran Bretagna,
di competenza 3 sono capaci di capire testi di
dispone di ottime competenze in lettura più del 15
difficoltà media, collegare informazioni con-
per cento dei giovani, in Belgio, in Irlanda e negli
tenute in punti diversi del testo e metterle in
Stati Uniti circa il 12 per cento.
relazione alle conoscenze quotidiane con cui
Il 9,2 per cento dei giovani svizzeri raggiunge il
hanno familiarità.
livello massimo di competenza in lettura. Le quote di
Livello 2: i giovani che raggiungono il livello
ottimi lettori sono simili in Svezia (11,2 per cento),
di competenza 2 sono capaci di utilizzare un
Giappone (9,9 per cento), Germania (8,8 per cento),
testo per compiti basilari: ad esempio trarre
Austria (8,8 per cento) e Francia (8,5 per cento). La
semplici conclusioni in base alle informazioni
quota di ottimi lettori è nettamente inferiore a quel-
contenute nel testo o capire il significato di
la della Svizzera in Italia (5,3 per cento). In Russia,
parti del testo attingendo alle loro conos-
Spagna e Portogallo le quote sono addirittura al di
cenze.
sotto del 5 per cento.
Livello 1: i giovani che raggiungono il livello
di competenza 1 dispongono al massimo di
Difficoltà a riflettere e formulare
competenze rudimentali in lettura. Sanno
un giudizio sul testo
estrarre singole informazioni da testi semplici
In lettura, i giovani svizzeri hanno riscontrato le mag-
e collegarle alle loro conoscenze. Non sono
giori difficoltà nei compiti che richiedevano uno sfor-
tuttavia in grado di utilizzare un testo per
zo di riflessione per valutare criticamente un testo.
scopi di apprendimento.
Hanno invece avuto nettamente meno difficoltà nei
UST/CDPE 2001 PRONTI PER LA VITA?
PAGINA 14
LA SVIZZERA NEL CONFRONTO INTERNAZIONALE
compiti in cui bisognava individuare delle informa-
devono (a) memorizzare nuove informazioni (strate-
zioni nel testo o in quelli che richiedevano un’inter-
gie di memorizzazione), (b) integrare nuove informa-
pretazione. Capire e interpretare sono le condizioni
zioni nelle strutture conoscitive esistenti (strategie di
per riflettere e giudicare. Presumibilmente, l’insegna-
elaborazione) e (c) verificare il proprio apprendimen-
mento della lingua in Svizzera presta meno attenzio-
to (strategie di controllo).
I risultati del confronto internazionale sull’ap-
ne alle capacità complesse rispetto ad altri Paesi.
prendimento autonomo non sono tuttavia facili da
Scarso interesse nei confronti dell’apprendimento
interpretare, dal momento che sono il frutto di auto-
L’interesse nei confronti dell’apprendimento è una
valutazioni dei giovani stessi e presentano anche
premessa necessaria per il successo dell’apprendi-
una valenza culturale. I giovani della Corea del Sud,
mento. I giovani che sono anche in grado di regola-
ad esempio, giudicano relativamente scarso il loro
re autonomamente il loro apprendimento mediante
interesse nei confronti della lettura e della matema-
opportune strategie non solo realizzano prestazioni
tica, benché raggiungano ottimi risultati. All'interno
migliori a scuola, ma in generale sono meglio prepa-
di ogni Paese, le relazioni tra le caratteristiche
rati a imparare nella vita. Stimolare l’interesse ad
dell'apprendimento autonomo e i risultati raggiunti
apprendere lungo tutto l’arco della vita è uno dei
sono tuttavia positive: i giovani interessati che
compiti principali della scuola.
sostengono il processo d'insegnamento e apprendi-
Il confronto internazionale sull’apprendimento
mento facendo ricorso a strategie di apprendimento
autonomo, condotto per la prima volta nell’ambito di
realizzano anche migliori prestazioni, sia in Corea
PISA, ha rivelato alcune debolezze tra i giovani sviz-
del Sud che in Svizzera.
zeri. L’interesse nei confronti della lettura e della
matematica dei quindicenni svizzeri non è particolar-
Nessuna paura del computer
mente marcato rispetto a Paesi come la Danimarca,
Il 63 per cento dei quindicenni svizzeri utilizza il com-
la Finlandia e la Svezia. La situazione è un po’ miglio-
puter più volte alla settimana e il 43 per cento navi-
re per quanto riguarda l’applicazione di strategie di
ga su Internet più volte alla settimana (cfr. illustra-
apprendimento. Gli allievi svizzeri si collocano nella
zione 2). Sono dello stesso ordine di grandezza le
media internazionale quando, leggendo un testo,
quote per i quindicenni statunitensi, finlandesi, tede-
ILLUSTRAZIONE 2:
Uso del computer da parte dei quindicenni a scuola e a casa, 2000
Danimarca
Finlandia
Svezia
Stati Uniti
Svizzera
Germania
0%
10%
20%
30%
40%
50%
60%
70%
80%
90%
100%
Uso più volte alla settimana
a scuola
a casa
© UST/CDPE
UST/CDPE 2001 PRONTI PER LA VITA?
PAGINA 15
LA SVIZZERA NEL CONFRONTO INTERNAZIONALE
schi e danesi. In Svezia, invece, utilizza il computer
più volte alla settimana oltre l’80 per cento dei giovani e naviga su Internet più volte alla settimana il 77
per cento. La scuola esercita tuttavia solo un influsso
marginale sull’uso del computer. In tutti i Paesi, il
computer è utilizzato prevalentemente a casa. In
Svizzera, solo il 21 per cento dei quindicenni utilizza
il computer a scuola più volte alla settimana. L’uso
regolare del computer a scuola è meno frequente
che in Svizzera solo in Germania, mentre è più frequente negli Stati Uniti (30 per cento), in Svezia
(45 per cento), in Finlandia (46 per cento) e in
Danimarca (57 per cento). L’uso relativamente poco
frequente del computer nelle scuole svizzere è probabilmente una conseguenza della dotazione lacunosa. Fortunatamente, agli allievi svizzeri non manca
però l’interesse nei confronti del computer, benché
tra le ragazze in misura nettamente inferiore che tra
i ragazzi. Solo negli Stati Uniti e in Germania i giovani
valutano l’interesse nei confronti del computer maggiore che in Svizzera. Purtroppo, molti Paesi non
hanno partecipato all’indagine sulla dimestichezza
con il computer, motivo per cui il confronto internazionale si riferisce solo a pochi Paesi.
UST/CDPE 2001 PRONTI PER LA VITA?
PAGINA 16
Peculiarità delle
regioni linguistiche
Con la sua diversità culturale e linguistica, la Svizze-
L’età differente degli allievi del 9° anno non sem-
ra rappresenta un caso particolare nell’ambito del
bra avere un influsso particolare sulla competenza
confronto internazionale delle prestazioni scolasti-
nella lettura. Nella Svizzera tedesca, la quota di allie-
che. I risultati della Svizzera si riferiscono a giovani
vi che quasi non sanno leggere o che leggono male,
integrati in sistemi formativi in parte molto diver-
pari al 6 per cento, è leggermente superiore che nella
si..Tra l’età di scolarizzazione in Ticino e nella Svizze-
Svizzera italiana o francese (cfr. illustrazione 3: livel-
ra tedesca, ad esempio, vi è quasi un anno di diffe-
lo inferiore a 1 o livello 1). Con oltre l’8 per cento,
renza. Nella Svizzera tedesca, i giovani che frequen-
però, nella Svizzera tedesca è superiore anche la
tano il 9° anno hanno circa dieci mesi in più di quel-
quota di lettori molto competenti (livello 5).
Le competenze in matematica e in scienze natu-
li della Svizzera italiana e circa quattro mesi in più di
rali degli allievi del 9° anno sono diverse tra la
quelli della Svizzera francese.
Vista la varietà delle caratteristiche dei sistemi for-
Svizzera italiana, la Svizzera tedesca e la Svizzera
mativi, è interessante paragonare lo stato della for-
francese. Saranno necessarie analisi più approfondite
mazione alla fine del secondario I all’interno della
per determinare in che misura questi risultati sono
Svizzera. A tale scopo sono state confrontate le pre-
condizionati dall’età o se altre particolarità dei sistemi
stazioni degli allievi del 9° anno delle varie regioni lin-
formativi giocano un ruolo.
guistiche, benché le condizioni iniziali non siano identiche a causa dell’età di scolarizzazione differente.
ILLUSTRAZIONE 3:
Distribuzione degli allievi del 9° anno tra i livelli di competenza in lettura
nelle tre regioni linguistiche della Svizzera, 2000
Svizzera tedesca
Svizzera francese
Svizzera italiana
0%
Livello < 1
20%
Livello 1
40%
Livello 2
60%
Livello 3
80%
Livello 4
100%
Livello 5
© UST/CDPE
UST/CDPE 2001 PRONTI PER LA VITA?
PAGINA 17
Potenziale
per il futuro
I motivi del risultato della Svizzera
«Buoni in matematica, discreti in lettura e in scienze
ne. Nelle risorse non rientra tuttavia solo il
naturali» – un giudizio che richiede una spiegazione:
capitale economico, ad esempio sotto forma
perché gli allievi svizzeri non realizzano ottime pre-
di mezzi finanziari, potere o prestigio, ma
stazioni in tutte e tre le competenze valutate? Non è
anche il capitale culturale o sociale. Il capita-
possibile rispondere esaurientemente a questa
le culturale comprende ad esempio certifica-
domanda, ma alcune analisi approfondite dei risulta-
ti di formazione o oggetti di significato cul-
ti della Svizzera forniscono indicazioni chiare sui set-
turale, come libri e immagini. Il capitale
tori del sistema formativo svizzero in cui è presente
sociale è costituito da reti di relazioni sociali
un potenziale di rendimento degli allievi non ancora
che agevolano l’accesso all’istruzione. I capi-
sfruttato. Prima di poter trarre delle conclusioni sulla
tali economico, culturale e sociale ampliano il
qualità del sistema formativo svizzero in base ai risul-
margine d’azione individuale e influenzano
tati del confronto internazionale, bisognerebbe
positivamente la posizione socioeconomica,
almeno descrivere più precisamente le condizioni
il che si ripercuote favorevolmente anche sul-
nelle quali ha luogo il processo d’insegnamento e
l’utilizzazione dell’offerta d’istruzione. Per
apprendimento.
aumentare il capitale umano vale quindi la
pena d’investire anche nei capitali culturale e
sociale.
Per la politica dell’istruzione è importante
INFO 5
Origine e successo scolastico
scoprire in particolare se la relazione tra origine sociale e prestazione è presente in forma
Le prestazioni scolastiche peggiori dei giova-
analoga in tutti i Paesi o se è invece da ricon-
ni provenienti da famiglie lontane dalla scuo-
durre a determinate caratteristiche del siste-
la sono spesso etichettate come mancanza di
ma formativo.
pari opportunità. Ma non è solamente la qualità dell’offerta d’istruzione, ma anche il
sostegno della famiglia a influenzare in modo
Scolarizzazione tardiva
determinante le opportunità di sviluppo dei
Dai confronti internazionali emerge sempre chiara-
ragazzi e dei giovani.
mente che in Svizzera – soprattutto nella Svizzera
Nella stretta correlazione tra l’origine
tedesca – la scolarizzazione avviene relativamente
sociale e le prestazioni in lettura, matematica
tardi. I giovani residenti nei Paesi dell’OCSE all’età di
e scienze naturali, l’OCSE intravede anche un
15 anni in media hanno già frequentato 9,5 anni di
problema di mancato sfruttamento del
scuola, contro i quasi 9 anni in Svizzera (cfr. tabella
potenziale di rendimento di una società. Dal
2). Il numero relativamente basso di anni di scuola
punto di vista sociale, rifacendosi all’econo-
frequentati spiega tuttavia solo in parte i risultati di-
mia dell’istruzione, sapere e capacità sono
screti in lettura e in scienze naturali. La maggior parte
definiti anche capitale umano.
degli allievi provenienti dai Paesi con i migliori risul-
I ragazzi vantano un bagaglio di risorse
tati in lettura e in scienze è effettivamente andato a
variabile, determinante per il capitale umano
scuola di norma per mezzo anno, talvolta anche per
e per lo sfruttamento dell’offerta d’istruzio-
un anno in più degli allievi svizzeri (Canada, Nuova
Zelanda, Australia, Corea del Sud, Gran Bretagna,
UST/CDPE 2001 PRONTI PER LA VITA?
PAGINA 18
POTENZIALE PER IL FUTURO
Giappone o Austria). Vi sono tuttavia anche delle
dallo stato professionale dei genitori soprattutto in
eccezioni, che mostrano che l’età al momento della
Belgio, Germania e Svizzera.
scolarizzazione non è necessariamente determinante
I risultati sulle relazioni tra le varie caratteristiche
per il risultato di un Paese. I giovani finlandesi, ad
dell’origine sociale dei giovani e le loro prestazioni in
esempio, hanno ottenuto ottimi risultati in tutte e tre
lettura, matematica e scienze naturali mostrano che
le competenze valutate, benché all’età di 15 anni
le scuole svizzere non riescono a eliminare l’influsso
abbiano alle spalle grosso modo tanti anni di scuola
sulle prestazione delle differenti condizioni per l’ap-
quanto i giovani svizzeri.
prendimento.
Famiglie lontane dalla scuola
Il nostro sistema formativo deve creare le condizioni
affinché tutti i ragazzi e i giovani, indipendentemente dalla loro origine economica e sociale, possano beneficiare di offerte d’istruzione corrispondenti
TABELLA 2:
Numero di anni di scolarizzazione
al momento del test per gli allievi
quindicenni, 2000
alle loro capacità. Dal sistema formativo ci si aspetta
che consenta agli allievi di sfruttare il loro potenziale
Brasile
8.5
di rendimento in maniera ottimale. Il successo di
Liechtenstein
8.9
questo intento dipende ampiamente dalla capacità
Finlandia
8.9
della scuola di compensare eventuali condizioni
Svizzera
8.9
sfavorevoli all’apprendimento dei ragazzi e dei
giovani.
Danimarca
9.0
Svezia
9.0
all'origine sociale sono legate in particolare alla for-
Polonia
9.0
mazione dei genitori, alla professione e all'attività
Lussemburgo
9.1
lavorativa dei genitori, nonché alla vicinanza dell'am-
Germania
9.1
biente dei genitori all'istruzione. Per vicinanza all'i-
Ungheria
9.2
struzione s'intende da un canto sia un'affinità dei
Portogallo
9.3
genitori con i libri, la letteratura classica e le opere
Messico
9.4
d'arte, sia la disponibilità dei genitori ad avere con i
Lettonia
9.4
propri figli delle discussioni su temi sociali, politici o
Austria
9.4
culturali. D'altro canto rientrano nella vicinanza all'i-
Irlanda
9.5
struzione anche risorse come l'accesso a Internet o
Francia
9.5
un luogo tranquillo dove studiare.
Repubblica Ceca
9.5
Condizioni sfavorevoli all'apprendimento dovute
I giovani con buoni risultati nelle tre competenze
Stati Uniti
9.5
valutate crescono in famiglie ricche in risorse cultura-
Belgio
9.6
li. Queste risorse si rivelano estremamente importan-
Russia
9.7
ti per le competenze specifiche, soprattutto in lettu-
Spagna
9.7
ra e in scienze naturali, discipline in cui assumono più
Canada
9.8
significato che per la matematica. Un ambiente
Italia
9.9
domestico favorevole al successo dell’apprendimento è dato soprattutto da genitori con una buona for-
Corea del Sud
10.0
mazione.
Giappone
10.0
Assume tuttavia un significato da non sottovalu-
Islanda
10.0
tare per la competenza in lettura anche lo stato pro-
Norvegia
10.0
fessionale dei genitori. Padri e madri che esercitano
Grecia
10.1
una professione che gode di un prestigio elevato e di
Australia
10.1
una retribuzione corrispondente garantiscono un
Gran Bretagna
10.7
Nuova Zelanda
11.0
ambiente vicino all’istruzione in casa e i loro figli realizzano migliori prestazioni in lettura. Tra i Paesi dell’OCSE, le competenze in lettura sono influenzate
© UST/CDPE
UST/CDPE 2001 PRONTI PER LA VITA?
PAGINA 19
POTENZIALE PER IL FUTURO
Svantaggio per i giovani provenienti
sentano chiare lacune. Questo risultato evidenzia
da famiglie immigrate
l’importante sfida di fronte alla quale è posto il
Negli ultimi anni, in Svizzera la quota di giovani pro-
nostro sistema formativo: l’integrazione scolastica
venienti da famiglie immigrate è cresciuta costante-
ottimale dei giovani provenienti da famiglie immigra-
mente e nel 2001 è del 21 per cento circa. Di norma,
te, di norma cresciuti con più lingue.
i giovani provenienti da famiglie immigrate sono
Siccome generalmente le famiglie immigrate stan-
svantaggiati da più punti di vista. Innanzitutto dal-
no peggio economicamente, spesso i genitori hanno
l’ambiente dei genitori non ricevono un sostegno e
diplomi di grado basso e l'ambiente familiare è lon-
una promozione sufficienti, spesso poi i genitori non
tano dalla scuola, le lacune effettive nelle prestazioni
conoscono neanche il sistema formativo locale e
dei giovani provenienti da famiglie immigrate sono
inoltre, viste le difficoltà linguistiche, a questi giova-
maggiori di quanto non sarebbe prevedibile in base
ni è richiesto uno sforzo particolare per seguire le
alla loro socializzazione plurilingue. Vi è tuttavia
lezioni in tutte le materie.
anche una piccola parte di giovani che dispone di
Questo svantaggio si ripercuote sui risultati sia
buone o addirittura ottime competenze in lettura
nella lettura che in matematica e in scienze naturali.
nella lingua dell’insegnamento ed è in grado di capi-
Circa un quarto dei giovani provenienti da famiglie
re testi estremamente complessi. Il fatto che l’inte-
immigrate non capisce i testi utilizzati in PISA e a
grazione linguistica può avere successo è dimostrato
malapena dispone delle capacità e conoscenze di
da quegli allievi che sono riusciti ad acquisire ottime
base necessarie per leggere testi nella lingua dell’in-
competenze nella comprensione della lingua dell’in-
segnamento. Un altro quarto degli allievi ha serie dif-
segnamento (cfr. illustrazione 4). Man mano che
ficoltà a capire testi semplici nella lingua dell’inse-
aumenta la durata di soggiorno nella regione lingui-
gnamento. Anche in matematica e in scienze natura-
stica diminuiscono le lacune in lettura, matematica e
li, i giovani provenienti da famiglie immigrate pre-
scienze naturali. PISA mostra quindi che il sistema
ILLUSTRAZIONE 4:
Competenza in lettura degli allievi del 9° anno secondo la durata di soggiorno
nella regione linguistica, 2000
Giovani nati nella
regione linguistica
più di 12 anni nella
regione linguistica
9 –12 anni nella
regione linguistica
5– 8 anni nella
regione linguistica
1– 4 anni nella
regione linguistica
0%
Livello < 1
20%
Livello 1
40%
Livello 2
60%
Livello 3
80%
Livello 4
100%
Livello 5
© UST/CDPE
UST/CDPE 2001 PRONTI PER LA VITA?
PAGINA 20
POTENZIALE PER IL FUTURO
formativo è sì sempre più messo alla prova dalla
«interpretazione del testo» e «riflessione sul testo e
diversità culturale, ma ciò non toglie che siano possi-
giudizio sulla forma e sul contenuto».
bili ottime prestazioni in lettura, matematica e scien-
Emergono differenze tra ragazzi e ragazze soprat-
ze naturali da parte di giovani provenienti da famiglie
tutto tra i cattivi e gli ottimi lettori. I ragazzi appar-
immigrate.
tengono molto più spesso al gruppo a rischio, tra il
21 e il 27 per cento a seconda del settore. Tra le
Differenze d’accesso alla formazione tecnica
ragazze è invece nettamente superiore la quota di
per ragazzi e ragazze
ottime lettrici. Le differenze tra ragazzi e ragazze
Malgrado le numerose misure adottate per l’ugua-
sono particolarmente evidenti nelle prestazioni nel-
glianza dei sessi a scuola, oggi si riscontrano ancora
l’ambito «riflessione e giudizio»: le ragazze se la
differenze nelle prestazioni di ragazzi e ragazze, sep-
cavano molto meglio dei ragazzi con testi complessi
pur in misura meno marcata: i ragazzi realizzano pre-
ed esigenze elevate.
stazioni migliori in matematica e scienze naturali, le
ragazze sono in vantaggio in lettura. Anche le differenze tra le condizioni per l’apprendimento di ragazzi e ragazze vanno nella stessa direzione. Le ragazze
leggono volentieri e si giudicano mediamente più
INFO 6
Lingua madre –
lingua dell’insegnamento
competenti in lettura dei ragazzi. Questi ultimi s’interessano invece nettamente di più ai contenuti
Interpretando i risultati dei giovani prove-
matematici e scientifici e valutano le loro competen-
nienti da famiglie immigrate bisogna tener
ze in queste discipline chiaramente al di sopra delle
presente che per questi allievi la lingua del-
ragazze.
l’insegnamento in Svizzera corrisponde alla
Le cause delle differenze nelle condizioni indivi-
prima lingua straniera. Per questo motivo, i
duali per l’apprendimento vanno ricercate essenzial-
risultati di un test nella lingua dell’insegna-
mente negli allievi stessi. È presumibile che siano
mento non valutano la competenza in lettu-
ancora modelli comportamentali e stereotipi specifici
ra, ma mostrano in che misura questi giovani
a seconda del ruolo – ad esempio «per le ragazze la
capiscono dei testi nella loro prima lingua
matematica non è così importante come per i ragaz-
straniera. Lo stesso test nella lingua madre
zi» oppure «i ragazzi non si interessano ai libri duran-
porterebbe probabilmente ad altri risultati.
te il tempo libero» – a determinare in larga misura la
Dal punto di vista degli interessati, il test PISA
scarsa fiducia dei giovani nelle proprie capacità sco-
non misura la stessa cosa per i giovani indi-
lastiche.
geni e per quelli provenienti da famiglie
Le differenze rilevate a livello di prestazioni speci-
immigrate. Dal punto di vista della politica
fiche e condizioni per l’apprendimento sono proble-
dell’istruzione, che mira all’integrazione dei
matiche sia per le ragazze che per i ragazzi. L’orien-
giovani provenienti da famiglie immigrate, il
tamento matematico-scientifico di molti campi pro-
confronto è tuttavia necessario. La conoscen-
fessionali, soprattutto quelli più esigenti, fa sì che le
za della lingua nazionale è infatti una pre-
prospettive professionali delle ragazze siano peggio-
messa indispensabile per l’integrazione scola-
ri di quelle dei ragazzi. Sono problematiche però
stica, la formazione professionale e la forma-
anche le più scarse competenze in lettura dei ragaz-
zione superiore, così come per la partecipa-
zi, dal momento che significano degli svantaggi nel-
zione alla vita sociale e politica.
l’acquisizione di competenze sociali, che sono indispensabili di fronte alla rete sempre più fitta di contatti nella nostra società.
Decisamente più talenti in lettura tra le ragazze
L’illustrazione 5 mostra quanti ragazzi e quante
ragazze rientrano nella categoria dei lettori molto
competenti e nel gruppo a rischio nei tre ambiti della
lettura valutati «ricerca d’informazioni nel testo»,
UST/CDPE 2001 PRONTI PER LA VITA?
PAGINA 21
ilen
ren
hen
POTENZIALE PER IL FUTURO
ILLUSTRAZIONE 5:
Competenza in lettura di ragazzi e ragazze al 9° anno, 2000
Gruppo a rischio
Livelli di competenza 1 e < 1
riflessione sul testo
e giudizio
interpretazione
del testo
ricerca d’informazione nel testo
0%
5%
0
5
10%
ragazze
10
15%
ragazzi
15
20%
25%
20
25
30%
30
© UST/CDPE
Ottimi lettori
Livello di competenza 5
riflessione sul testo
e giudizio
interpretazione
del testo
ricerca d’informazione nel testo
0%
5%
0
5
ragazze
10%
15%
ragazzi
15
10
20%
20
© UST/CDPE
UST/CDPE 2001 PRONTI PER LA VITA?
PAGINA 22
Prospettive
Le differenze a livello di condizioni per l’apprendi-
valli regolari nei prossimi due anni e porranno sotto
mento tra ragazzi e giovani di origine sociale e cultu-
una nuova luce la valutazione della situazione inter-
rale differente nonché tra ragazzi e ragazze sono
nazionale. Fra tre anni saranno già disponibili i risul-
problematiche sia dal punto di vista individuale che
tati del secondo ciclo di PISA. Sarà allora particolar-
da quello sociale e richiedono misure di politica del-
mente interessante il confronto con i risultati odierni,
l’istruzione. L’allievo che è svantaggiato da condizio-
che fornirà informazioni sull’impatto della direzione
ni per l’apprendimento povere ottiene più spesso
imboccata dalla Svizzera nella politica dell’istruzione.
risultati inferiori a quelli di cui sarebbe capace, ciò
La Conferenza svizzera dei direttori cantonali della
significa in altri termini che le sue potenziali compe-
pubblica educazione ha come progetto lo studio
tenze sono insufficientemente sfruttate.
approfondito di temi importanti per la nostra politica
Questa situazione è da un canto un dramma indi-
dell’istruzione per poterne trarre misure applicabili.
viduale dato che le possibilità di lavoro per la manodopera con una formazione scarsa sono in calo.
Competenze sufficienti nelle tecniche culturali, come
la lettura, la scrittura e la matematica, nonché una
formazione scientifica di base minima sono le condizioni per il successo nella carriera professionale, così
come per il perfezionamento professionale e generale, senza il quale non è più possibile tenere il passo
con l’evoluzione sociale ed economica. D’altro canto,
il mancato sfruttamento del potenziale di rendimento ha anche conseguenze sociali, dato che un livello
d’istruzione elevato costituisce la base del successo
economico di un Paese e il superamento della concorrenza sui mercati innovativi. Proprio questo livello
d’istruzione elevato è fortemente minacciato dalla
mancata promozione di ragazzi e giovani con condizioni per l’apprendimento sfavorevoli.
I risultati qui presentati non permettono di dire in
che misura le scarse condizioni per l’apprendimento
di una quota relativamente importante di giovani
abbiano contribuito al risultato della Svizzera. Le
spiegazioni plausibili a prima vista dovrebbero essere
corrobate da confronti internazionali delle relazioni
esistenti tra le condizioni per l’apprendimento e le
prestazioni. PISA punta sulla continuità: in questo
senso, i risultati attuali rappresentano la base per formulare ipotesi e il punto di partenza per ulteriori analisi, che contribuiranno alla spiegazione dei risultati
dei giovani svizzeri. Rapporti frutto di analisi approfondite di questi risultati saranno pubblicati a inter-
UST/CDPE 2001 PRONTI PER LA VITA?
PAGINA 23
Esempi di prova
Esempio di prova 1: compito di lettura
IL LAVORO
Il seguente diagramma ad albero mostra la struttura della forza lavoro di un Paese o della «popolazione attiva». Nel 1995, la popolazione totale del Paese era di circa 3,4 milioni di abitanti.
Struttura della forza lavoro al 31 marzo 1995 (x1000)1
Popolazione attiva2
2656,5
Forza lavoro
1706,5 64,2%
Non forza lavoro3
949,9 35,8%
Occupati
1578,4 92,5%
A tempo pieno
1237,1 78,4%
Disoccupati
128,1 7,5%
A tempo parziale
341,3 21,6%
In cerca di lavoro
a tempo pieno
101,6 79,3%
In cerca di lavoro
a tempo pieno
23,2 6,8%
In cerca di lavoro
a tempo parziale
26,5 20,7%
Non in cerca di lavoro
a tempo pieno
318,1 93,2%
Note
1
Il numero di persone è espresso in migliaia (x1000).
2
La popolazione attiva comprende le persone di età compresa tra i 15 e i 65 anni.
3
La «non forza lavoro» comprende le persone che non cercano un lavoro e/o che non sono in grado
di lavorare.
Fonte: D. Miller, Form 6 Economics, ESA Publications, Box 9453, Newmarket, Auckland NZ, p. 64.
UST/CDPE 2001 PRONTI PER LA VITA?
PAGINA 24
ESEMPI DI PROVA
Usa le informazioni sulla forza lavoro di un Paese, alla pagina precedente, per rispondere alle seguenti
domande.
Domanda 1: IL LAVORO
Quante persone della popolazione attiva non facevano parte della forza lavoro? (Scrivi il numero delle persone, non la percentuale.)
Domanda 2: IL LAVORO
In quale parte del diagramma ad albero potrebbero eventualmente essere inserite le persone elencate nella
tabella seguente?
Indica la tua risposta segnando con una crocetta la casella corretta.
«Nella forza lavoro: occupato»
«Nella forza lavoro: disoccupato»
«Non nella forza lavoro»
«Non compreso in alcuna categoria»
La prima risposta è già fornita come esempio.
Un cameriere di 35 anni a tempo parziale
x
■
■
■
■
Una donna d’affari di 43 anni che lavora
■
■
■
■
Uno studente a tempo pieno di 21 anni
■
■
■
■
Un uomo di 28 anni che ha venduto di
■
■
■
■
■
■
■
■
■
■
■
■
60 ore a settimana
recente il suo negozio e sta cercando lavoro
Una donna di 55 anni che non ha mai
lavorato o voluto lavorare fuori casa
Una nonna di 80 anni che lavora ancora
poche ore al giorno alla bancarella che
la sua famiglia ha al mercato
UST/CDPE 2001 PRONTI PER LA VITA?
PAGINA 25
ESEMPI DI PROVA
Domanda 3: IL LAVORO
Supponi che le informazioni sulla forza lavoro siano presentate ogni anno in un diagramma ad albero come
questo.
Di seguito sono elencati quattro elementi del diagramma ad albero. Indica se ci si può aspettare che questi
elementi cambino da un anno all’altro, tracciando un cerchio intorno a «Cambia» o «Non cambia». La prima
risposta è già fornita come esempio.
Caratteristiche del diagramma ad albero
Risposta
Le etichette in ciascuna casella
Cambia / Non cambia
(es. «Forza lavoro»)
Le percentuali (es. «64,2%»)
Cambia / Non cambia
Le cifre (es. «2'656,5»)
Cambia / Non cambia
Le note in fondo al diagramma ad albero
Cambia / Non cambia
Domanda 4: IL LAVORO
Le informazioni sulla struttura della forza lavoro sono presentate sotto forma di diagramma ad albero, ma
sarebbe stato possibile presentarle in molti altri modi, come una descrizione per iscritto, un diagramma a
torta, un grafico o una tabella.
Probabilmente il diagramma ad albero è stato scelto perché risulta particolarmente utile per mostrare
A i cambiamenti nel corso del tempo.
B la dimensione della popolazione totale del paese.
C le categorie all’interno di ciascun gruppo.
D la dimensione di ciascun gruppo
Esempio di prova 2: compito di matematica
VELOCITÀ DI UN’AUTO DA CORSA
Il grafico mostra come varia la velocità di un’auto da corsa mentre percorre il secondo giro di un circuito pianeggiante lungo 3 chilometri.
Velocità di un’auto da corsa su un circuito di 3 km (durante il 2° giro)
180
160
140
120
100
Velocità (Km/h)
80
60
40
20
0.5
1.5
2.5
0
0
0.2
0.4
0.6
0.8
1
1.2
Linea di partenza
UST/CDPE 2001 PRONTI PER LA VITA?
1.4
1.6
1.8
2
2.2
2.4
2.6
2.8
3
Distanza lungo il circuito (km)
PAGINA 26
ESEMPI DI PROVA
Domanda 1: VELOCITÀ DI UN’AUTO DA CORSA
Qual è la distanza approssimativa tra la linea di partenza e l’inizio del tratto rettilineo più lungo del circuito?
A 0,5 km
B 1,5 km
C 2,3 km
D 2,6 km
Domanda 2: VELOCITÀ DI UN’AUTO DA CORSA
Dove è stata registrata la velocità minima durante il secondo giro?
A Sulla linea di partenza.
B A circa 0,8 km.
C A circa 1,3 km.
D A metà della pista
Domanda 3: VELOCITÀ DI UN’AUTO DA CORSA
Cosa puoi dire della velocità dell’auto tra il chilometro 2,6 e il chilometro 2,8?
A La velocità dell’auto rimane costante.
B La velocità dell’auto sta aumentando.
C La velocità dell’auto sta diminuendo.
D La velocità dell’auto non può essere determinata in base al grafico.
Domanda 3: VELOCITÀ DI UN’AUTO DA CORSA
Nella figura seguente sono illustrati cinque circuiti:
Lungo quale di questi circuiti è stata guidata l’auto per produrre il grafico della velocità illustrato in precedenza?
L
L
B
A
L
C
L
D
L
E
L = Linea di partenza
UST/CDPE 2001 PRONTI PER LA VITA?
PAGINA 27
ESEMPI DI PROVA
Esempio di prova 3: compito di scienze naturali
IL DIARIO DI SEMMELWEIS
Testo 1
«Luglio 1846. La settimana prossima incomincerò a lavorare come ‹Herr Doktor› nel Primo reparto della clinica di maternità dell'Ospedale Generale di Vienna. Sono rimasto agghiacciato dalla percentuale di pazienti
decedute in questa clinica. Nell’ultimo mese sono decedute non meno di 36 delle 208 madri, tutte a causa
della febbre puerperale. Dare alla luce un bambino è pericoloso come una polmonite di primo grado.»
Numero di decessi per febbre
puerperale ogni 100 parti
Queste righe tratte dal diario di Ignaz Semmelweis
15
(1818 – 1865) illustrano gli effetti devastanti della
febbre puerperale, una malattia contagiosa che ucci-
1° reparto
deva molte donne dopo il parto. Semmelweis ha rac-
Numero di decessi
10
colto dati relativi al numero di decessi dovuti alla febbre puerperale nel Primo e nel Secondo reparto (v.
grafico).
5
2° reparto
1841
1842
1843
1844
1845
1846
I medici, tra cui Semmelweis, erano completamente all’oscuro della causa della febbre puerperale. Ecco di
nuovo il diario di Semmelweis:
«Dicembre 1846. Perché così tante donne muoiono a causa di questa febbre dopo aver partorito senza problemi? Da secoli la scienza ci dice che è un’invisibile epidemia ad uccidere le madri. Le cause possono essere mutazioni nell’aria o influssi extraterrestri o un movimento della terra stessa, un terremoto.»
Oggigiorno ben pochi potrebbero considerare gli influssi extraterrestri o un terremoto come possibili cause della
febbre. Oggi sappiamo che è legata alle condizioni igieniche. Ma ai tempi di Semmelweis molti, perfino scienziati, lo pensavano! Semmelweis, tuttavia, sapeva che era improbabile che la febbre potesse essere provocata
da influssi extraterrestri o da un terremoto. Per cercare di convincere i suoi colleghi, mostrò i dati che aveva raccolto (vedi grafico).
Testo 2
Parte delle attività di ricerca condotte nell’ospedale consisteva nella dissezione. Il corpo della persona deceduta veniva sezionato per trovare la causa della morte. Semmelweis riferisce che gli studenti che lavoravano nel
Primo reparto prendevano parte di solito alle dissezioni dei cadaveri delle donne morte il giorno precedente
prima di visitare donne che avevano appena partorito. Non prestavano molta attenzione all'igiene personale
dopo la dissezione. Alcuni erano addirittura orgogliosi del fatto che era possibile intuire che avevano lavorato
nella camera mortuaria a causa dello sgradevole odore che emanavano, e lo consideravano come un indice del
loro zelo!
Uno degli amici di Semmelweis morì dopo essersi ferito durante una dissezione. La dissezione eseguita sul suo
corpo evidenziava gli stessi sintomi delle madri decedute per febbre puerperale. Questo evento fece venire a
Semmelweis una nuova idea.
UST/CDPE 2001 PRONTI PER LA VITA?
PAGINA 28
ESEMPI DI PROVA
Domanda 1: IL DIARIO DI SEMMELWEIS
Supponi di essere Semmelweis. Dà una spiegazione (sulla base dei dati raccolti da Semmelweis) del perché è
inverosimile che la febbre puerperale sia causata dai terremoti.
Domanda 2: IL DIARIO DI SEMMELWEIS
La nuova idea di Semmelweis si riferisce all’elevata percentuale di donne decedute nei reparti maternità e al
comportamento degli studenti.
Qual è questa idea?
A Se gli studenti si lavassero dopo la dissezione, l’incidenza della febbre puerperale diminuirebbe.
B Gli studenti non dovrebbero prendere parte alle dissezioni perché potrebbero ferirsi.
C Gli studenti hanno un cattivo odore poiché non si lavano dopo la dissezione.
D Gli studenti vogliono dimostrare di essere zelanti, il ché li rende poco accurati nel visitare le pazienti.
Domanda 3: IL DIARIO DI SEMMELWEIS
Semmelweis riuscì a ridurre il numero di decessi dovuti alla febbre puerperale. Ancora oggi, tuttavia, questa
febbre rimane una malattia difficile da eliminare.
Le febbri difficili da curare rappresentano ancora ai nostri giorni un problema negli ospedali. Molte misure di
routine servono a tenerlo sotto controllo. Una di queste misure è il lavaggio delle lenzuola a temperature elevate.
Spiega il motivo per cui lavare ad alta temperatura le lenzuola contribuisce a ridurre il rischio per i pazienti
di contrarre una febbre.
Domanda 4: IL DIARIO DI SEMMELWEIS
Molte malattie possono essere curate utilizzando antibiotici. Negli ultimi anni, tuttavia, l’efficacia di alcuni
antibiotici contro la febbre puerperale è diminuita.
Qual è la ragione?
A Una volta prodotti, gli antibiotici perdono gradualmente la loro efficacia.
B I batteri diventano resistenti agli antibiotici.
C Questi antibiotici costituiscono un rimedio solo contro la febbre puerperale ma non contro altre malattie.
D La necessità di questi antibiotici si è ridotta poiché negli ultimi anni le condizioni della salute pubblica
sono considerevolmente migliorate.
UST/CDPE 2001 PRONTI PER LA VITA?
PAGINA 29
Pronti per la vita?
Le competenze di base dei giovani – Sintesi del rapporto nazionale PISA 2000
Impressum
Internet
Editori
Questo fascicolo è disponibile all’indirizzo
Ufficio federale di statistica (UST) e Conferenza
internet www.pisa.admin.ch
svizzera dei direttori cantonali della pubblica
educazione (CDPE)
Altre lingue
Questo fascicolo esiste anche in tedesco
Autore della Sintesi
(473-0000), in francese (474-0000) e in inglese
Urs Moser, Kompetenzzentrum für Bildungs-
(476-0000).
evaluation und Leistungsmessung an der
Universität Zürich
Traduzione
Servizi linguistici dell’UST, Neuchâtel
Informazioni
Andrea Meyer, UST,
Grafica del titolo/Grafica/Layout
Sezione formazione scolastica e professionale,
eigenart, Büro für Layout und Gestaltung,
tel. 032 713 67 35,
Stefan Schaer, Berna
E-Mail: [email protected]
Fotografia
Diffusione
kontrast, Atelier für Fotografie,
Ufficio federale di statistica
Thomas Wiedmer, Schönbühl-Urtenen
CH-2010 Neuchâtel
Tel. 032 713 60 60 / fax 032 713 60 61
Stampa
Druckerei Paul Haupt AG, Berna
Numero di ordinazione
475-0000
Copyright
UST/CDPE, Neuchâtel 2001
Prezzo
La riproduzione è autorizzata, salvo a fini com-
gratuito
merciali, se la fonte è specificata.
Serie
ISBN
Monitoraggio della formazione in Svizzera
3-303-15247-0
UST/CDPE 2001 PRONTI PER LA VITA?
PAGINA 30
Educational Monitoring in Switzerland
Prepared for Life?
Basic Competencies of Young People –
A Synthesis of the National PISA 2000 Report
Urs Moser
OECD – PISA Programme for International Student Assessment
Contents
Foreword
page 4
Preface
page 6
Overview of PISA
page 8
Switzerland in
international comparisons
page 11
Language region characteristics
page 17
Future potential
page 18
Looking ahead
page 23
Sample tests
page 24
Editors
Swiss Federal Statistical Office (SFSO) and
the Swiss Conference of Cantonal Ministers
of Education (EDK-CDIP)
Foreword
Over the past decade, educational policy in Switzerland has focused mainly on
reorganizing the content and structure
of the education system, the aim being
to equip future generations with the
competencies they need to address society's growing demands in an innovative
way. Current policy issues include promoting life-long learning, quality measurement and quality management, the
efficient use of finance and human
resources and a network of relevant
control data.
The results of the education process are
a useful point of departure for quality
assurance in education. In this process,
the academic achievements of students
in the core subjects of reading, mathematics and science on completion of
compulsory education can be interpreted as the cumulative effects of their
school careers. Comparison of their performance with other education systems
provides invaluable information about
the strengths and weaknesses of a country's own education system.
This was the background to Switzerland's decision to participate in the
international PISA (Programme for
International Student Assessment) project, a decision that was facilitated by
SFSO/EDK 2001 PREPARED FOR LIFE ?
PAGE 4
the solid experience base already acquired in similarly designed precursor
projects (eg TIMSS, IALS). Moreover,
the PISA measurements were taken over
a 10-year period, making it possible to
verify the impact of policy measures.
Close cooperation between the Confederation (Swiss Federal Statistical Office,
SFSO) and the Cantons (Swiss Conference of Directors of Education, EDK),
centred around joint financing, is a
noteworthy feature of the Swiss project
structure. And this cooperation is
enhanced by a further dimension. In
future, facts, analyses, concepts and
indicators of crucial importance for
quality assurance in the education system are to be published by the SFSO
and the EDK as part of a special series.
Participation in international achievement measurement surveys such as PISA
requires considerable financial resources
and a high degree of scientific competence. Under these circumstances, it is
particularly gratifying that execution of
the project was successful. However,
the findings about student achievement
which are now available show that further, deepening analyses are required to
gain a better understanding of how our
education system works in order to
FOREWORD
implement practical measures. The
challenge facing education policy is to
provide the resources for the analytical
work and for the necessary further
development of scientific competencies.
We take this opportunity to extend our
warm thanks to all those whose enthusiastic commitment contributed to
PISA's success.
THE STEERING GROUP PISA.ch
Martine Brunschwig Graf
Carlo Malaguerra
Minister of the Geneva State Department
Director, Swiss Federal Statistical Office, Neuchâtel
of Education
Gerhard M. Schuwey
Ernst Buschor
Director, Swiss Federal Office for Education
Minister of the Zurich State Department
and Science, Berne
of Education
Hans Ambühl
Secretary general, Swiss Conference of Cantonal
Ministers of Education, Berne
SFSO/EDK 2001 PREPARED FOR LIFE ?
PAGE 5
Preface
The PISA (Programme for International
Student Assessment) project allows each
participating country to take stock of the
competencies of its young people on
completion of compulsory schooling.
This stock-taking can, and is intended to,
trigger basic social and education policy
questions, such as: what are the relevant
skills our schools should be teaching students to enable them to subsequently
participate successfully in society? What
basic education is required to cope with
the challenges of a globalized world that
is geared to technology? What are the
strengths and weakness of the national
education system compared with the
systems of other countries? Initial results
from the PISA 2000 survey provide
material and starting points for discussion of these issues.
The brief report presented here under
the title «Prepared for Life?» refers to
the national report of the same title
to be published in Spring 2002. The
abridged version now contains the key
findings and takes up vital background
information about the PISA project
and several topical education research
themes. The OECD too is publishing an
initial, comprehensive PISA report entitled «Knowledge and Skills for Life».
These national and international reports
SFSO/EDK 2001 PREPARED FOR LIFE ?
PAGE 6
mark the successful conclusion of the
first phase of the PISA project.
Many people and institutions have
contributed to the study's success. We
take this opportunity to say a word of
special thanks to all the students in
Switzerland who participated in PISA
2000. We would also like to express our
gratitude to the schools for conducting
and organizing the tests, and more particularly to the school coordinators, test
managers and regional coordination
centres which ably carried out the survey in the test regions. National financing and strategic direction are guaranteed by the Confederation and Cantons,
with representatives in the Steering
Group. Furthermore, the national Project Management received active support with the survey concept, content
and methodology from various quarters.
In this connection, our thanks go to the
members of the PISA Network working
in academia and the theory and practice
of education, the education professionals for the active role they played in
developing the international test material, to the «Sampling Group» for the
design of the random sample and the
sampling itself, to the educational
researchers of the Analysis Network for
developing a coherent PISA 2000 evalu-
PREFACE
ation strategy as well as to the authors
of the first national report.
We gratefully acknowledge the work
done by the OECD Secretariat of the
PISA Programme on the international
organization and coordination of the
overall project, by the «Board of Participating Countries» in interdisciplinary
decisions – and hence policy responsibility – and by the International Consortium, with its many years of experience
of designing and implementing national
and international surveys, which took
charge of operational and technical/
practical procedures. Thanks are also
due to the experts from participating
countries who ensure that the PISA
objectives are based on the best scientific and technical competencies available when it comes to international
performance comparisons.
PISA is a multi-year programme. Preparations for the second cycle have begun.
In April and May 2002, another pilot
test will be conducted in a few selected
schools, and Spring 2003 will see the
conduct of the second main test. We are
eagerly looking forward to the findings
of this second cyle because with them,
we can make tentative statements about
trends through comparing the two survey years 2000 and 2003. Again, we are
counting on comprehensive support and
able cooperation – and on just as much
(if not more) interest in the PISA project.
Huguette McCluskey and the team
PROJECT MANAGEMENT PISA.ch
SFSO/EDK 2001 PREPARED FOR LIFE ?
PAGE 7
Overview
of PISA
Continuity in international comparisons
of student performance
PISA heralds a new era in international comparisons
INFO 1
Key PISA data
of student performance: for the first time, the direct
findings of education systems were compared at
Education for the future
international level, at the behest of the Organisation
The «Programme for International Student
for Economic Co-operation and Development
Assessment» (PISA) is part of the Organisa-
(OECD). While the OECD has long been emphasiz-
tion for Economic Co-operation and Devel-
ing the importance of a high standard of education
opment (OECD) programme entitled «Indi-
for national economic prosperity, it had previously
cators of Educational Systems» (INES). PISA
confined itself, in its annual education indicators, to
aims to provide OECD States with indicators
quantifiable parameters such as expenditure on edu-
for the reading, mathematical and scientific
cation or the frequency of qualifications at various
literacy of 15-year-olds. In addition, the pre-
levels of the education system. In contrast, however,
requisites for self-regulated learning, such as
measuring the outcome of the teaching-learning
an interest in learning or support for learning
process was left to other organizations. Moreover,
through the use of strategies, are also cov-
for the first time, the results presented are not just
ered. Furthermore, some of the countries
the outcome of a one-off survey. PISA constitutes a
took part in an international comparison of
programme and builds on measurement on a contin-
familiarity with handling computers.
uum. Every three years, participating countries will
Initially, PISA is to comprise three cycles
be given an opportunity to take stock of where they
with different focal points. The focus of the
stand internationally, in respect of various competen-
first cycle (PISA 2000) is a differentiated
cies. In this way, trends can be followed up and the
description of reading skills, while the find-
impact of any educational policy measures investi-
ings for mathematics and the sciences are
gated.
presented in less detail. PISA 2003 will concentrate on mathematics, and PISA 2006 on
science.
Basic education on completion
of compulsory schooling
A further advantage of PISA lies in the variety and
250 000 students from 32 countries
definition of the accomplishments covered. Tests
In Spring 2000, approximately 250 000 stu-
designed to allow differentiated statements about
dents from 32 countries took a skills test and
the reading, mathematical and scientific competen-
completed a questionnaire. In every country,
cies of 15-year-olds form the core of the survey. In
at least 4500 students from 150 schools par-
this process, PISA does not simply confine itself to
ticipated.
the curricular knowledge of the kind mainly taught
To allow appropriate international com-
in schools but widens its focus to include the fun-
parison, the students had to be in their 15th
damental education which young people should
year at the time of the test. Because students
have under their belt at the end of compulsory
in Switzerland start school later, they had
schooling.
been in education for fewer years than
With a view to further education and entering
the labour market, professional skills alone are not
SFSO/EDK 2001 PREPARED FOR LIFE ?
PAGE 8
young people in other countries. Because the
OVERVIEW OF PISA
the Russian Federation, participated in the interinternational comparison of students of the
national comparison, the findings of which are rep-
same age takes no account of this factor, an
resentative for 15-year-olds in the participating
additional representative random sample of
countries.
students in the 9th grade was selected for
comparisons within Switzerland, which
means that, in all, more than 13 000 young
Switzerland.
INFO 2
Reading, mathematics
and science
Basic education or being prepared for life
Basic reading education
At 15, most young people are at the end of
Basic reading education involves understand-
their compulsory education and should have
ing certain information in a text, identifying
adequate skills in reading, mathematics and
the key statements in a text but also being
the sciences. That is why PISA scrutinizes
able to interpret and give a critical assessment
basic education in these domains or – in other
of its content or form. The young people sur-
words – those competencies in reading,
veyed therefore had to process a series of
mathematics and science which are part of
tasks that made various demands on their
the basic equipment of 15-year-olds. While
ability to comprehend and use a text as well
these skills are taught and learnt in schools,
as to reflect on it. The texts were geared to
they are not tied to a specific curriculum but
everyday situations and their subject matter
can be applied in different contexts. People in
directed at successful participation in society.
people were tested and interviewed in
today's society should have this basic education at their disposal.
In keeping with this comprehension, the
findings about reading could also be presented for the three domains of «retrieving specific information from a text», «interpreting a
enough. Consequently, important prerequisites for
text» and «reflecting on a text's content and
successful learning such as the use of learning
features».
strategies, an interest in learning and self-confidence in one's own abilities were also covered.
Basic mathematical education
Interested, self-assured young people make targe-
Basic mathematical education entails mathe-
ted use of learning strategies, creating extensive
matical knowledge ranging from the ability to
scope for action for themselves in learning situa-
perform standard mathematical operations to
tions. To a large extent, they are capable of regulat-
complex mathematical thinking and insight.
ing their own learning processes. Self-regulated
Primarily, the mathematical tasks took their
learning is a «must» for ensuring students make the
lead from basic mathematical concepts, such
most of their performance potential, and in this
as chance, change and growth, space and
sense, it is a fundamental quality criterion for any
shape. The specific areas of mathematics that
education system.
typically feature on school curriculums –
In today's knowledge society, confident handling
arithmetic, algebra and geometry – were built
of state-of-the-art information and communication
into these tasks. In mathematics too, the
technologies is a necessity for a successful academic
tasks were based on the requirements of
and professional career, and this is why PISA also
present and future life.
covers familiarity with computers.
Basic scientific education
International comparison among 15-year-olds
Basic scientific education involves the use of
The following results derive from some 250 000 15-
scientific concepts to understand the world,
year-olds from 31 countries, including 6100 15-
recognize scientific questions and draw con-
year-olds from Switzerland. Twenty-seven OECD
clusions from them. The scientific concepts
countries, as well as Brazil, Latvia, Liechtenstein and
SFSO/EDK 2001 PREPARED FOR LIFE ?
PAGE 9
OVERVIEW OF PISA
tested concerned topical issues such as life
and health, Planet Earth and the environment
as well as technology. In this sense, they fully
correspond to common concepts derived
from physics, chemistry, biology and earth
sciences. However, the tests did not confine
themselves to investigating knowledge of
these concepts. The concepts had to be
applied to current topics and everyday situations.
SFSO/EDK 2001 PREPARED FOR LIFE ?
PAGE 10
Switzerland in
international comparisons
Good at mathematics,
countries, Japan and South Korea, and also lagged
average in reading and science
behind that of New Zealand, Finland, Australia and
In all three of the domains tested, young people
Canada. In contrast, the results for young Swiss peo-
from Finland, Japan and South Korea come out top,
ple when it came to reading and science were mid-
while students from New Zealand, Canada, Australia
dling, as was expected, going by the results of fairly
and the United Kingdom also achieve excellent
recent international studies such as the Third Inter-
results in reading, mathematics and science (see
national Mathematics and Science Study, TIMSS
Table 1).
(1997), the International Adult Literacy Survey, IALS
Young people in Switzerland did well at mathe-
(1996), or the IEA Reading Literacy Study (1993).
matics – though, as in previous years, their achieve-
Swiss students are among the best in the world in
ments did not match the performance of the leading
mathematics, but are well behind the leading countries in reading and science.
Comparisons with neighbouring countries show
that, on average, young Swiss achieve about the
INFO 3
Statistically significant
differences
same level of reading competence as students in
Austria, France, Italy and Germany, while the findings for mathematics are significantly better for
Because not all 15-year-olds (population) in
young people in Switzerland than for those in Ger-
the participating countries but samples of
many and Italy. As regards science, 15-year-olds in
15-year-olds were investigated, the results
Austria perform significantly better than their Swiss
for a particular country are estimated on the
counterparts.
basis of the findings for those 15-year-olds
Compared with Japan, Sweden and the USA,
that belong to the sample. Thus, the esti-
young Swiss are slightly less good at reading, though
mated results – such as the mean values of
the difference between them and young people from
countries on the reading scale – comprise a
the USA is statistically insignificant. However, in
random sampling error. Depending on the
maths, the findings for Swiss students are signifi-
accuracy of the random sample, the estimat-
cantly better in statistical terms than those for the
ed results for 15-year-olds are scattered over
USA and Sweden. Of all countries, Japanese stu-
a larger or smaller area (confidence interval)
dents chalk up the best results in mathematics. In the
around the actual figure for the 15-year-
sciences, students from Japan and Sweden also per-
olds.
form significantly better than those from Switzer-
Random sampling errors are taken into
land, while the findings for young people in the USA
account when checking the findings for sta-
are fairly similar to those for young people in
tistically differences between countries. A
Switzerland.
difference
between
two
countries
is
described as significant when it has been
Large proportion of poor readers
checked using statistical testing procedures
The striking fact revealed by findings for young peo-
and found to be valid. Differences which
ple in Switzerland is that an above-average number
turned out not to be statistically significant
have only very poor reading competencies (see Info
are not important.
4 and Illus. 1: Level smaller than or equal to 1). As in
Germany, more than 20 percent of students are not
SFSO/EDK 2001 PREPARED FOR LIFE ?
PAGE 11
SWITZERLAND IN INTERNATIONAL COMPARISONS
TABLE 1:
Results for 15-year-olds in Switzerland in international comparison in 2000
Reading
Mathematics
Science
Young people from
Finland
Japan
South Korea
the countries listed
Canada
South Korea
Japan
perform significantly
New Zealand
Finland
better in statistical
Australia
United Kingdom
terms than young
Ireland
Canada
people in Switzerland
South Korea
New Zealand
United Kingdom
Australia
Japan
Austria
Sweden
Ireland
Sweden
Young people from
Austria
New Zealand
Czech Republic
the countries listed
Belgium
Finland
France
do not perform sig-
Iceland
Australia
Norway
nificantly differently
Norway
Canada
USA
in statistical terms
France
(Switzerland)
Hungary
from young people
USA
United Kingdom
Iceland
in Switzerland
Denmark
Belgium
Belgium
(Switzerland)
France
(Switzerland)
Spain
Austria
Spain
Czech Republic
Denmark
Germany
Italy
Iceland
Poland
Germany
Liechtenstein
Denmark
Liechtenstein
Hungary
Poland
Young people from
Greece
Sweden
Italy
the countries listed
Portugal
Ireland
Liechtenstein
perform significantly
Russian Federation
Norway
Greece
less well in statistical
Latvia
Czech Republic
Russian Federation
terms than young
Luxembourg
USA
Latvia
people in Switzerland
Mexico
Germany
Portugal
Brazil
Hungary
Luxembourg
Russian Federation
Mexico
Spain
Brazil
Poland
Latvia
Italy
Portugal
Greece
Luxembourg
Mexico
Brazil
© BFS/EDK
SFSO/EDK 2001 PREPARED FOR LIFE ?
PAGE 12
SWITZERLAND IN INTERNATIONAL COMPARISONS
ILLUSTRATION 1:
Distribution of 15-year-olds in the different levels of reading competence, 2000
Young people
Finland
from the countries
Canada
listed perform
New Zealand
significantly better
in statistical terms
Australia
than young people
Ireland
in Switzerland
South Korea
(see Table 1)
United Kingdom
Japan
Sweden
Young people
Austria
from the countries
Belgium
listed do not
Iceland
perform significantly differently
Norway
in statistical terms
France
from young peo-
USA
ple in Switzerland
Denmark
(see Table 1)
Switzerland
Spain
Czech Republic
Italy
Germany
Liechtenstein
Hungary
Poland
Young people
Greece
from the countries
Portugal
listed perform
Russian Federation
significantly less
Latvia
well in statistical
terms than young
Luxembourg
people in Switzer-
Mexico
land (see Table 1)
Brazil
0%
Level < 1
20%
Level 1
40%
Level 2
60%
Level 3
80%
100%
Level 4
Level 5
© SFSO/EDK
SFSO/EDK 2001 PREPARED FOR LIFE ?
PAGE 13
SWITZERLAND IN INTERNATIONAL COMPARISONS
able to fully comprehend simple texts correctly and
interpret the meaning of the content on completion
INFO 4
Reading literacy
of compulsory education. They have only rudimentary skills in reading and comprehension of the lan-
A differentiated survey of reading competen-
guage in which they are being taught. Moreover,
cies in the first PISA cycle made it possible to
approximately 7 percent of the students are barely
usefully describe the educational status of
able to retrieve even the simplest information from a
young people as regards reading on comple-
written text. In respect of professional and academic
tion of compulsory education. For education-
integration, they fall into a risk group because they
al planning, it is not primarily of interest
will have serious problems satisfying the require-
which countries have the highest mean val-
ments for an apprenticeship or for pursuing further
ues but how these mean values come about.
training (Level smaller than 1). In Japan, for instance
The accomplishments of the participating
this group is only half as big: approximately 10 per-
students were therefore assigned to various
cent have rudimentary reading skills and just under 3
levels.
percent belong to the risk group proper. The percentages for young people in this risk group are 6.4
Level 5: Young people who attain the highest
percent in the USA, 5.4 percent in Italy, 4.4 percent
level of competence are capable of under-
in Austria, 4.2 percent in France and 3.3 percent in
standing every detail of demanding texts
Sweden. In Germany, however, this figure is still
with whose content they are not familiar.
much higher than in Switzerland at 9.9 percent.
They can retrieve the relevant information
and test it critically on the basis of these
Average number of very good readers
hypotheses, even in the case of specialized
The OECD attaches great importance to reading lit-
texts.
eracy for pursuing a successful career. If young peo-
Level 4: Young people who attain compe-
ple are able to comprehend every detail of demand-
tence level 4 can cope with difficult tasks,
ing texts whose content they are not familiar with
such as identifying embedded information,
and to provide a plausible criticism of both features
recognizing nuances of language and making
and content, even if a specialized text is involved,
a critical assessment of texts.
they are ideally placed for going on to higher educa-
Level 3: Young people who attain compe-
tion and making their mark in a profession (see Info
tence level 3 are capable of understanding
4 and Illus. 1: Level 5). In terms of international aver-
texts of medium complexity, combining infor-
ages, 9.4 percent of young people belong to this
mation from various parts of the text and
elite. In Australia, Canada, Finland, New Zealand and
relating them to their existing day-to-day
the United Kingdom, more than 15 percent of young
knowledge of the world.
people have excellent reading skills, while the figure
Level 2: Young people who attain compe-
for Belgium, Ireland and the USA is roughly 12 per-
tence level 2 are capable of using a text for
cent.
basic tasks, such as drawing simple conclu-
Among young Swiss, 9.2 percent achieve the
sions from information contained in the text
highest reading literacy level, and levels of very good
or understanding the importance of limited
readers are fairly similar in Sweden (11.2 percent),
segments of text with the help of their own
Japan (9.9 percent), Germany (8.8 percent), Austria
knowledge.
(8.8 percent) and France (8.5 percent). The propor-
Level 1: At best, young people who attain
tion of very good readers is much lower in Italy (5.3
competence level 1 have rudimentary read-
percent) than in Switzerland, while in the Russian
ing skills. While they can retrieve individual
Federation, Spain and Portugal it even falls below 5
items of information from texts and combine
percent.
them with their existing knowledge, they
cannot use this reading for learning to any
Difficulties with reflecting on and assessing texts
satisfactory extent.
When it came to reading, young people in Switzerland had most problems with tasks that required
SFSO/EDK 2001 PREPARED FOR LIFE ?
PAGE 14
SWITZERLAND IN INTERNATIONAL COMPARISONS
reflection in order to be able to give a critical assess-
information (memory strategies), (b) building new
ment of a text. They had considerably less difficulty
information into existing knowledge structures
with tasks involving the identification of information
(elaboration strategies) and (c) checking their own
in texts or those involving interpretation. Compre-
learning (monitoring strategies).
hension and interpretation are prerequisites for
However, the findings of the international com-
reflection and assessment. Compared with other
parison on self-regulated learning are not all that
countries, language teaching in Switzerland seems to
easy to interpret because they are based on the
pay less attention to the more complex skills.
young people's self-assessment, on the one hand,
and because of the cultural element involved on the
No particular interest in learning
other. For instance, young people in South Korea
An interest in learning is a prerequisite for success-
rate their interest in reading and mathematics as
ful learning. Young people who are also able to regu-
comparatively low, even though their performance in
late their own learning with appropriate strategies
these fields is excellent. But within the individual
not only perform better in school but are generally
countries, the link between the characteristics of self-
better prepared for learning during their lives. Stim-
regulated learning and educational achievement is
ulating an interest in life-long learning is one of the
positive: interested young people who support the
main tasks of schools.
teaching-learning process by using learning strate-
The international comparison of self-regulated
learning conducted within the PISA context for the
gies also perform better, both in South Korea and in
Switzerland.
first time revealed some weaknesses among young
students in Switzerland. Compared with countries
No fear of computers
such as Denmark, Finland and Sweden, 15-year-olds
Sixty-three percent of 15-year-olds in Switzerland
in Switzerland are not particularly interested in read-
use a computer several times a week and 43 percent
ing and mathematics. The position improves some-
go on the Internet several times a week (see Illus. 2).
what when it comes to using learning strategies.
Similar percentages were recorded for 15-year-olds
Swiss students are around the international average
in the USA, Finland, Germany and Denmark. In Swe-
when reading texts involves (a) memorizing new
den, however, more than 80 percent of young peo-
ILLUSTRATION 2:
Use of computers by 15-year-olds in school and at home, 2000
Denmark
Finland
Sweden
USA
Switzerland
Germany
0%
10%
20%
30%
40%
50%
60%
70%
80%
90%
100%
Use several times a week
in school
at home
© SFSO/EDK
SFSO/EDK 2001 PREPARED FOR LIFE ?
PAGE 15
SWITZERLAND IN INTERNATIONAL COMPARISONS
ple use computers several times a week and 77 percent go on the Internet several times a week. Note,
however, that schools play only a secondary role in
the use of computers. In all countries, computers are
used mainly at home. In Switzerland, only 21 percent
of 15-year-olds use computers several times a week
in schools. Germany is the only country where regular use of computers in schools is even lower than in
Switzerland, while in the USA (30 percent), Sweden
(45 percent), Finland (46 percent) and Denmark (57
percent), computers are used more. This comparatively low use of computers in Swiss schools is probably due to a deficit of such equipment. Fortunately, however, there is no lack of interest in computers
among Swiss students, though this interest is much
less pronounced among girls than among boys. Only
in the USA and in Germany do young people claim
to be more interested in computers than in Switzerland. Unfortunately, many of the countries did not
participate in the survey on the familiarity with computers, so international comparisons are necessarily
confined to only a few countries.
SFSO/EDK 2001 PREPARED FOR LIFE ?
PAGE 16
Language region
characteristics
Switzerland, with its cultural and linguistic diversity,
various language regions was compared, although
represents a special case within the international
the points of departure are not identical, given the
comparison of scholastic achievement. The results
different ages at which the children enter education.
for Switzerland are based on young people, some of
The differences in ages among young people in
whom have gone through very different education
the 9th grade do not seem to have a major impact
systems. There are considerable differences on
on reading literacy. At approximately 6 percent, the
many points. For instance, there is almost a year's
percentage of students in German-speaking Switzer-
difference between the age at which children start
land who can barely read, or have poor reading skills,
school in Canton Ticino (Italian-speaking Switzer-
is slightly higher than in Italian- and French-speaking
land) and in German-speaking Switzerland. Students
Switzerland (see Illus. 3: Level < 1 or Level 1). How-
in the 9th grade in German-speaking Switzerland are
ever, at approximately 8 percent, German-speaking
approximately ten months older than their counter-
Switzerland also has the highest proportion of very
parts in Italian-speaking Switzerland and four
competent readers (Level 5).
The competencies in mathematics and sciences of
months older than those in French-speaking Switzer-
students in the 9th grade are different in Italian-
land.
As a result of this variation in education-system
speaking Switzerland than those in German- or
characteristics, it is interesting to compare students'
French-speaking Switzerland. In-depth analysis will
educational status at the end of junior secondary
be required to ascertain to what extent these results
schooling within Switzerland. To this end, the per-
are age-related or whether other education-system
formance of young people in the 9th grade in the
particularities play a part.
ILLUSTRATION 3:
Distribution of 9th grade students over the reading literacy levels in the three
language regions of Switzerland investigated, 2000
German-speaking
Switzerland
French-speaking
Switzerland
Italian-speaking
Switzerland
0%
Level < 1
20%
Level 1
40%
Level 2
60%
Level 3
80%
Level 4
100%
Level 5
© SFSO/EDK
SFSO/EDK 2001 PREPARED FOR LIFE ?
PAGE 17
Future potential
Reasons for the findings
for Switzerland
in other words, for capitalizing on the educa-
«Good at mathematics, average in reading and sci-
tional opportunities available. In addition to
ence» – an assessment that calls for some explana-
economic capital, in the form of financial
tion. Why is the performance of Swiss students not
means, power or prestige, these resources
very good in all three test domains? While this ques-
comprise cultural and social capital too.
tion cannot be exhaustively answered here, certain
Instances of cultural capital include educa-
in-depth analyses of the findings for Switzerland nev-
tional diplomas or articles with cultural sig-
ertheless provide some clear pointers about areas in
nificance such as books and pictures, while
which untapped student potential still exists for the
social capital covers such things as networks
Swiss education system. Before conclusions about the
of social relationships that provide easier
quality of the Swiss education system are drawn from
access to education. Economic, cultural and
the results of international comparisons, the condi-
social capital give people more scope for
tions under which the teaching-learning process takes
action and have a positive impact on their
place should at least be described in greater detail.
socio-economic standing, which in turn
exerts a favourable influence on the use of
educational services. That is why it is also
worth investing in cultural and social capital
INFO 5
Background
and academic success
to boost human capital.
For educational policy, it is particularly
important to ascertain whether the link
The poorer academic performance of young
between social background and achievement
people whose families are not education-
exists in a similar form in all countries or
conscious is frequently discussed under the
whether it is the product of certain educa-
heading of lack of equal opportunity. But it is
tion-system characteristics.
as much the support provided by parents as
the quality of the educational opportunities
on offer, that has a decisive influence on the
Late school entry
development chances of children and young
International comparisons repeatedly underline the
people.
fact that children in Switzerland –particularly in Ger-
The OECD also sees the close connection
man-speaking Switzerland – start school compara-
between social background and reading,
tively late. While young people in OECD countries
mathematical and scientific literacy as a prob-
have been attending school for an average of 9.5
lem of failure to make the most of a society's
years by the time they are 15, students in Switzer-
potential. Along the lines of educational eco-
land have only been in education for barely 9 years
nomics, knowledge and skills are also
(see Table 2). However, this comparatively low
described as human capital from the social
number of years in school by the age of 15 only
perspective.
partly explains their middling performance in read-
Children are differently equipped with the
ing and science. Admittedly, the majority of students
resources which are vital to human capital, or
from countries with better results for reading and
science have been attending school for six months
SFSO/EDK 2001 PREPARED FOR LIFE ?
PAGE 18
FUTURE POTENTIAL
to one year longer than Swiss students (Canada,
clearly influenced by the professional status of par-
New Zealand, Australia, South Korea, the United
ents in Belgium, Germany and Switzerland.
Kingdom, Japan or Austria). But there are also
The findings about links between various charac-
exceptions which go to prove that the age on com-
teristics of young people's social background and
mencement of education does not necessarily
their performance in reading, mathematics and sci-
explain a country's result. For instance, 15-year-olds
ence show that Swiss schools do not succeed in
in Finland achieve top results in all three domains,
counteracting the effects on performance of differ-
although they have been attending school for about
ent conditions for learning.
the same number of years as their counterparts in
Switzerland.
Families lacking
educational awareness
The purpose of our education system is to create the
TABLE 2:
Number of years in education at
the time of the test by the age of 15,
in 2000
prerequisites for enabling all children and young
people – irrespective of their social and economic
Brazil
8.5
backgrounds – to make the most of the educational
Liechtenstein
8.9
opportunities that match their abilities. An educa-
Finland
8.9
tion system is expected to empower students to
Switzerland
8.9
success in reaching this goal largely depends on the
Denmark
9.0
extent to which the school can compensate for ini-
Sweden
9.0
tial learning disadvantages among children and
Poland
9.0
young people.
Luxembourg
9.1
make the most of their performance potential. Its
Unfavourable conditions for learning, as the prod-
Germany
9.1
uct of social background, are particularly obvious in
Hungary
9.2
the qualifications of parents, their profession and
Portugal
9.3
employment status and their educational awareness.
Mexico
9.4
This awareness covers the parents' affinity with
Latvia
9.4
books, the classics and works of art, but also their
Austria
9.4
willingness to discuss social, political or cultural top-
Ireland
9.5
ics with their children. In addition, it includes the pro-
France
9.5
vision of material resources such as access to the
Czech Republic
9.5
Internet or a quiet place to study.
USA
9.5
Belgium
9.6
Young people with good results in the three
domains tested grow up in a home environment
Russian Federation
9.7
characterized by educational awareness. This is an
Spain
9.7
extremely important factor in acquiring specialized
Canada
9.8
skills, and is even more crucial for reading and sci-
Italy
9.9
ence than for good mathematics attainment levels. A
home environment which promotes successful learn-
South Korea
10.0
ing is mainly made possible by well educated par-
Japan
10.0
ents.
Iceland
10.0
Norway
10.0
sional status for a high level of reading literacy
Greece
10.1
should not be underestimated. Mothers and fathers
Australia
10.1
in prestigious professions who earn the correspon-
United Kingdom
10.7
New Zealand
11.0
However, the importance of the parents' profes-
ding salaries provide an education-conscious home
environment, and their children perform better.
Among the OECD countries, reading skills are most
© SFSO/EDK
SFSO/EDK 2001 PREPARED FOR LIFE ?
PAGE 19
FUTURE POTENTIAL
Young people from immigrant families
optimizing the scholastic integration of young peo-
are at a disadvantage
ple from immigrant families who often grow up in a
In recent years, the proportion of young people from
multilingual environment.
immigrant families has been rising steadily in
Because their families are usually economically
Switzerland, reaching approximately 21 percent in
worse off, because their parents often have poorer
2001. Young people from immigrant families are
educational qualifications and because educational
usually disadvantaged in several ways. First, they do
awareness is lacking in the home environment, young
not receive adequate support and encouragement
people from immigrant families are further behind on
from their parents, many of whom know nothing
achievement than could be expected judging from
about the Swiss education system, and these young
their level of multilingual socialization. However,
people also face sizeable linguistic challenges when it
there is also a small percentage of young people who
comes to following lessons in all subjects.
have good – or even excellent – reading skills in the
These disadvantages are reflected in reading,
language in which they are taught and who are able
mathematical and scientific literacy. About a quarter
to comprehend extremely complex tests. Such stu-
of young people from immigrant families do not
dents who achieved maximum competency in under-
understand the texts used for PISA and scarcely have
standing the language used in school show that lin-
basic skills and fluency when it comes to reading
guistic integration is achievable (see Illus. 4). The
texts in the language in which they are taught.
longer these young people spend in the language
Another quarter have serious problems understand-
region, the better they catch up on reading, mathe-
ing simple texts in the language used in school. The
matical and scientific literacy. PISA reveals that, while
performance of these same young people also lags
the education system is increasingly challenged by
clearly behind in mathematics and science – a find-
cultural variety, young people from immigrant fami-
ing that emphasizes the considerable challenges fac-
lies are nevertheless capable of performing very well
ing the Swiss education system in connection with
in reading, mathematics and science.
ILLUSTRATION 4:
Reading literacy in the 9th grade by time spent in language region, 2000
Young people born
in language region
Over twelve years
in language region
9 –12 years
in language region
5 – 8 years
in language region
1– 4 years
in language region
0%
Level < 1
20%
Level 1
40%
Level 2
60%
Level 3
80%
Level 4
100%
Level 5
© SFSO/EDK
SFSO/EDK 2001 PREPARED FOR LIFE ?
PAGE 20
FUTURE POTENTIAL
Differing access to specialized education
pronounced for reading skills involving «reflecting
for boys and girls
and assessing». Girls can cope with complex texts
Despite the numerous measures implemented to
and requirements much better than boys.
put boys and girls on an equal footing in schools,
there are still demonstrable differences in performance between the genders, though to a lesser
degree. Boys perform better in mathematics and science, while girls have an edge when it comes to
INFO 6
Mother tongue –
language used in school
reading. And there is a similar distinction between
boys and girls as regards the prerequisites for learn-
When interpreting the findings for young
ing. Girls take pleasure in reading and on average,
people from immigrant families, account must
judge themselves to be more competent at it than
be taken of the fact that, for these students,
boys. The latter are patently much more interested
the language used in schools is actually their
in mathematics and science subjects and also rate
first foreign language. That is why the find-
their skills in these domains clearly higher than
ings of a test in the language in which they
girls do.
are taught do not provide an assessment of
To a great extent, the reasons for the differences
their reading skills but show how well these
in individual learning prerequisites lie with the stu-
young people understand texts in their first
dents themselves. Presumably, typical role-based
foreign language. The same test in their
behaviour patterns and stereotypes – on the lines of
mother tongue would probably produce dif-
«Maths are less important for girls than for boys» or
ferent results. From the point of view of those
«Boys aren't interested in books in their free time» –
involved, the PISA test does not measure the
are mainly responsible for young people's lack of
same thing for young people born in the lin-
self-confidence in their academic ability.
guistic region and for young people from
The differences in performance ascertained in cer-
immigrant families. However, the test is nec-
tain subjects and learning prerequisites raise prob-
essary from the education policy angle, with a
lems for both girls and boys. Because of the mathe-
view to integrating young people from immi-
matical/scientific slant of many professions, particu-
grant families. After all, a knowledge of the
larly the more demanding ones, career prospects for
appropriate national language is a vital pre-
girls are less bright than for boys. However, the
requisite not only for scholastic integration
poorer reading literacy of boys is also a problem,
and for professional and higher (further) edu-
because it puts them at a disadvantage when it
cation, but also for participation in social and
comes to acquiring the social skills that play a key
political life.
role in our increasingly networked society.
Girls are considerably more talented
when it comes to reading
Illustration 5 shows how many boys and girls are
extremely competent readers and how many belong
to a risk group in connection with the three aspects
tested, namely «retrieving specific information from
a text», «interpreting a text» and «reflecting on and
assessing a text's content and features».
The differences between boys and girls are particularly obvious among the poor and the very good
readers. Boys are found much more frequently in the
risk group, representing 21 to 27 percent, depending
on the aspect tested. In contrast, the percentage of
girls who are excellent readers is much higher. The
differences between boys and girls are particularly
SFSO/EDK 2001 PREPARED FOR LIFE ?
PAGE 21
ilen
eren
hen
FUTURE POTENTIAL
ILLUSTRATION 5:
Reading literacy in the 9th grade of boys and girls, 2000
Risk group
Competence level 1 and < 1
Reflecting
Interpreting
Retrieving
information
0%
5%
0
5
10%
Girls
10
15%
Boys
15
20%
25%
20
25
30%
30
© SFSO/EDK
Excellent readers
Competence level 5
Reflecting
Interpreting
Retrieving
information
0%
5%
0
5
SFSO/EDK 2001 PREPARED FOR LIFE ?
10%
Girls
PAGE 22
Boys
10
15%
15
20%
20
© SFSO/EDK
Looking ahead
Seen from both the individual and social perspec-
of the second PISA cycle will be presented, and it will
tives, the unequal conditions for learning of children
be extremely interesting to measure them against
and young people from different social and cultural
the present results because this comparison will pro-
backgrounds, as well as for boys and girls, constitute
vide information about the effects of the education
a problem and call for education policy measures.
policy approach adopted in Switzerland.
Poor learning prerequisites usually mean a level of
The Swiss Conference of Cantonal Ministers of
achievement that does not match abilities, and
Education plans to study in depth those themes that
hence in failure to make the most of existing
are important for our educational policy in order to
achievement potential.
develop applicable measures.
On the one hand, this is a personal tragedy
because job openings for unskilled labour are on the
decline. Adequate skills in cultural techniques such as
reading, writing and mathematics, as well as a minimum basic education in science, are a «must» for a
successful career but also for the general and vocational further training without which it would be
impossible to keep pace with social and economic
developments. What is more, failure to derive maximum achievement potential can also have social
consequences because a high standard of education
provides a foundation for a successful national economy and for the ability to compete in innovative
markets. And it is precisely this high standard of education which is jeopardized by failure to promote
children and young people with unfavourable conditions for learning.
On the basis of these findings, it cannot be said to
what extent the unfavourable learning prerequisites
of a fairly large percentage of young people influenced the results for Switzerland. What are seemingly plausible explanations at first glance would have
to be confirmed by international comparison of the
link between learning prerequisites and performance. PISA builds on continuity, and in that sense,
the present findings are the basis for hypotheses and
the starting point for further analyses which will contribute to explaining the results for young people in
Switzerland. Regular reports on in-depth study of
these findings, to be published over the next two
years, will throw fresh light on this international
stock-taking exercise. In just three years, the findings
SFSO/EDK 2001 PREPARED FOR LIFE ?
PAGE 23
Sample Tests
Sample Test 1: Reading Task
LABOUR
The tree diagram below shows the structure of a country’s labour force or «working-age population». The total
population of the country in 1995 was about 3.4 million.
The Labour Force Structure year ended 31 March 1995 (000s)1
Working-age
population2
2656,5
In labour
force
1706,5 64,2%
Not in
labour force3
949,9 35,8%
Employed
1578,4 92,5%
Full-time
1237,1 78,4%
Unemployed
128,1 7,5%
Part-time
341,3 21,6%
Seeking
full-time work
101,6 79,3%
Seeking
full-time work
23,2 6,8%
Seeking
part-time work
26,5 20,7%
Not seeking
full-time work
318,1 93,2%
Notes
1
Numbers of people are given in thousands (000s).
2
The working-age population is defined as people between the ages of 15 and 65.
3
People «Not in labour force» are those not actively seeking work and/or not available for work.
Source: D. Miller, Form 6 Economics, ESA Publications, Box 9453, Newmarket, Auckland NZ, p. 64.
SFSO/EDK 2001 PREPARED FOR LIFE ?
PAGE 24
SAMPLE TESTS
Use the information about a country’s labour force on the opposite page to answer the questions below.
Question 1: LABOUR
How many people of working age were not in the labour force?
(Write the number of people, not the percentage.)
Question 2: LABOUR
In which part of the tree diagram, if any, would each of the people listed in the table below be included?
Show your answer by placing a cross in the correct box in the table.
«In labour force: employed»
«In labour force: unem-ployed»
«Not in labour force»
Not included in any category
The first one has been done for you.
A part-time waiter, aged 35
x
■
■
■
■
A business woman, aged 43,
■
■
■
■
A full-time student, aged 21
■
■
■
■
A man, aged 28, who recently sold
■
■
■
■
■
■
■
■
■
■
■
■
who works a sixty-hour week
his shop and is looking for work
A woman, aged 55, who has never worked
or wanted to work outside the home
A grandmother, aged 80, who still
works a few hours a day at the family’s
market stall
SFSO/EDK 2001 PREPARED FOR LIFE ?
PAGE 25
SAMPLE TESTS
Question 3: LABOUR
Suppose that information about the labour force was presented in a tree diagram like this every year.
Listed below are four features of the tree diagram. Show whether or not you would expect these features
to change from year to year, by circling either «Change» or «No change». The first one has been done for
you.
Features of Tree Diagram
Answer
The labels in each box
Change / No change
(e.g. «In labour force»)
The percentages (e.g. «64.2%»)
Change / No change
The numbers (e.g. «2656.5»)
Change / No change
The footnotes under the tree diagram
Change / No change
Question 4: LABOUR
The information about the labour force structure is presented as a tree diagram, but it could have been presented in a number of other ways, such as a written description, a pie chart, a graph or a table.
The tree diagram was probably chosen because it is especially useful for showing
A changes over time.
B the size of the country’s total population.
C categories within each group.
D the size of each group.
Sample Test 2: Mathematical Task
SPEED OF RACING CAR
This graph shows how the speed of a racing car varies along a flat 3 kilometre track during its second lap.
Speed of a racing car along a 3 km track (second lap)
180
160
140
120
100
Speed (km/h)
80
60
40
20
0.5
1.5
2.5
0
0
0.2
0.4
0.6
0.8
1
1.2
Starting line
SFSO/EDK 2001 PREPARED FOR LIFE ?
1.4
1.6
1.8
2
2.2
2.4
2.6
2.8
3
Distance along the track (km)
PAGE 26
SAMPLE TESTS
Question 1: SPEED OF RACING CAR
What is the approximate distance from the starting line to the beginning of the longest straight section of the
track?
A 0,5 km
B 1,5 km
C 2,3 km
D 2,6 km
Question 2: SPEED OF RACING CAR
Where was the lowest speed recorded during the second lap?
A at the starting line.
B at about 0.8 km.
C at about 1.3 km.
D halfway around the track.
Question 3: SPEED OF RACING CAR
What can you say about the speed of the car between the 2.6 km and 2.8 km marks?
A The speed of the car remains constant.
B The speed of the car is increasing.
C The speed of the car is decreasing.
D The speed of the car cannot be determined from the graph.
Question 4: SPEED OF RACING CAR
Here are pictures of five tracks:
Along which one of these tracks was the car driven to produce the speed graph shown earlier?
S
S
B
A
S
C
S
D
S
E
S = Starting point
SFSO/EDK 2001 PREPARED FOR LIFE ?
PAGE 27
SAMPLE TESTS
Sample Test 3: Science Task
SEMMELWEIS’ DIARY
SEMMELWEIS’ DIARY TEXT 1
«July 1846. Next week I will take up a position as ‹Herr Doktor› at the First Ward of the maternity clinic of
the Vienna General Hospital. I was frightened when I heard about the percentage of patients who die in this
clinic. This month not less than 36 of the 208 mothers died there, all from puerperal fever. Giving birth to a
child is as dangerous as first-degree pneumonia.»
Number of Deaths per 100 deliveries
from puerperal fever
These lines from the diary of Ignaz Semmelweis
15
(1818–1865) illustrate the devastating effects of
10
Number of Deaths
puerperal fever, a contagious disease that killed
First
Ward
many women after childbirth. Semmelweis collected
data about the number of deaths from puerperal
fever in both the First and the Second Wards (see
diagram).
5
Second
Ward
1841
1842
1843
1844
1845
1846
Physicians, among them Semmelweis, were completely in the dark about the cause of puerperal fever. Semmelweis’ diary again:
«December 1846. Why do so many women die from this fever after giving birth without any problems? For
centuries science has told us that it is an invisible epidemic that kills mothers. Causes may be changes in the
air or some extraterrestrial influence or a movement of the earth itself, an earthquake.»
Nowadays not many people would consider extraterrestrial influence or an earthquake as possible causes of
fever. But in the time Semmelweis lived, many people, even scientists, did! We now know it has to do with
hygienic conditions. Semmelweis knew that it was unlikely that fever could be caused by extraterrestrial influence or an earthquake. He pointed at the data he collected (see diagram) and used this to try to persuade his
colleagues.
SEMMELWEIS’ DIARY TEXT 2
Part of the research in the hospital was dissection. The body of a deceased person was cut open to find a
cause of death. Semmelweis recorded that the students working on the First ward usually took part in dissections on women who died the previous day, before they examined women who had just given birth. They
did not pay much attention to cleaning themselves after the dissections. Some were even proud of the fact
that you could tell by their smell that they had been working in the mortuary, as this showed how industrious they were!
One of Semmelweis’ friends died after having cut himself during such a dissection. Dissection of his body
showed he had the same symptoms as mothers who died from puerperal fever. This gave Semmelweis a new
idea.
SFSO/EDK 2001 PREPARED FOR LIFE ?
PAGE 28
SAMPLE TESTS
Question 1: SEMMELWEIS’ DIARY
Suppose you were Semmelweis. Give a reason (based on the data Semmelweis collected) why puerperal fever
is unlikely to be caused by earthquakes.
Question 2: SEMMELWEIS’ DIARY
Semmelweis’ new idea had to do with the high percentage of women dying in the maternity wards and the
students’ behaviour.
What was this idea?
A Having students clean themselves after dissections should lead to a decrease of puerperal fever.
B Students should not take part in dissections because they may cut themselves.
C Students smell because they do not clean themselves after a dissection.
D Students want to show that they are industrious, which makes them careless when they examine the
women.
Question 3: SEMMELWEIS’ DIARY
Semmelweis succeeded in his attempts to reduce the number of deaths due to puerperal fever. But puerperal
fever even today remains a disease that is difficult to eliminate.
Fevers that are difficult to cure are still a problem in hospitals. Many routine measures serve to control this
problem. Among those measures are washing sheets at high temperatures.
Explain why high temperature (while washing sheets) helps to reduce the risk that patients will contract a
fever.
Question 4: SEMMELWEIS’ DIARY
Many diseases may be cured by using antibiotics. However, the success of some antibiotics against puerperal
fever has diminished in recent years.
What is the reason for this?
A Once produced, antibiotics gradually lose their activity.
B Bacteria become resistant to antibiotics.
C These antibiotics only help against puerperal fever, but not against other diseases.
D The need for these antibiotics has been reduced because public health conditions have improved considerably in recent year
SFSO/EDK 2001 PREPARED FOR LIFE ?
PAGE 29
Prepared for Life?
Basic Competencies of Young People – A Synthesis of the National PISA 2000 Report
Internet
Impressum
This booklet is available free of charge on
Editors
the Internet at the following address
Swiss Federal Statistical Office (SFSO) and
www.pisa.admin.ch
the Swiss Conference of Cantonal Ministers
of Education (EDK-CDIP)
Other language versions
This booklet is also available in German
Author
(473-0000), Italian (475-0000) and French
Urs Moser, Competence Centre for Educational
(474-0000).
Evaluation and Assessment at the University of
Zurich (CEA)
Translation
SFSO Language Services
Further information
Andrea Meyer, SFSO, section for academic
Title page/Graphic arts/Layout
and professional education
eigenart, Büro für Layout und Gestaltung,
Tel. 032 713 67 35
Stefan Schaer, Berne
E-Mail: [email protected]
Title page photo
Distribution
kontrast, Atelier für Fotografie,
Swiss Federal Statistical Office
Thomas Wiedmer, Schönbühl-Urtenen
CH-2010 Neuchâtel
Tel. 032 713 60 60 / fax 032 713 60 61
Print
Druckerei Paul Haupt AG, Berne
Order number
476-0000
Copyright
SFSO/EDK, Neuchâtel 2001
Price
Reproduction is authorised for non commercial
Free of charge
use providing the source is mentioned.
Series
ISBN
Educational Monitoring in Switzerland
3-303-15248-9
SFSO/EDK 2001 PREPARED FOR LIFE ?
PAGE 30
Scarica