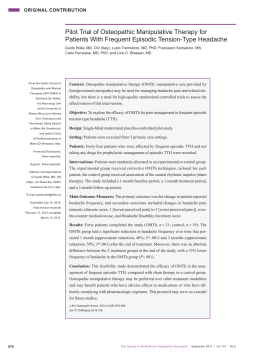
ORIGINAL CONTRIBUTION
Estimating Cost of Care for Patients With Acute Low Back Pain:
A Retrospective Review of Patient Records
William Thomas Crow, DO
David R. Willis, DO, MBA
Context: Low back pain (LBP) has a major economic impact
in the United States, with total costs related to this condition
exceeding $100 billion per year.
Objective: To estimate the cost of standard care compared to
standard care plus osteopathic manipulative treatment (OMT)
for acute LBP of less than 6 months’ duration.
Methods: A retrospective review of electronic medical records
from patients who visited Florida Hospital East Orlando in
Orlando. All patients had LBP of less than 6 months’ duration
and had received care between January 1, 2002, and December
31, 2005. The control group comprised patients who received
standard care; the study group consisted of patients who
received OMT in addition to standard care. Healthcare utilization (eg, radiologic scans, prescriptions) was determined
by “episodes of care,” and costs were averaged per patient.
Results: A total of 1556 patients and 2030 episodes of care
met inclusion criteria. Compared with subjects in the control
group, individuals in the OMT group had an average of 0.5
more office visits per EOC, resulting in 38% more office visits.
However, OMT patients had 18.5% fewer prescriptions
written, 74.2% fewer radiographs, 76.9% fewer referrals, and
90% fewer magnetic resonance imaging scans. In the OMT
group, total average costs were $38.26 lower (P=.02), and
average prescription costs were $19.53 lower (P⬍.001). Patients
in the OMT group also had $63.81 less average radiologic
costs (P⬍.0001).
Conclusion: Osteopathic manipulative treatment may reduce
costs for the management of acute LBP. Further research in a
prospective study is needed.
J Am Osteopath Assoc. 2009:109:229-233
From Florida Hospital East Orlando in Orlando.
Address correspondence to William Thomas Crow, Director, Family Practice and Neuromusculoskeletal Medicine, Florida Hospital East Orlando, 7975
Lake Underhill Rd, Suite 210, Orlando, FL 32822-8204.
E-mail: [email protected]
Submitted August 21, 2007; final revision received January 14, 2009; accepted
January 16, 2009.
Crow and Willis • Original Contribution
T
he cost of treatment for patients with low back pain
(LBP) has a major economic impact worldwide.1-5 In the
United States, patients with musculoskeletal conditions incur
total annual medical care costs of approximately $240 billion, of which $77 billion is related to musculoskeletal conditions.2 According to a 2006 review,6 total costs associated
with LBP in the United States exceed $100 billion per year,
two-thirds of which are a result of lost wages and reduced
productivity.
A brief review of the literature7-9 indicates that patients
with LBP who receive osteopathic manipulative treatment
(OMT) are equally satisfied with outcomes compared with
those who receive standard care. In many cases, patients
who received OMT had shorter hospital stays,7 less physical therapy,8 and a statistically significant lower amount of
pain medication.8
Most reviews and meta-analyses of spinal manipulation for LBP do not specifically address OMT. Instead, they
focus on spinal manipulation as an alternative to conventional treatment. Licciardone et al10 used computerized bibliographic and manual searches of the literature and
concluded that OMT reduced back pain and that this
improvement lasted for at least 3 months.
Cost-effectiveness studies have found encouraging results
for OMT. Gamber et al7 reviewed worker’s compensation
studies for LBP and found that overall costs for osteopathic
physicians (DOs) were less for patients who received OMT.
In 2002, a US Navy study11 evaluated the cost-effectiveness
of using OMT versus standard of care and found that the
latter was up to 20 times more expensive in patients’ lost
work productivity.
However, not all studies conclude that manual medicine
is the most cost-effective treatment option for this population.
One randomized controlled trial12 evaluated outpatient costs
(excluding pharmacologic costs) for four LBP care options.
Average patient costs for the four groups were as follows: $369
for standard medical care only, $560 for chiropractic care
only, $579 for chiropractic care with physical modalities, and
$760 for medical care with physical therapy.
The goal of the current study was to evaluate the cost of
care for acute LBP of less than 6 months’ duration. We hypothesized that patients who received OMT in addition to standard care had a lower cost of care than those who received
standard medical care alone.12
JAOA • Vol 109 • No 4 • April 2009 • 229
ORIGINAL CONTRIBUTION
Materials and Methods
We reviewed electronic medical records (EPIC Systems Corporation, Verona, Wis) of patients who received care for acute
LBP between January 1, 2002, through December 31, 2005, at
the Family Practice Residency Clinic at Florida Hospital East
Orlando in Orlando. The study protocol was approved by the
institutional review board at Florida Hospital System in
Orlando, Fla.
During this time, physicians at the clinic totaled 55 osteopathic residents in family practice and 10 faculty members
(nine DOs and one allopathic physician). No allopathic residents were in the program. In any year, there were an average
of 30 residents and six faculty members.
Patients were required to have LBP of less than 6 months’
duration for inclusion. Inclusion criteria also specified the following ICD-9-CM 2007 codes associated with LBP:
▫ 724.5, Backache unspecified
▫ 724.6, Disorders of sacrum
▫ 742.2, Lumbago
▫ 846.9, Unspecified site of sacroiliac region sprain
▫ 847.2, Lumbar sprain
Patients with diabetic neuropathy, congenital lumbar or
sacral abnormalities, lumbar herniated discs or radiculopathies,
nerve root compression, neurovascular disease, spondlylolysis, spondlylolisthesis, or pain lasting longer than 6 months
were excluded from the present investigation.
All patients received standard medical care, which comprised radiologic studies (ie, magnetic resonance imaging
[MRI] scans and radiographs), prescriptions for narcotic pain
medication and nonsteroidal anti-inflammatory drugs, and
referrals to specialists or physical therapists. In addition to
standard care, some patients received OMT for LBP. No specific OMT techniques were required to have been used for
inclusion in the present study.
Patients were assigned to groups according to whether or
not they received OMT. In other words, patients who did not
receive OMT comprised the control group, and those who
did receive OMT consisted of the OMT group.
Some patients had more than one occurrence of LBP
between January 1, 2002, and December 31, 2005. During their
first episode of LBP (eg, in 2002), these patients may have
received standard medical care without OMT, but during a
second episode of LBP (eg, in 2004), they may have received
OMT in addition to standard medical care. Therefore, when we
analyze our findings, these patients were included in both
groups.
The Current Procedural Terminology (CPT) codes for
visits, prescriptions written, and number of pills prescribed
were collected. Osteopathic manipulative treatment costs were
also based on CPT criteria. All nonrelated charges, such as
medications for unrelated conditions (eg, diabetes, hypertension) were excluded. Magnetic resonance imaging (MRI) scans
230 • JAOA • Vol 109 • No 4 • April 2009
were checked for body region and results. If the results revealed
a diagnosis that met exclusion criteria, then the patient and his
or her record were excluded.
Average healthcare utilization rates (ie, office visits, prescriptions, referrals, MRIs, and radiographs) were calculated
by 90-day episodes of care (EOCs) because patients who have
back pain may require more than one office visit and because
treatment length varies for patients. One EOC was defined
as all office visits within 3 months of the last office visit. For the
same patient to have a second EOC for the same occurence of
LBP, at least 91 days had to pass since the last office visit. This
defined time between EOCs was used because the normal
healing process for a soft tissue injury usually takes 90 days.
Because patients could have visited the clinic for LBP
twice more than 6 months apart, they could have had 2 EOCs.
However, in this scenario, each office visit was considered a
single EOC for each occurrence of LBP.
Average costs were calculated per patient. The CPT codes
were matched to the 2006 Medicare fee schedule for the
Orlando, Fla, region. Medication costs were based on December
2006 prices provided to us by a national drugstore—Walgreen
Co—at the average wholesale cost. Medications that could
have been filled as generic brands were calculated at that
lower cost. Physical therapy costs were based on 4 weeks of
therapy (12 visits in the Florida Hospital Physical Therapy
Clinic) using the CPTs for their LBP protocol.
A sample of the consultations patients received for orthopedics, neurosurgery, physical medicine, and neurology were
reviewed and determined to have been coded as level IV consultations. Therefore, all consultation charges were initially
determined for level IV visits. However, we recalculated the
data using level III consultation to ensure that our findings were
not overstated. The data remained statistically significant
(P=.02 vs P=.03) after this conversion.
Statistical analysis was done using factoral analysis and
one-way analysis of variance (ANOVA) on dependent variables using SPSS statistical software (version 14.0 for Windows; SPSS Inc, Chicago, Ill).
Results
A total of 1810 patient records were reviewed and were found
to comprise 4099 office visits and 2415 episodes of care. After
examining reports, 254 patient records, which included
612 office visits and 385 EOCs, were excluded from the study
because they met exclusion criteria—specifically, LBP lasted
longer than 6 months or the patient had an exclusionary diagnosis. Therefore, the total number of patients analyzed for the
present study was 1556; office visits, 3487; and EOCs, 2030. A
total of 145 patients met inclusion criteria for both groups,
contributing 154 EOCs to the control group and 145 EOCs to
the OMT group.
The control group (n=1120) comprised 714 female patients
(63.75%) and 406 male patients (36.25%). The average age
(range) was 44.8 years (10-89 y). Subjects in the control group
Crow and Willis • Original Contribution
ORIGINAL CONTRIBUTION
had 1776 office visits resulting in 1327 EOCs. The OMT group
(n=581) was smaller, consisting of 384 female patients (66.09%)
and 197 male patients (33.91%). The average age (range) for the
OMT group was 42.97 years (11-90 y). In the OMT group,
there were 1711 office visits, which resulted in 703 EOCs.
The majority of EOCs (1469 [72.36%]) consisted of one
office visit. Another 286 EOCs (14.09%) comprised two or
more office visits within 30 days; 113 (5.57%) had two or more
office visits within 60 days; 87 (4.29%), 90 days; 42 (2.07%),
120 days; and 33 (1.62%), 180 days.
The control group had an average of 1.3 office visits per
EOC while the OMT group had 1.8 office visits per EOC—38%
more office visits than the control group (Table 1). However, the
OMT group had 76.9% fewer referrals for specialty care (eg,
neurology, neurosurgery, orthopedics, pain management,
physical medicine, physical therapy). For example, there were
146 referrals related to LBP for the control group vs 18 for the
OMT group (Table 2). In addition, the OMT group had 90%
fewer MRI scans, 74.2% fewer radiographs of the lumbar
spine, and 18.5% fewer prescriptions written.
These differences resulted in an overall lower cost per
patient for those in the OMT group (Table 3). Patients in the
OMT group had $38.26 less average total costs than the control group, which is 14.4% less costly (P=.02). This lower total
cost was a result of $63.81 (85.7%) less average radiology costs
(P⬍.0001) and $19.53 (26.6%) less average prescription costs
(P⬍.001).
When comparing data by 30-day intervals, average total
costs and prescription costs per patient were closest for the
OMT and control groups at 60 days (Figure).
Comment
The present study suggests that the use of OMT in combination
with standard medical treatment lowers healthcare costs for
patients with LBP. As shown in the Figure, total costs and prescription costs are similar at 60 days but are very different at 90
days. At 120 days, the costs begin to approximate each other
again. This trend likely occurred because DOs using OMT
became more aggressive in their management of LBP. In talking
with residents, DOs who used OMT to treat patients felt more
confident in their physical diagnosis skills. Therefore, they prescribed fewer medications and ordered fewer radiographs.
These residents also stated that the patients often felt better
posttreatment and did not require a prescription for their pain.
However, the longer the patient had LBP, the physicians using
OMT felt the need to add medications for pain control.
To verify that the discrepancy in prescribing practices
was not a result of some physicians using more expensive
medications or technologies, we reviewed patient records
accordingly. The medications used in both groups were
approximately the same costs and type. There was no outlier
of one physician prescribing more costly drugs or ordering
more imaging in the non-OMT group. Therefore, the medication cost difference comes from the fewer number of preCrow and Willis • Original Contribution
Table 1
Estimating Cost of Care for Patients With Low Back Pain:
Healthcare Utilization Rate per Episodes of Care, No.*
Healthcare
Utilization
Office visits
Prescriptions
Referrals
MRI scans
Radiographs
Episodes of Care
Control Group
OMT Group
(n=1327)
(n=703)
1.3
1.24
0.13
0.026
0.62
1.81
1.01
0.03
0.0028
0.16
* One episode of care (EOC) was defined as all office visits within 3 months
of the last office visit. For the same patient to have a second EOC, at least
91 days had to pass since the last office visit. The control group had 1120
patients, while the osteopathic manipulative treatment (OMT) group had
581 patients. A total of 299 EOCs were from the 145 patients who were in
both groups, contributing 154 EOCs to the control group and 145 EOCs to
the OMT group. All comparisons between the control group and the OMT
group were statistically significant (P⬍.0001).
Abbreviation: MRI, magnetic resonance imaging.
Table 2
Estimating Cost of Care for Patients With Low Back Pain:
Total Healthcare Utilization per Episodes of Care, No.*
Healthcare
Utilization
Office visits
Prescriptions
Referrals
MRI scans
Radiographs
Episodes of Care
Control Group
OMT Group
(n=1327)
(n=703)
1776
1646
146
35
882
1711
710
18
2
113
* One episode of care (EOC) was defined as all office visits within 3 months
of the last office visit. For the same patient to have a second EOC, at least
91 days had to pass since the last office visit. The control group had 1120
patients, while the osteopathic manipulative treatment (OMT) group had
581 patients. A total of 299 EOCs were from the 145 patients who were in
both groups, contributing 154 EOCs to the control group and 145 EOCs to
the OMT group. All comparisons between the control group and the OMT
group were statistically significant (P⬍.0001).
Abbreviation: MRI, magnetic resonance imaging.
scriptions written. Likewise, the radiology costs result from
fewer MRIs ordered.
However, when interpreting the data, certain limitations
must be considered. For example, the current utilization study
did not look at outcomes. Therefore, it is possible that patients’
conditions worsened and they sought care elsewhere. However, as discussed earlier, Andersson et al8 showed that OMT
and conventional medical care outcomes were equivalent
based on patient evaluation of pain (eg, visual analog scales,
Roland-Morris questionnaire) and function (eg, range-ofmotion measurements). Likewise, the authors8 suggested that
JAOA • Vol 109 • No 4 • April 2009 • 231
ORIGINAL CONTRIBUTION
Table 3
Estimating Cost of Care for Patients With Low Back Pain:
Cost Analysis per Episode of Care*
Cost Measure
Total
Radiology
Prescription
Control Group
(n=1327)
US $ per Episodes of Care (95% CI)
OMT Group
(n=703)
265.19 (245.91-285.48)
74.44 (65.95-80.94)
73.44 (65.95-80.94)
226.96 (202.01-251.90)
10.63 (6.26-15.00)
53.91 (45.78-62.94)
Total
(N=2030)
251.95 (236.66-267.34)
51.69 (46.40-65.98)
66.68 (66.68-72.34)
F Score†
5.458
130.63
10.41
P Value
Adjusted R2
.02
⬍.0001
⬍.001
0.16
0.129
0.077
* One episode of care (EOC) was defined as all office visits within 3 months of the last office visit. For the same patient to have a second EOC, at least 91 days had to
pass since the last office visit. The control group had 1120 patients, while the osteopathic manipulative treatment (OMT) group had 581 patients. A total of 299
EOCs were from the 145 patients who were in both groups, contributing 154 EOCs to the control group and 145 EOCs to the OMT group.
† For each of the comparisons made, the df was 1.
OMT with standard medical care is less costly in the treatment of LBP of less than 6 months’ duration.
Other limitations to the present study are related to several “unknowns,” which could affect total costs. For example,
we do not know if patients were seen by other practitioners
before or after the office visits that we have recorded, so the
overall total costs may not be precise. Also, we calculated
costs on the basis that all patients were seen by a neurologist,
progressive muscle relaxation practitioner, or pain management
consultant. However, not all consultants returned reports, and
therefore, we do not know if some patients were seen or not.
Additional unknowns include whether any other interventions were used that would increase costs, how many prescriptions were actually filled, or whether patients were taking
medications for pain from other prescribers. Likewise, we had
no record of over-the-counter medications taken, and the institutional review board would not allow us to contact insurance companies to obtain CPT codes charged for patients’
EOCs. Also, many of the patients had other complaints (eg, diabetes, hypertension) that could affect level-of-service billing.
Another limitation is that LBP often resolves without intervention, but this possibility was not taken into account in the
present study.
Data reported in the current investigation are different
from those reported in other studies. For example, Monajati,
et al13 reported an average of 2.5 office visits per EOC for primary care physicians and 3.5 for orthopedic office visits. By
comparison, we found an average of 1.8 offices visits for the
OMT group and 1.1 office visits for the standard care group.
The average number of prescriptions in the present study
were also lower. Monajati et al13 had an average of 4.6 prescriptions, while Feuerstein et al14 investigated general trends
and found an average of 2.0 prescriptions in 1987 and 3.9 prescriptions in 1997. By comparison, in the present study, we
found 1.01 prescriptions for the OMT group and 1.24 for the
control group.
Ritzwoller et al15 showed that 67% of patients had one LBP
episode of care of 30 days or less as compared with more than
232 • JAOA • Vol 109 • No 4 • April 2009
85% in the present study. Coste et al16 showed that 90% of
patients’ LBP resolved within 2 weeks without medical intervention. However, Croft et al17 showed 90% of patients stopped
consulting their physician after 3 months even though they still
had pain. Because the present study was retrospective in
design, we do not know if any patients were still in pain but
stopped coming to the office because they were dissatistied
with their care.
In Ritzwoller et al,15 10.9% of patients had radiographs or
MRIs within the first 30 days of treatment, compared to 7% in
the OMT group and 26% in the control group in the present
study. Total costs in the present study were considerably lower
per EOC than reported by Kominski et al,12 which is likely a
result of differences in methodology. Kominski and colleagues12
calculated costs using charges, not Medicare costs. If we had
used Florida Hospital East Orlando charges, then the total
costs would have been about 40% higher in both groups.
In 1995, Hart et al18 used the National Ambulatory Medical Care Survey to look at office visits for LBP and separated
results for osteopathic family physicians. In that study,18 osteopathic family physicians ordered radiographs at the lowest
rate (6%) and prescribed a lower percentage of medications
(45.2%) compared with general internists (56.2%) and allopathic family physicians (60.2%).
Although certain findings of the present study differ in
comparison to previous reports,13-18 the general trends are
consistent in that OMT was found to minimize cost of care for
LBP and reduce healthcare utilization rates (eg, medication,
radiologic studies).
Conclusion
While further investigation is needed in the form of a prospective study, it appears that the use of OMT may be cost effective for the treatment of mechanical LBP with less medication and fewer radiology procedures, which is consistent with
previously published studies.
Crow and Willis • Original Contribution
ORIGINAL CONTRIBUTION
References
Mean Estimated Costs, US $
800
A
1. Maniadakis N, Gray A. The economic burden of back pain in the UK. Pain.
2000;84:95-103.
Total Costs
Control Group
2. Yelin E. Cost of musculoskeletal diseases: impact of work disability and
functional decline [review]. J Rheumatol Suppl. 2003;68:8-11.
OMT Group
600
3. Schmidt CO, Schweikert B, Wenig CM, Schmidt U, Gockel U, Freynhagen R,
et al. Modelling the prevalence and cost of back pain with neuropathic components in the general population [published online ahead of print February
5, 2009]. Eur J Pain.
400
4. Mattias E, Olof J, Lars L. The economic cost of low back pain in Sweden in
2001. Acta orthopaedica. 2005;76:275-284.
200
5. Dagenais S, Caro J, Haldeman S. A systematic review of low back pain cost
of illness studies in the United States and internationally. Spine J. 2008;8:8-20.
6. Katz JN. Lumbar disc disorders and low-back pain: socioeconomic factors
and consequences [review]. J Bone Joint Surg Am. 2006;88(suppl 2):21-24.
0
Mean Estimated Costs, US $
200
B
7. Gamber R, Holland S, Russo DP, Cruser A, Hilsenrath PE. Cost-effective
osteopathic manipulative medicine: a literature review of cost-effectiveness
analyses for osteopathic manipulative treatment. J Am Osteopath Assoc.
2005;105:357-367. Available at: http://www.jaoa.org/cgi/content/full/105/8/357.
Accessed February 17, 2009.
Radiology Costs
160
8. Andersson GB, Lucente T, Davis AM, Kappler RE, Lipton JA, Leurgans S. A
comparison of osteopathic spinal manipulation with standard care for patients
with low back pain [published correction appears in N Engl J Med. 2000;342:
817]. N Engl J Med. 1999;341:1426-1431.
120
9. Licciardone J, Gamber R, Cardarelli K. Patient satisfaction and clinical outcomes associated with osteopathic manipulative treatment. J Am Osteopath
Assoc. 2002;102:13-20. Available at: http://www.jaoa.org/cgi/reprint/102/1/13.
Accessed March 30, 2009.
80
40
10. Licciardone JC, Brimhall AK, King LN. Osteopathic manipulative treatment for low back pain: a systematic review and meta-analysis of randomized
controlled trials. BMC Musculoskelet Disord. 2005;6:43. Available at:
http://www.pubmedcentral.nih.gov/articlerender.fcgi?tool=pubmed&pubmedi
d=16080794. Accessed February 17, 2009.
0
Mean Estimated Costs, US $
200
C
Prescription Costs
11. Lipton JA, Meneses P, Martin JB, Mizera AC, Kappler R, Brooks JS, et al.
Improved pain score outcomes achieved through the cooperative and costeffective use of physical (osteopathic manipulative) medicine in the treatment
of outpatient musculoskeletal complaints. Am Acad Osteopath J. Spring
2002;12(1):26-32.
160
120
80
12. Kominski GF, Heslin KC, Morgenstern H, Hurwitz EL, Harber PI. Economic
evaluation of four treatments for low-back pain: results from a randomized
controlled trial. Med Care. 2005;43:428-435.
40
13. Monajati SD, Clement J, Cave DG. Low back pain. Manag Care Interface.
1999;12:52-54.
0
14. Feuerstein M, Marcus SC, Huang GD. National trends in nonoperative
care for nonspecific back pain. Spine J. 2004;4:56-63.
1
30
60
90
120
Treament Duration, d
15. Ritzwoller DP, Crounse L, Shetterly S, Rublee D. The association of comorbidities, utilization and costs for patients identified with low back pain. BMC
Musculoskelet Disord. 2006;7:72. Available at: http://www.biomedcentral.com
/1471-2474/7/72. Accessed February 17, 2009.
Figure. Estimated average total costs (A), radiology costs (B), and
prescription costs (C) by duration of treatment per patient. Abbreviation: OMT, osteopathic manipulative treatment.
16. Coste J, Delecoeuillerie G, Cohen de Lara A, Le Parc JM, Paolaggi JB. Clinical course and prognostic factors in acute low back pain: an inception cohort
study in primary care practice. BMJ. 1994;308:577-580. http://www.pubmed
central.nih.gov/articlerender.fcgi?tool=pubmed&pubmedid=8148683. Accessed
February 17, 2009.
Acknowledgments
17. Croft PR, Macfarlane GJ, Papageorgiou AC, Thomas E, Silman AJ. Outcome
of low back pain in general practice: a prospective study. BMJ. 1998;316:13561359. Available at: http://www.pubmedcentral.nih.gov/articlerender
.fcgi?tool=pubmed&pubmedid=9563990. Accessed February 17, 2009.
We thank Danny Diosomito, BSHA; Drew Miller, BS; and Alberto J.
Cabán-Martinez, MPH, for their help with data management. We also
thank the Osteopathic Research Center, which resides at University
of North Texas Health Science Center—Texas College of Osteopathic Medicine in Fort Worth, for their support in providing biostatistical analysis.
Crow and Willis • Original Contribution
18. Hart LG, Deyo RA, Cherkin DC. Physician office visits for low back pain. Frequency, clinical evaluation, and treatment patterns from a US national survey.
Spine. 2005;20:11-19.
JAOA • Vol 109 • No 4 • April 2009 • 233
Scaricare