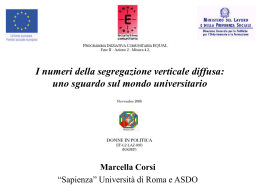
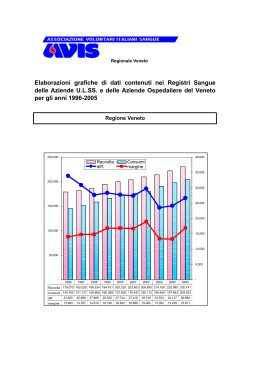
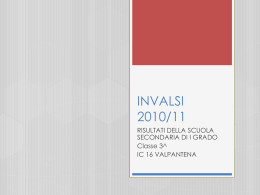
THEMATIC STUDIES ON GENDER EQUALITY
Study 02: Gender Pay Gap: a regional
perspective.
STUDI TEMATICI SULLA PARITÀ DI GENERE
Studio 02: Differenziale retributivo di genere:
una prospettiva regionale.
2
This is the collection of the thematic studies on gender equality in Veneto Region an
outcome of Component 3 of the project “Gender for Growth” (G4G) and has been
realized by the Veneto Region, with the scientific coordination of Veneto Lavoro .
The report is available at the project’s website: www.gender4growth.eu
G4G is part-financed by the European Union (ERDF) through the Interreg IV C
Programme.
Its content is the sole responsibility of the authors and can in no way be taken to reflect
the views of the European Union.
Edited by
Patrizia Loiola
Alberto Ferri
Lorenzo Liguoro
Sandra Rainero
Romilda Patella
October 2011
3
TABLE OF CONTENTS
Thematic Studies on Gender Equality ..................................................................... 5
Study 02: Gender Pay Gap: a regional perspective................................................. 5
Study 02: Differenziale retributivo di genere: una prospettiva regionale ............ 11
4
Thematic Studies on Gender Equality
Equality
Study 02: Gender Pay Gap: a regional perspective
The average difference between men’s and women’s hourly
earnings is known as the gender pay gap. The gender pay
gap reflects ongoing discrimination and inequalities in the
labour market which, in practice, mainly affect women. Its
causes are complex and interrelated1.
Starting from this definition of “gender pay gap” (GPG), the G4G Thematic Study carried
out by Veneto Region (Veneto Lavoro staff) aims at drawing an updated picture of the
current situation, by collecting and analyzing the most recent data and the most
significant research focusing on National and Regional level. These data will be compared
to the EU – level statistics, in order to measure the differences and to identify the steps
to be taken to reduce the gap between the existing situation and the objectives of the
Europe 2020 strategy.
Italy and Gender Pay Gap: difficult situation hidden behind good results
The European data are confirmed also by a recent survey of ISTAT (May 2011) at national
level, where it is stated that women’s incomes are 20% lower than men’s: if the average
male retribution is around 1,400 euros, the female one stops at 1,131 euros.
Even if 20% of gender pay gap may not seem high if compared to other EU countries’
performance, as EU research confirms “In most of the countries in which the female
employment rate is low (e.g. Malta, Italy, Greece, Poland), the pay gap is lower than the
EU average, which may reflect the small proportion of low-skilled or unskilled women in
the workforce”. In order to verify this assumption, the analysis of the most significant
documents and researches in the field of gender pay gap and in particular the research
carried on it by ISFOL “Esiste un differenziale retributivo di genere in Italia? Il lavoro
femminile tra discriminazioni e diritto alla parità di trattamento”2, edited by the Ministry
of Health and Social Policies in 2010, will help to shed light on this controversial issue.
North
Employed
Single
Daughters
Couple
with
Children
Couple
with no
Children
Single
Parent
87.4
81.4
67.3
79.3
85.9
Total
Table 1
Women 3545 years old,
working
72.3 condition,
1
http://ec.europa.eu/social/main.jsp?catId=681&langId=en
http://www.lavoro.gov.it/Lavoro/Europalavoro/SezioneEuropaLavoro/DGPOF/ProdottiEditoriali/CollaneE
ditoriali/LibriFSE/differenzialeretributivo.htm
2
5
Searching
for E.
Housewife
Other
Va 000
Centre
Employed
Searching
for E.
Housewife
Other
Va 000
South
Employed
Searching
for E.
Housewife
Other
Va 000
Italy
Employed
Searching
for E.
Housewife
Other
Va 000
7.4
4.2
2.5
4.1
2.6
1.0
4.2
184
6.4
8.0
147
29.5
0.8
1,587
14.9
1.8
242
11.1
0.5
165
3.1 family
framework
22.9 and
1.6 territorial
2,325 distribution
94.2
1.9
84.0
10.0
63.3
2.4
77.0
6.0
70.3
9.6
69.1 ISFOL, Esiste
3.9 un
2.9
0.9
81
1.8
4.2
70
33.5
0.8
684
15.4
1.5
101
20.1
0.0
94
25.9
1.0
1,030
67.6
13.0
47.5
19.0
36.0
5.2
53.5
3.9
57.8
12.9
40.6
7.1
15.7
3.8
81
20.9
12.7
157
75.4
1.4
1,377
39.4
3.3
98
25.4
3.8
98
49.6
2.7
1,811
84.4
7.4
67.6
11.5
54.7
3.5
73.0
4.5
74.1
7.3
60.6
4.7
4.9
3.3
346
11.6
9.3
374
40.8
1.0
3,648
20.4
2.0
441
17.4
1.3
357
32.9
1.9
5,166
differenziale
retributivo di
genere in
Italia? Il
lavoro
femminile tra
discriminazioni
e diritto alla
parità di
trattamento ,
edited by the
Ministry of
Health and
Social Policies
in 2010
Table 1 reveals how the Italian low gender pay gap could be effectively linked to the low
employment rate of female workforce, as suggested by EU experts. The survey has been
carried out in 2008 through questionnaires and reached more than 5,000 women in all
the three areas of the Italian peninsula. In particular, it is interesting to notice how in
South Italy the percentage of employed women is only 40.6% (against the 60.6% at
national level) and how the 49.6% (against the 32.9%) of women is housewife. With such
an high number of women “out of labour market”, it is quite normal to find low gender
pay gap level in Italy, but we need to underline how this datum is not significant to
describe the real situation.
In order to better explain how much the “employment level” (and “age”, as another
important criterion) can influence gender pay gap indicators in Italy, we refer to a
research of ISTAT titled “La situazione del Paese nel 2004” (Annual Report), carried out
among enterprises with at least 10 workers and belonging to the private non-agricultural
sector. The survey methodology distinguished between the “equipment effect” (how
much a single aspect, as human capital / contractual situation / enterprise dimension
affects salary) and the “retribution effect” (how much a single aspect is differently paid
to women with respect to men). The survey revealed how gender pay gap globally
considered was about 16%, with the “equipment” component scoring 4.9% and the
6
“retribution component” scoring 11.1%. The “retribution” effect is due to several causes,
but the main reason is surely the “different remuneration of age”. If for men (excluding
every other detected effect) the retribution raises with the age of 0,8%, for women it
raises only of 0.5%. Moreover, the age-factor influences the retribution also from the
“equipment” point of view, due to the fact that male workers are older than female’s
colleagues: on one side, female employment great increase is a recent phenomenon and
on the other side women were (and are) traditionally characterized by an “anticipated
working life” with respect to men (they usually enter and leave first!). Women have
usually less “working years on their shoulders in a firm”, but in general, ageing in a firm
for a woman does not mean lower retribution than men’s. So, the differences in
retribution are more affected by age than by discrimination. It is worth to say that, in this
case, the maternity for women represents a strong obstacle for equal retribution!
Gender pay gap in Italy is evident since the beginning of working life and remains (in
some cases increases) during the middle part of the professional career, when it is more
difficult for women to balance professional and personal life (children, family, etc…).
Following an historical trend, the GPG in Italy has been on the decrease in more recent
years. The last column of Table 2 (Average Retribution for typology of Job and Gender,
2002) shows how the Gender Pay Gap in 2002 was 23.3%, while the most recent survey
revealed a 16% rate in 2004 and little over 10% in 2008. But, as underlined above, these
results have to be read through the lens of the high female unemployment level
registered in Italy.
Table 2
Average
Retribution
for typology
of Job and
Gender,
2002
Gender Pay Gap in Veneto Region: a difficult situation hidden behind good results
The most recent data concerning the gender pay gap in Veneto Region refer to 20002004 and had been collected in “I redditi delle donne e degli uomini in Veneto – Quali
prospettive per una fiscalità di genere?” by the Regional Councillor for budget issues of
Veneto Region. Differently from the previous mentioned surveys, the Veneto Region
analysis considered the “amount of earnings declared by women and men” in the
7
different Provinces of the Veneto, indirectly including also the “unemployed” in the
data3.
The researchers discovered that the “real” gender pay gap in Veneto Region is about 40%
(and not only the 19% indicated by the EU statistics). Table 3 shows the distribution of
the GPG among the 7 provinces.
Table 3 - Gender Pay Gap distribution among the Veneto Region Provinces (2000-2004)
The Province of residence of the tax-payer deeply influences the gender pay gap. Rovigo
and Belluno are the provinces in which the incomes declared by women and men
strongly differ from the national average. Otherwise, while the territorial profile of
women’s incomes is quite homogenous, the territorial variability of male incomes is
higher, in particular in Rovigo and Belluno provinces. While the difference between the
medium income of men and of women in the other provinces is around 60% (around
8,000 euros), in Belluno and Rovigo the difference is respectively 63.1% and 65.9%.
The gender pay gap is lower in the less developed and less rich provinces and this is
linked to the fact that in these areas the medium male income is far lower than the
Regional average. These results also seem to show that the economic development of an
area leads to higher gender pay gap. Together with the implementation of economic
development policies for disadvantaged areas, it is necessary to implement also gender
oriented policy to avoid the spreading of the gender pay gap.
In general terms, the Veneto Region’s survey identified some general assumptions:
3
In fact, by calculating the overall amount of taxes (calculated in % of the earnings) paid by women and
men in a certain period of time (2000-2004), also the “unemployed women” affect the data creation,
because the lack of taxes-declaration means a lack of retribution.
8
a) the differences in terms of incomes between women and men tend to increase
during the period of life in which greater conciliation problems linked to
professional life and family care occur (from 40 to 60 years)
b) the gender pay gap is lower in less rich provinces;
c) for women, the overall income is more affected by the incomes deriving from
“classic employment”;
d) the bigger gender pay gap relates to entrepreneurial / autonomous activities
incomes;
e) women enter the entrepreneurial world with greater difficulties;
f) for women, the importance of “shareholding incomes” is lower than for men;
g) the medium income of women increases with the dimension of the family;
h) for women aged 20 – 39, more family concerns mean less incomes;
i) the gender pay gap for married women is greater if compared with the one of
single women;
j) the real estate income is higher for women than for men, in particular for single
women;
k) the inherited real estate is an “exchange-factor” among genders, through the
allocation of current income to men (male family breadwinners) and the collected
saving to women;
l) the higher is the number of children, the lower is the participation of married
women to income building processes
m) the percentage of women with no income increases with the increasing of their
husbands’ income, as well as the income of a married woman decreases with the
increasing of her husband’s income.
Is it a matter of intelligence and culture?
The above mentioned data seem to show a clear picture of the gender pay gap in Italy
and in Veneto Region in particular. The factors behind these differences had been
identified: sharing between professional and family life, maternity, a little bit of cultural
discrimination. But what about “educational level”?
A recent survey of Almalaurea4 revealed that in Italy women with the same educational
level as men (the same University Degree) earn less than men. The survey considered the
most important universities in Italy, but we took into consideration only the most
important university in Veneto Region. Here some data:
University
Faculty
Padua
Verona
Psychology
Language
Men Income after 1 Women Income after
year
1 year
923 euro / month
596 euro / month
1,110 euro / month
880 euro / month
Venice
Veneto
(av.)
Maths
1,025 euro / months
673 euro / months
325 (35%)
1,079 euro / month
894 euro / month
185 (18%)
4
average
Gender Pay
Gap
327 (36%)
230 (21%)
http://www.almalaurea.it/info/almanews/salastampa/rassegna/2011/110311_cv.pdf
9
As it is possible to see, there are impressive gaps between the female incomes and the
male incomes one year after the exit from the University, for graduates of the same
faculty. Even if the medium gender pay gap of Veneto Region universities is 18% (quite in
line with the EU average, which is 20%), the situation cannot be considered acceptable.
Ms Romana Frattini, the component of the Equal Opportunities Committee of Ca’ Foscari
University in Venice, declared that “this problem is often underestimated and also
women themselves believe that is something not existing anymore. Women are
underpaid first, and then underdeveloped in terms of career. Women incomes, at
directorate level, are 30% lower than male incomes in firms”.
.
10
Study 02: Differenziale retributivo di genere: una
prospettiva regionale
La differenza media tra le retribuzioni orarie degli uomini e
quelle delle donne è nota come differenziale retributivo di
genere. Il differenziale retributivo di genere riflette le
discriminazioni e le ineguaglianze in essere nel mercato del
lavoro che, in pratica, colpiscono soprattutto le donne. Le
sue cause sono complesse e interrelate5.
Partendo da questa definizione di “differenziale retributivo di genere” (Gender Pay
Gap), lo Studio Tematico svolto dalla Regione Veneto (esperti/e di Veneto Lavoro)
nell’ambito del progetto G4G ha lo scopo di tracciare un quadro aggiornato dell’attuale
situazione, raccogliendo e analizzando i dati più recenti e la ricerca più significativa che
mettono a fuoco il livello nazionale e regionale. Questi dati saranno comparati con le
statistiche a livello UE, allo scopo di misurare le differenze e individuare le misure da
prendere per ridurre il divario tra la situazione esistente e gli obiettivi della strategia
Europa 2020.
L’Itala e il differenziale retributivo di genere: una situazione difficile nascosta dietro
buoni risultati
I dati europei sono confermati anche da una recente indagine dell’ISTAT (maggio 2011) a
livello nazionale, in cui si afferma che i redditi delle donne sono del 20% inferiori a quelli
degli uomini: se la retribuzione media maschile è di circa 1.400 euro, quella femminile si
ferma a 1.131 euro.
Anche se il 20% di differenziale retributivo di genere può non sembrare alto se
comparato con quello di altri paesi UE, come conferma la ricerca UE “Nella maggior parte
dei paesi in cui il tasso di occupazione femminile è basso (ad esempio Malta, Italia,
Grecia, Polonia), il differenziale retributivo è più basso della media UE, il che può
rispecchiare la presenza di una piccola proporzione di donne scarsamente o per nulla
competenti nella forza lavoro”. Allo scopo di verificare questo presupposto, l’analisi dei
documenti e delle ricerche più significative nel campo del differenziale retributivo di
genere e in particolare la ricerca condotta sull’argomento dall’ISFOL “Esiste un
differenziale retributivo di genere in Italia? Il lavoro femminile tra discriminazioni e diritto
alla parità di trattamento”6, pubblicata dal Ministero della Sanità e delle Politiche Sociali
nel 2010, aiuteranno a far luce su questa controversa questione.
5
http://ec.europa.eu/social/main.jsp?catId=681&langId=en
http://www.lavoro.gov.it/Lavoro/Europalavoro/SezioneEuropaLavoro/DGPOF/ProdottiEditoriali/CollaneE
ditoriali/LibriFSE/differenzialeretributivo.htm
6
11
Donne
non
sposate
Nord
Occupate
In cerca di
lavoro
Casalinghe
Altro
Va 000
Centro
Occupate
In cerca di
lavoro
Casalinghe
Altro
Va 000
Sud
Occupate
In cerca di
lavoro
Casalinghe
Altro
Va 000
Italia
Occupate
In cerca di
lavoro
Casalinghe
Altro
Va 000
Figlie
Coppia
con
figli/ie
Coppia
senza
figli/ie
Famiglia
mono
parentale
Totale
87,4
7,4
81,4
4,2
67,3
2,5
79,3
4,1
85,9
2,6
72,3
3,1
1,0
4,2
184
6,4
8,0
147
29,5
0,8
1.587
14,9
1,8
242
11,1
0,5
165
22,9
1,6
2.325
94,2
1,9
84,0
10,0
63,3
2,4
77,0
6,0
70,3
9,6
69,1
3,9
2,9
0,9
81
1,8
4,2
70
33,5
0,8
684
15,4
1,5
101
20,1
0,0
94
25,9
1,0
1.030
67,6
13,0
47,5
19,0
36,0
5,2
53,5
3,9
57,8
12,9
40,6
7,1
15,7
3,8
81
20,9
12,7
157
75,4
1,4
1.377
39,4
3,3
98
25,4
3,8
98
49,6
2,7
1.811
84,4
7,4
67,6
11,5
54,7
3,5
73,0
4,5
74,1
7,3
60,6
4,7
4,9
3,3
346
11,6
9,3
374
40,8
1,0
3.648
20,4
2,0
441
17,4
1,3
357
32,9
1,9
5.166
Tabella 1
Donne di 3545 anni d’età,
condizione
occupazionale,
struttura
familiare e
distribuzione
territoriale
ISFOL, Esiste un
differenziale
retributivo di
genere in Italia?
Il lavoro
femminile tra
discriminazioni
e diritto alla
parità di
trattamento ,
pubblicato dal
Ministero della
Salute e delle
Politiche Sociali
in 2010
La Tabella 1 rivela come il basso differenziale retributivo di genere italiano potrebbe
essere effettivamente connesso al basso tasso di occupazione della forza lavoro
femminile, come suggerito dagli/dalle esperti/e dell’UE. L’indagine è stata svolta nel 2008
attraverso questionari e si è rivolta a più di 5.000 donne in tutte e tre le aree della
penisola italiana. In particolare, è interessante osservare come nell’Italia Meridionale la
percentuale di donne occupate è solo del 40,6% (contro il 60,6% a livello nazionale) e
come il 49,6% (contro il 32,9%) di donne rientra nella categoria delle casalinghe. Con un
numero così alto di donne “fuori dal mercato del lavoro”, è assolutamente normale
trovare un basso livello di differenziale retributivo di genere in Italia, ma dobbiamo
sottolineare come questo dato non sia significativo per descrivere la situazione reale.
Allo scopo di spiegare meglio quanto il “livello occupazionale” (e “l’età”, come altro
importante criterio) può influenzare gli indicatori di differenziale retributivo di genere in
12
Italia, ci riferiamo alla ricerca dell’ISTAT intitolata “La situazione del Paese nel 2004”
(Report Annuale), condotta tra imprese con almeno 10 dipendenti e appartenenti al
settore privato non-agricolo. La metodologia di indagine ha distinto tra l’“effetto sistema
organizzativo” (quanto un singolo aspetto, come capitale umano / situazione
contrattuale / dimensione dell’impresa influisce sulla retribuzione) e l’“effetto
retribuzione” (quanto un singolo aspetto è pagato in modo differente alle donne rispetto
agli uomini). L’indagine ha rivelato come il differenziale retributivo di genere globalmente
considerato era circa del 16%, con un’incidenza del 4,9% della componente “sistema
organizzativo” e dell’11,1% della “componente retribuzione”. L’effetto “retribuzione” è
determinato da diverse cause, ma la ragione principale è sicuramente la “differente
remunerazione dell’età”. Se per gli uomini (escludendo ogni altro effetto scoperto) la
retribuzione aumenta con l’età dello 0,8%, per le donne aumenta solo dello 0,5%. Inoltre,
il fattore età influenza la retribuzione anche dal punto di vista “sistema organizzativo”, a
causa del fatto che i lavoratori uomini sono più anziani delle loro colleghe: da un lato, il
grande aumento dell’occupazione femminile è un fenomeno recente e dall’altro lato le
donne sono state (e sono) tradizionalmente caratterizzate da una “vita lavorativa
anticipata” rispetto agli uomini (esse di solito entrano ed escono prima!). Le donne
hanno di solito meno “anni di lavoro sulle proprie spalle in una azienda”, ma in generale,
l’anzianità in azienda per una donna non significa una retribuzione più bassa di quella
degli uomini. Quindi, le differenze di retribuzione sono più influenzate dall’età che dalla
discriminazione. Vale la pena di dire che, in questo caso, la maternità per le donne
rappresenta un grosso ostacolo per una uguale retribuzione!
Il differenziale retributivo di genere in Italia è evidente dall’inizio della vita lavorativa e
rimane (in alcuni casi cresce) durante la parte centrale della carriera professionale,
quando è più difficile per le donne conciliare la vita professionale e quella personale
(figli/ie, famiglia, ecc.).
Seguendo una tendenza storica, il differenziale retributivo di genere in Italia è stato in
decrescita negli anni più recenti. L’ultima colonna della Tabella 2 (Retribuzione media per
genere e posizione professionale, 2002) mostra come il differenziale retributivo di genere
nel 2002 fosse del 23,3%, mentre l’indagine più recente ha rivelato un tasso del 16% nel
2004 e di poco superiore al 10% nel 2008. Ma, come sottolineato sopra, questi risultati
devono essere letti attraverso le lenti dell’alto livello di disoccupazione femminile
registrato in Italia.
13
Tabella 2
Il differenziale retributivo di genere in Veneto: una situazione difficile nascosta dietro
buoni risultati
I più recenti dati riguardanti il differenziale retributivo di genere in Veneto si riferiscono
al 2000-2004 e sono stati raccolti in “I redditi delle donne e degli uomini in Veneto – Quali
prospettive per una fiscalità di genere?” dall’Assessorato Regionale al bilancio della
Regione Veneto. Diversamente dalle indagini menzionate sopra, l’analisi della Regione
Veneto ha preso in considerazione l’“ammontare dei redditi dichiarati da donne e
uomini” nelle diverse Province del Veneto, includendo indirettamente nei dati anche i/le
“disoccupati/e”7.I/le ricercatori/trici hanno scoperto che il differenziale retributivo di
genere “reale” nella Regione Veneto è di circa il 40% (e non solo del 19% indicato dalle
statistiche UE). La Tabella 3 mostra la distribuzione del differenziale retributivo di genere
nelle 7 province.
Tabella 3 - Distribuzione del differenziale retributivo di genere nelle Province della Regione Veneto (20002004)
7
Infatti, calcolando l’ammontare complessivo delle tasse (calcolate in % ai redditi) pagate dalle donne e
dagli uomini in un certo periodo di tempo (2000-2004), anche le “donne disoccupate women” influiscono
sulla creazione dei dati, perché la mancanza di dichiarazione dei redditi significa una mancanza di
retribuzione.
14
La Provincia di residenza del/della contribuente influenza profondamente il differenziale
retributivo di genere. Rovigo e Belluno sono le province in cui i redditi dichiarati dalle
donne e dagli uomini differiscono fortemente dalla media nazionale. Diversamente,
mentre il profilo territoriale dei redditi delle donne è abbastanza omogeneo, la variabilità
territoriale dei redditi degli uomini è più alta, in particolare nelle province di Rovigo e di
Belluno. Mentre la differenza tra il reddito medio degli uomini e quello delle donne nelle
altre province è circa del 60% (circa 8.000 euro), in quelle di Belluno e di Rovigo la
differenza è rispettivamente del 63,1% e del 65,9%.
Il differenziale retributivo di genere è inferiore nelle province meno sviluppate e meno
ricche e ciò è collegato al fatto che in queste aree il reddito medio degli uomini è molto
più basso della media regionale. Questi risultati sembrano anche mostrare che lo
sviluppo economico di un’area porta ad un differenziale retributivo di genere più alto.
Insieme all’implementazione di politiche di sviluppo economico per le aree svantaggiate,
è necessario implementare anche politiche attente al genere per evitare l’allargamento
del differenziale retributivo di genere.
In termini generali, l’indagine della Regione Veneto ha individuato alcuni presupposti
generali:
n) le differenze in termini di redditi tra le donne e gli uomini tendono a crescere
durante la fase della vita in cui si concentrano i maggiori problemi di conciliazione
tra vita professionale e cure familiari (dai 40 ai 60 anni)
o) il differenziale retributivo di genere è inferiore nelle province meno ricche;
p) per le donne, il reddito complessivo è più influenzato dai redditi che derivano
dall’“occupazione classica”;
q) il maggiore differenziale retributivo di genere si riferisce ai redditi da attività
imprenditoriali / di lavoro autonomo;
r) le donne accedono al mondo imprenditoriale con maggiori difficoltà;
s) per le donne, l’incidenza dei “redditi da partecipazione azionaria” è inferiore che
per gli uomini;
t) il reddito medio delle donne cresce all’aumentare del nucleo familiare;
u) per le donne con età compresa tra i 20 e i 39 anni, un maggior carico familiare
determina minori redditi;
v) il differenziale retributivo di genere per le donne sposate è maggiore se
comparato a quello delle donne non sposate;
w) il reddito immobiliare è più alto per le donne che per gli uomini, in particolare per
le donne non sposate;
x) il patrimonio immobiliare rappresenta un “elemento di scambio” tra i generi,
attraverso l’attribuzione del reddito corrente agli uomini (procacciatori di reddito
familiare) e del risparmio accumulato alle donne;
y) all’aumentare del numero dei/delle figli/ie si riduce la partecipazione delle donne
sposate alla formazione del reddito.
z) la percentuale delle donne che non hanno redditi tende ad aumentare al crescere
del reddito percepito dal marito, così come il reddito di una donna sposata
diminuisce all’aumentare del reddito del marito.
15
È una questione di intelligenza e di cultura?
Sembra che i dati menzionati sopra traccino un quadro chiaro del differenziale retributivo
di genere in Italia e in particolare nella Regione Veneto. I fattori che determinano queste
differenze sono stati individuati: conciliazione tra vita professionale e familiare,
maternità, un po’ di discriminazione culturale. Ma che dire del “livello d’istruzione”?
Una recente indagine di Almalaurea8 ha rivelato che in Italia le donne con lo stesso livello
di istruzione degli uomini (la stessa laurea) guadagnano meno degli uomini. L’indagine ha
considerato le più importanti università in Italia, ma noi abbiamo preso in considerazione
solamente the più importanti università del Veneto. Ecco alcuni dati:
Università
Facoltà
Reddito maschile
dopo 1 anno
Padova
Verona
Psicologia
Lingue
923 euro / mese
1.110 euro / mese
596 euro / mese
880 euro / mese
Differenziale
salariale di
genere
327 (36%)
230 (21%)
Venezia
Veneto
(media)
Matematica
1.025 euro / mese
673 euro / mese
325 (35%)
media
1.079 euro / mese
894 euro / mese
185 (18%)
Reddito femminile
dopo 1 anno
Come si può vedere, ci sono differenziali impressionanti tra i redditi delle donne e quelli
degli uomini un anno dopo l’uscita dall’Università, per laureati/ della stessa facoltà.
Anche se il differenziale retributivo di genere medio nelle università del Veneto è del 18%
(abbastanza in linea con la media UE, che è del 20%), la situazione non può essere
considerata accettabile.
Romana Frattini, componente del Comitato Pari Opportunità dell’Università di Ca’ Foscari
a Venezia, ha dichiarato che “questo problema è spesso sottostimato e anche le donne
stesse credono che sia qualcosa che non esiste più. Le donne sono prima sottopagate, e
poi insufficientemente sviluppate in termini di carriera. I redditi delle donne, a livello
dirigenziale, sono del 30% più bassi dei redditi degli uomini nelle aziende”.
8
http://www.almalaurea.it/info/almanews/salastampa/rassegna/2011/110311_cv.pdf
16
Thematic studies on Gender Equality.
Equality.
Study 02
02 Gender Pay gap
Studi tematici sulla parità di genere:
genere:
Studio 02
02: Differenziale retributivo di genere: una prospettiva regionale
regionale.
www.gender4growth.eu
Consiliul Judetean TIMIS
Scarica