UNIVERSITÀ DEGLI STUDI DI SASSARI
SCUOLA DI DOTTORATO DI RICERCA
Scienze e Biotecnologie
dei Sistemi Agrari e Forestali
e delle Produzioni Alimentari
Scienze e Tecnologie Zootecniche
Ciclo XXVI
Statistical Tools for Genome-Wide Studies
dr. Massimo Cellesi
Direttore della Scuola
Referente di Indirizzo
Docente Guida
Tutor
prof. Alba Pusino
prof. Nicolò P. P. Macciotta
dr. Corrado Dimauro
prof. Nicolò P. P. Macciotta
Anno accademico 2012- 2013
Index
Chapter 1
General Introduction .................................................................................................................................6
Pedigree and phenotype to compute EBV.............................................................................................8
EBV and quantitative trait loci ..............................................................................................................9
Genomic Selection .............................................................................................................................. 10
SNP-BLUP (RR-BLUP) ...................................................................................................................... 11
G-BLUP ........................................................................................................................................... 12
BAYESIAN METHODS ...................................................................................................................... 14
BayesA ............................................................................................................................................ 14
Bayesian Lasso ............................................................................................................................... 16
BayesB ............................................................................................................................................ 17
Genome-wide association studies ...................................................................................................... 19
Single marker regression ................................................................................................................ 19
The mixed model ............................................................................................................................ 20
Imputation.......................................................................................................................................... 22
Hidden Markov model .................................................................................................................... 23
Outline of the thesis ........................................................................................................................... 24
References .......................................................................................................................................... 26
Chapter 2
The impact of the rank of marker variance-covariance matrix in principal component evaluation for
genomic selection applications .............................................................................................................. 31
Summary ............................................................................................................................................ 32
Introduction........................................................................................................................................ 32
The Principal Component Analysis ..................................................................................................... 34
The rank of the genomic variance-covariance S matrix and its effect on PC extraction .................... 35
A simulation study .............................................................................................................................. 37
Statistical Tools for Genomic-Wide Studies
Tesi di Dottorato in Scienze dei Sistemi Agrari e Forestali e delle Produzioni Alimentari
Scienze e Tecnologie Zootecniche – Università degli Studi di Sassari
Massimo Cellesi
3
Materials ........................................................................................................................................ 37
Methods ......................................................................................................................................... 37
Results and discussion ........................................................................................................................ 38
Conclusions ......................................................................................................................................... 42
References .......................................................................................................................................... 43
Chapter 3
Use of partial least squares regression to impute SNP genotypes in Italian Cattle breeds ................... 45
Abstract .............................................................................................................................................. 46
Background .................................................................................................................................... 46
Methods ......................................................................................................................................... 46
Results ............................................................................................................................................ 46
Conclusions ..................................................................................................................................... 47
Background ........................................................................................................................................ 47
Methods ............................................................................................................................................. 49
Data ................................................................................................................................................ 49
The partial least squares regression imputation method .............................................................. 50
Genotype imputation from 3K (7K) LDP to the 50K SNP panel ...................................................... 51
Genotype imputation from 3K LDP to the 50K SNP panel for different breeds .............................. 52
Evaluation of imputation accuracy ................................................................................................ 52
Results ................................................................................................................................................ 53
Discussion ........................................................................................................................................... 56
Conclusions ......................................................................................................................................... 59
Competing interests ....................................................................................................................... 60
Authors’ contributions.................................................................................................................... 60
Acknowledgements ............................................................................................................................ 60
References .......................................................................................................................................... 61
Chapter 4
Maximum Difference Analysis: a new empirical method for genome-wide association studies ........... 65
Introduction........................................................................................................................................ 66
Massimo Cellesi
Statistical Tools for Genomic-Wide Studies
Tesi di Dottorato in Scienze dei Sistemi Agrari e Forestali e delle Produzioni Alimentari
Scienze e Tecnologie Zootecniche – Università degli Studi di Sassari
4
Results ................................................................................................................................................ 69
Significant associations .................................................................................................................. 69
Milk yield ........................................................................................................................................ 74
Fat yield .......................................................................................................................................... 75
Protein yield ................................................................................................................................... 76
Fat percentage ............................................................................................................................... 76
Protein percentage ......................................................................................................................... 77
Discussion ........................................................................................................................................... 77
Materials and Methods ...................................................................................................................... 81
The data ......................................................................................................................................... 81
The MDA method ........................................................................................................................... 81
Conclusions ......................................................................................................................................... 84
References .......................................................................................................................................... 85
Chapter 5
Prediction of direct genomic values by using a restricted pool of SNP selected by maximum difference
analysis ................................................................................................................................................... 92
Introduction........................................................................................................................................ 93
Materials and methods ...................................................................................................................... 95
The data ......................................................................................................................................... 95
The MDA approach ........................................................................................................................ 95
Direct genomic value evaluation .................................................................................................... 97
Results ................................................................................................................................................ 98
Discussion ........................................................................................................................................... 99
Conclusion ........................................................................................................................................ 100
References ........................................................................................................................................ 101
Chapter 6
Conclusions ........................................................................................................................................... 103
References ........................................................................................................................................ 107
Supplemental material (Chapter 4) ...................................................................................................... 108
Massimo Cellesi
Statistical Tools for Genomic-Wide Studies
Tesi di Dottorato in Scienze dei Sistemi Agrari e Forestali e delle Produzioni Alimentari
Scienze e Tecnologie Zootecniche – Università degli Studi di Sassari
5
Massimo Cellesi
Statistical Tools for Genomic-Wide Studies
Tesi di Dottorato in Scienze dei Sistemi Agrari e Forestali e delle Produzioni Alimentari
Scienze e Tecnologie Zootecniche – Università degli Studi di Sassari
Chapter 1
General Introduction
Statistical Tools for Genomic-Wide Studies
Tesi di Dottorato in Scienze dei Sistemi Agrari e Forestali e delle Produzioni Alimentari
Scienze e Tecnologie Zootecniche – Università degli Studi di Sassari
Massimo Cellesi
7
Selection in livestock is a technique that has been known for millenniums. In fact, Virgil, in
the 3th book of the “Georgica” (36-29 B.C.), wrote about the procedures adopted in bovine
selection in his era. Since then, the aim of animal selection has not changed substantially and
is generally aimed to obtain animals with high resistance to diseases and high productive
performance, both for milk yielded and meat produced. Many years later, Darwin (1869)
proposed the use of selection in animal breeding and stated that “The key is man’s power of
accumulative selection: nature gives successive variations; man adds them up in certain
directions useful to him”.
In any selection procedure, animals have to be evaluated objectively. Therefore, after the
traits of interest are individuated, they are studied by using numerical parameters. The first
statistical evaluation of the genetic merit of a dairy sire was developed by Lush in 1931. In his
work, Lush asserted that the evaluation of an animal was more accurate using a progeny test
than a rating based on the pedigree. By using a path coefficient and assuming that genetic
and environmental components of variance were known, Lush gave a formula for assessing
the genetic merit of dairy sires for factors affecting milk production, using the correlation
between the average record of the daughters and the genotype of the sire (Lush 1931).
Some years later, Hazel (1943) defined a selection index for measuring the net merit of
individuals. To evaluate this index, multiple traits instead of a single trait were taken into
account. Using traits of economic importance, an aggregate genotype value for each animal
was obtained as a sum of its genotypes weighted by the relative economic value of that trait.
Using this aggregate genotype, the selection index was obtained by maximizing the
correlation between the aggregate genotype and the index itself, but to get a reliable index a
well-estimated phenotype (measured on the animal itself and on its relatives) and a genetic
variance-covariance matrix were used.
Massimo Cellesi
Statistical Tools for Genomic-Wide Studies
Tesi di Dottorato in Scienze dei Sistemi Agrari e Forestali e delle Produzioni Alimentari
Scienze e Tecnologie Zootecniche – Università degli Studi di Sassari
8
The introduction of the selection index was an important milestone in genetic selection
because it was the first statistical method used to evaluate the genetic merit of an individual
through its phenotype and the phenotypes of its relatives.
Pedigree and phenotype to compute EBV
The estimation of the breeding value (EBV) of animals involved in selection programs is the
most important tool to obtain a high genetic improvement in livestock species.
The estimation of breeding value, evaluated by using both pedigree and phenotype recorded
on the animals under study, depends on the knowledge of the relationships between the
involved individuals. As a consequence, the estimation of the proportion of the phenotypic
variance explained to the genotype is obtained by using the relationship matrix. The
combination of pedigree and phenotype information with the estimated heritability allows to
evaluate the breeding values of the animals. However, due to the enormous dimension of
the relationship matrix, a huge amount of computer resources and long computational time
are needed (Calus, 2009).
Henderson (1975) proposed a new computational method, named best linear unbiased
prediction (BLUP), which is able to improve the accuracy of prediction of breeding values by
using all relationships among animals. For many years, this technique has been largely
applied and has led to positive results in genetic evaluation programs. However, to get a
considerable genetic gain, lots of years are required, especially for traits that can be
measured only in one sex (e.g. milk traits), after death (e.g. meat quality) or late in life (e.g.
longevity) (Goddard and Hayes, 2009). Another negative aspect of the BLUP approach is that
it contributes to an increase in the degree of inbreeding among animals, because it favors the
close relatives. Finally, BLUP makes the assumption of the infinitesimal model (Fisher, 1918),
where an infinite number of genes with very small effect contribute to the trait (Calus, 2009).
This seems a practical but biologically unrealistic assumption because it is known that most
of the infinitesimal model assumptions are not verified. Indeed, the number of loci is finite
Massimo Cellesi
Statistical Tools for Genomic-Wide Studies
Tesi di Dottorato in Scienze dei Sistemi Agrari e Forestali e delle Produzioni Alimentari
Scienze e Tecnologie Zootecniche – Università degli Studi di Sassari
9
or, after repeated selection, the assumption of normality may not be reasonable (Fairfull et
al. 2011)
EBV and quantitative trait loci
BLUP and similar statistical procedures, which belong to the so called “quantitative genetics”
area, do not use any genetic information directly. The introduction of new molecular
techniques able to map the DNA and produce a sparse map of genetic markers has given new
momentum to genetic improvement. Fernando and Grossman (1989) applied the BLUP
technique to a mixed linear model that also incorporated a marker factor containing
information on the linked quantitative trait loci (QTL). Lande and Thompson (1990) showed
how molecular genetics could integrate the traditional methods of genetic selection based on
phenotypes and pedigree. These methods, where molecular genetics information is
integrated in the selection procedures, are known as marker-assisted selection (MAS). This
approach was able to increase the genetic gain by 9-38% (Meuwissen and Goddard 1995).
With this new approach a more realistic model, alternative to the infinitesimal model, was
proposed. In this model, known as the finite locus model, most of phenotype expression is
explained by a small number of loci with a large effect, i.e. the QTL, whereas the remaining
part of phenotypic variance is explained by a great number of loci with an infinitesimal effect.
The initial expectations of a wide use of QTLs in MAS were not completely satisfied because
of the presence of some undesirable aspects. Early marker maps were very sparse and,
therefore, the QTL mapping was extremely difficult. Associations between chromosome
regions and QTLs were studied by using the linkage analysis, which usually locates QTLs at
intervals greater than 20 cM. In this scenario, the identification of underlying mutations and
the use of marker information in MAS is very difficult (Goddard and Hayes 2009).
Nevertheless, some important QTL regions that control milk production were detected in
cattle populations (Georges et al. 1995; Weller et al. 1990). However, their use in animal
Massimo Cellesi
Statistical Tools for Genomic-Wide Studies
Tesi di Dottorato in Scienze dei Sistemi Agrari e Forestali e delle Produzioni Alimentari
Scienze e Tecnologie Zootecniche – Università degli Studi di Sassari
10
breeding programs is not easy, because these models tend to overestimate the QTL effects
(Beavis effect) (Xu, 2003b). Moreover, the estimated QTL effects should be validated in an
independent population before this information could be used in genetic selection programs.
More recent developments in QTL mapping methods have given more precise maps by using
the linkage disequilibrium (LD) between markers and QTLs (Aulchenko et al. 2007). The
advantage of using the LD for QTL mapping purposes is that the LD quickly decreases as the
distance between markers and QTL increases. Consequently, a QTL can be located into a
narrower region (Goddard and Hayes 2009). Recently, the availability of high density SNP
platforms at reasonably low costs allows to map more and smaller QTLs. Nevertheless, the
estimation of QTLs with small effects on the trait under study is difficult and decreases the
precision with which the effects of total QTLs are estimated (Calus 2009). Another critical
aspect of MAS is that, generally, few markers associated with a QTL are validated in an
independent sample population. Using these validated markers, the ability to estimate the
breeding value is limited because they explain only a small proportion of the genetic
variance. This effect is also confirmed in complex traits studied in humans where only a
proportion of the estimated trait hereditability, usually less than half, is explained by QTLs
(Stranger et al. 2011).
Genomic Selection
Both accuracy and efficiency of breeding value estimation procedures increased by using the
method of Meuwissen et al. (2001), who applied a multiple QTL approach known as genomic
selection (GS). This method skipped the QTL-mapping step and estimated the effects of a
high number of markers across the genome simultaneously. One of the main difference
between the first type of MAS (QTL-MAS) and GS is that QTL-MAS uses the information of a
few known QTLs in LD with some markers, whereas GS uses a huge number of markers
available in a high density SNP platform. In this approach, all SNPs are considered in LD with a
QTL and effects of known and unknown QTLs are accounted for. Furthermore, being all
effects simultaneously estimated, the total genetic variance is not, on average,
overestimated (Calus 2009; Goddard and Hayes 2009).
Massimo Cellesi
Statistical Tools for Genomic-Wide Studies
Tesi di Dottorato in Scienze dei Sistemi Agrari e Forestali e delle Produzioni Alimentari
Scienze e Tecnologie Zootecniche – Università degli Studi di Sassari
11
Genomic selection conceptually proceeds in two steps:
•
Estimation of the effects of each marker in a reference population where genotypes
and a reliable EBV are known;
•
Prediction of the genomic estimated breeding values (GEBV) for animals not present
in the reference population, such as young selection candidates, with known
genotypes but without performance records.
In the second step, GEBVs of animals with genotype data but not phenotypes are estimated
by summing the effect of each marker across the whole genome:
GEBV = Xgˆ
where X is a design matrix allocating animals to genotypes, and ĝ is the vector of marker
effects.
There are, however, two main critical issues in the estimation of marker effects. The first is
that the number of marker effects that have to be estimated is greater than the number of
animals with known genotype and phenotype. The second regards the assumption related to
the prior distribution of the variance of SNP effects. Some of the models proposed to solve
these problems are the SNP-BLUP (Meuwissen et al. 2001; Moser et al. 2010), the GBLUP
(Hayes et al. 2009, Van Raden et al. 2009) and the Bayesian approach termed as Bayesalphabet (Meuwissen et al. 2001; Xu 2003a). Each model makes different assumptions about
the prior distribution of marker effects.
SNP-BLUP (RR-BLUP)
The SNP-BLUP (RR-BLUP) model assumes that each of m SNP has a very small effect on the
genetic variance of the trait. If n is the number of animals with known genotype and reliable
EBV and m is the number of markers, the model is:
Massimo Cellesi
Statistical Tools for Genomic-Wide Studies
Tesi di Dottorato in Scienze dei Sistemi Agrari e Forestali e delle Produzioni Alimentari
Scienze e Tecnologie Zootecniche – Università degli Studi di Sassari
12
y = 1n µ + Xg + e
where y is the reliable EBV, 1n is a vector of 1s, µ is the overall mean, X is a design matrix,
allocating records to genotypes for markers (n rows and m columns), g is a vector of random
effect of markers, and e is a vector of residuals that are assumed to be normally distributed
with e N ( 0, Iσ e2 ) . In this model marker effects are assumed to be normally distributed
with g N ( 0, Iσ g2 ) , where σ g2 is the variance of the marker effects. The solution of the
previous model is given by:
µˆ 1′n1n
=
gˆ X ′1n
where λ =
−1
1′n X 1′n y
X ′X + I λ X ′y
σ e2
and I is the identical matrix. σ g2 is unknown but can be calculated from the
σ g2
total genetic additive variance σ a2 , estimated, for instance, by REML (Gilmour et al. 2009).
Therefore, assuming that all markers contribute equally to the total amount of the explained
variance, the genetic variance can be estimated as σ g2 =
σ a2
m
. This assumption, however,
seems unrealistic (Meuwissen et al. 2001). A more accurate estimation of σ g2 can be done by
taking
σ g2 =
into
m
account
σ a2
2∑ p j (1 − p j )
the
differences
in
marker
allele
frequencies
as follows:
where p j is the allele frequency of marker j.
j =1
G-BLUP
An alternative and equivalent method to the SNP-BLUP, to estimate GEBV using marker
information, is the G-BLUP, which uses a genomic relationship matrix G instead of the
pedigree derived relationship matrix (Van Raden 2008, Hayes et al. 2009). Moreover, in the
Massimo Cellesi
Statistical Tools for Genomic-Wide Studies
Tesi di Dottorato in Scienze dei Sistemi Agrari e Forestali e delle Produzioni Alimentari
Scienze e Tecnologie Zootecniche – Università degli Studi di Sassari
13
G-BLUP, the genetic variance explained by each marker is not constant and changes
according to marker allele frequencies. The G-BLUP model is:
y = 1n µ + Zg + e
where y is the reliable EBV, 1n is a vector of 1s, µ is the overall mean, Z is a design matrix
allocating records to breeding values, g is the vector of SNP effects, and e is a vector of
random residuals, which are assumed to be normally distributed with e N ( 0, Iσ e2 ) . Let
2
g = Wu where ui is the a vector of breeding values and Var ( g ) = WW ′σ u where σ u2 is the
variance breeding values. W is a design matrix allocating records to genotypes with
w=
xi , j − 2 p j , where xi , j is the genotype jth SNP of the ith animal and pj is the allele
i, j
frequency of jth markers. If WW ′ is scaled, the genomic relationship matrix G is defined as
G=
nWW ′
n
∑w
i =1
and Var ( g ) = Gσ g2 . Using this model, the breeding value for both phenotype and
i ,i
non-phenotype individuals can be evaluated by the equations as follows:
1′n1n
µˆ
gˆ = Z ′1
n
1′n Z
−1
1′ y
2 n
−1 σ e
Z ′Z + G
Z ′y
2
σ g
This method is very attractive for populations without good pedigree records because the
genomic relationship matrix will capture this information among the genotyped individuals.
The accuracy of the estimation of GEBV in single breed populations of G-BLUP agrees
reasonably well with the accuracy achieved with other methods such as BayesA. When the
animals in the reference and validation sets are in a multi-breed population, the accuracy of
G-BLUP is lower than that of BayesA (Hayes et al. 2009).
Massimo Cellesi
Statistical Tools for Genomic-Wide Studies
Tesi di Dottorato in Scienze dei Sistemi Agrari e Forestali e delle Produzioni Alimentari
Scienze e Tecnologie Zootecniche – Università degli Studi di Sassari
14
BAYESIAN METHODS
Both G-BLUP and SNP-BLUP approaches assume that all SNP effects are non-zero, small and
normally distributed. Moreover, the two methods evaluate the genetic variance σ g2 from the
additive variance σ a2 . Under these assumptions, the vector of marker effects ĝ can be easily
estimated and consequently the GEBV of animals can be calculated. With different and more
realistic assumptions about the variance explained by each locus or about the prior
distribution of marker effects, the GEBV prediction could be more accurate. However, the
evaluation of the genetic effects ĝ is more complicated and requires complex statistical
tools.
BayesA
The BayesA is an alternative method to BLUP to estimate the EBV. In this method data are
modeled at two levels. The first model is developed at the level of the SNP and is similar to
the SNP-BLUP model. The second model is developed at the level of variance across the
SNPs.
The first model is:
y = 1n µ + Xg + e
where µ and g are calculated from the posterior distribution of mean and SNPs effects,
given the data y. From the Bayes theorem
P ( µ, g | y ) ∝ P ( y | µ, g ) P ( µ, g )
the posterior distribution of mean µ and effects g given the data y, P ( µ , g | y ) is
proportional to the likelihood of the data given the parameters µ and g , P ( y | µ , g ) ,
multiplied by the prior distributions of µ and g P ( µ , g ) . In this method, as proposed by
Massimo Cellesi
Statistical Tools for Genomic-Wide Studies
Tesi di Dottorato in Scienze dei Sistemi Agrari e Forestali e delle Produzioni Alimentari
Scienze e Tecnologie Zootecniche – Università degli Studi di Sassari
15
Meuwissen et al. (2001), the prior distribution of µ is uniform, whereas the prior distribution
(
)
of ith SNP effect is gi N 0, σ g2i . The latter distribution highlights that the variance of each
effect is not constant as in SNP-BLUP. This assumption seems to be more realistic. Indeed, if
the variability of the variance that affects the effect gˆ i , σ g2i , is large then gˆ i can be large,
whereas if σ g2i is small, then the effect gˆ i decreases towards zero. This model, termed as
BayesA, can be solved as:
1′n1n
µˆ X ′1
gˆ 1 n
1 =
. .
gˆ m X ′ 1
m n
1′n X 1
X ′X + I
1′n X m
.
σ e2
σ g2
1
.
X ′X
X ′X
.
.
.
2
σ
. X ′X + I 2e
σ gm
−1
1′n y
′
X1 y .
.
X m′ y
The second model, considered at the level of variances of SNP effects, allows to evaluate the
σ g2 for each SNP. The variance of effects is evaluated recursively. In the first step the prior
i
distribution of σ e2 and the prior distribution of σ g2i are fixed. After, the posterior distribution
of effects across all the genome and the posterior distribution of the overall mean are
evaluated. The prior distribution of error variance σ e2 is chosen as χ −2 ( 2, 0 ) because it gives
an uninformative and uniform prior distribution. With these assumptions, the conditional
posterior distribution of error variance is:
( )
Pr ior σ e2 = χ −2 ( 2, 0 )
→
(
)
2
Post σ e=
| ei
χ −2 ( n − 2, ei′ei )
where n is the number of markers. Finally, the prior distribution of σ g2i is obtained by using
( )
an inverted chi-squared distribution: Pr ior σ g2i = χ −2 ( v, S ) where v is the number of
degrees of freedom (d.f.) and S is a scaled parameter. The chi-squared prior distribution is
Massimo Cellesi
Statistical Tools for Genomic-Wide Studies
Tesi di Dottorato in Scienze dei Sistemi Agrari e Forestali e delle Produzioni Alimentari
Scienze e Tecnologie Zootecniche – Università degli Studi di Sassari
16
useful because, by combining it with the normal distribution of data, the posterior
distribution of σ g2i also becomes a scaled inverted chi-squared:
( )
Pr ior σ g2i = χ −2 ( v, S )
→
(
)
Post σ g2i | gi = χ −2 ( v + ni , S + gi′gi )
where ni is either the number of haplotype effects at segment i or 1 when a single effect is
estimated for each SNP. Meuwissen et al. (2001) fixed v and S as v = 4.012 and S = 0.002 to
get a distribution similar to that of QTL effects obtained by Hayes and Goddard (2001) and to
obtain the expected heterozygosity of QTL when the neutral model is considered (Hayes and
Daetwyler 2013). Xu (2003a) proposed χ1−2 (with 1 d.f.), whereas Ter Braak et al. (2005)
−2
proposed χ 0.998
(with 1 − 2δ d.f.). As shown above, the posterior distribution of variance
effects depends on the knowledge of the effect gi and, therefore, σ g2i cannot be directly
estimated. Likewise, gi depends on σ g2i . This problem can be solved using the Gibbs sampling
to estimate effects and variances. The Gibbs sampler runs many times (more than 10,000
cycles) for each SNP and, once the first hundreds of evaluations of gi are discarded, the final
effect of the ith SNP, gˆ i , is obtained as the average of the remaining evaluations of gi . The
combination of the assumptions of normality distribution of marker effects and inverted chisquared distribution of variance effects results in a t-distribution of the posterior conditional
distribution of marker effects, where the probability of getting SNPs with moderate or large
effects is greater than in a normal distribution.
Bayesian Lasso
Bayesian Lasso (BayesL) (Xu 2003a; Yi and Xu 2008) is similar to the BayesA approach. BayesL
uses the same model and the same procedure of BayesA to evaluate marker effects, but it
makes a different assumption about the distribution of markers variance. In BayesL,
( )
Pr ior σ g2i
is assumed to have an exponential distribution and, after integration, the
Massimo Cellesi
Statistical Tools for Genomic-Wide Studies
Tesi di Dottorato in Scienze dei Sistemi Agrari e Forestali e delle Produzioni Alimentari
Scienze e Tecnologie Zootecniche – Università degli Studi di Sassari
17
posterior distribution of SNP effects ĝ results in a double-exponential expression. Doubleexponential distribution has a larger peak at zero and heavier tails than the normal
distribution. As a consequence, the effects of a large number of markers will be very close to
zero.
BayesB
Another possible assumption about the distribution of marker effects is a situation where a
lot of SNPs are located in regions with no QTL and, consequently, have zero, whereas some
SNPs have a moderate or large effect because they are in linkage disequilibrium with QTLs.
Meuwissen et al. (2001) called this method BayesB and proposed a prior distribution of
marker effects where many SNPs have zero effects whereas the remaining markers have a
normal distribution. In BayesB, the prior distribution is fixed with a high density, π, at σ g2i = 0
and with an inverse chi-square distribution at σ g2i > 0 :
σ g2 = 0
i
σ g2 = χ −2 ( v, S )
i
with probability π
with probability (1- π),
where v = 4.234 and S = 0.0429 (Meuwissen et al. 2001). The Gibbs sampler described in
BayesA cannot be used in the BayesB method, because it moves only where σ g2i > 0 . Indeed,
if gi ≠ 0 , it is not possible to sample from a distribution with σ g2i = 0 , whereas the
probability of finding gi = 0 is infinitesimal when σ g2i > 0 . This problem was solved by
sampling σ g2i and gi simultaneously using a Metropolis-Hastings algorithm (Meuwissen et
al. 2001).
Even if there are many works where Bayesian methods yield a more accurate prediction of
GEBV than SNP-BLUP, these results are often obtained using simulated published data
(Meuwissen et al. 2001; Habier et al. 2007). However, when using real data, the best
Massimo Cellesi
Statistical Tools for Genomic-Wide Studies
Tesi di Dottorato in Scienze dei Sistemi Agrari e Forestali e delle Produzioni Alimentari
Scienze e Tecnologie Zootecniche – Università degli Studi di Sassari
18
performances of Bayesian methods are not consistently verified. One reason for the
disagreement observed between real and simulated data could be differences between the
genetic architecture of the real population and that of simulated data. It is well known that
accuracy is proportional to hereditability (h2) and to the number of individuals in train
population (Np). Daetwyler et al. (2010) demonstrated that the accuracy of SNP-BLUP, for a
given Np and h2, was not dependent on the number of QTL (NQTL), whereas the accuracy of
BayesB was high when NQTL was low but it decreased when NQTL increased. In addition,
sometimes, the accuracy of SNP-BLUP was higher than the accuracy of BayesB when NQTL was
high.
Another problem that affects both BayesA and BayesB is their sensitivity to the prior
distribution and the parameter specification. In a simulated dataset, Lehermeier et al. (2013)
tested the sensitivity of four Bayesian methods frequently used in genome-based prediction:
Bayesian Ridge, BayesL, BayesA and BayesB. The authors found that the predictive abilities of
the tested Bayesian methods were similar, but the performances of BayesA and BayesB
depended substantially on the choice of parameters. However, all Bayesian approaches
require huge computer resources and are time expensive (Shepherd et al. 2010). The reason
is that Markov Chain Monte Carlo techniques, such as Gibbs sampling and MetropolisHasting algorithm, require thousands of samplings to detect the effect of each SNP. If the
data dimension is small, these techniques are feasible. However, in genomic selection,
animals are genotyped by using high density SNP platforms and, in this case, a huge
computational time is needed.
Several other methods have been proposed to predict the genomic breeding values of
animals in selection programs. Apart from few approaches which assume an equal
contribution of all loci to the genetic variance, a common challenge of the most part of these
methods is to reduce the dimensionality of the SNP data (Calus 2009). The reduction of the
number of SNP involved in genomic evaluations brings down the genotyping costs and might
reduce the bias due to SNP that are not in LD with any QTL.
Massimo Cellesi
Statistical Tools for Genomic-Wide Studies
Tesi di Dottorato in Scienze dei Sistemi Agrari e Forestali e delle Produzioni Alimentari
Scienze e Tecnologie Zootecniche – Università degli Studi di Sassari
19
Genome-wide association studies
Genome-wide association studies (GWAS) is a way to detect associations between markers
and production or functional traits or diseases. Associations are studied by examining many
common genetic variants in different individuals and then verifying if any variant is
associated with a trait of interest. In animal breeding programs, knowledge of the genes that
affect a particular trait can be used to select animals carrying desirable alleles (Goddard and
Hayes, 2009; Ron and Weller, 2007; Wiener et al. 2011). There are many approaches to
implement GWAS for quantitative traits, and the simplest one is the use of a linear regression
for each marker.
Single marker regression
Under the assumption of random mating among animals with no population structure, the
association between SNPs and traits can be tested by using the following model:
y = Wb + Xg + e
where y is the trait, W is a design matrix for fixed effects (e.g. mean, age and season of birth),
b is the vector of fixed effects, X is the vector of the SNP genotypes, g is the effect of the
markers, and e is the vector of residuals, assumed to be normally distributed with mean zero
(
)
and variance σ e2 : e N 0, σ e2 . In this model the effect of each marker is additive and is
considered as a fixed effect. The null hypothesis H0 is that the marker has no effect on the
trait, whereas the alternative hypothesis H1 is that the marker is in LD with a QTL that affects
the trait. The statistical test used to test the H0 is a F-test and H0 is rejected if F > Fα ,n ,m
where α is the level of significance and n and m are the degrees of freedom. The choice of
the level α of significance is a crucial point in GWAS. In genomic data analyses, tens of
thousands of markers are tested and, therefore, the α value of 0.05 normally used leads to a
Massimo Cellesi
Statistical Tools for Genomic-Wide Studies
Tesi di Dottorato in Scienze dei Sistemi Agrari e Forestali e delle Produzioni Alimentari
Scienze e Tecnologie Zootecniche – Università degli Studi di Sassari
20
very high number of false positive associations. For example, the 50K Illumina’s chip contains
around 50,000 SNP. If a threshold is fixed, the expected false positive associations are
50, 000 × 0.05 =
2,500 . To overcome this problem, a correction for the multiple test error can
be applied. Usually, the Bonferroni correction is adopted, but it is extremely conservative and
discards most of possible true associations. In fact, referring to the previous example, the
threshold that should be fixed with the Bonferroni correction
is α
=
0.05
= 10−6 and this
50, 000
value would probably cut off most associations. An alternative empirical procedure is the
permutation test (Churchill and Doerge, 1994), which is an excellent method for setting
significance thresholds in a random mating population. On the other hand, the permutation
test takes a lot of time because it fixes the α threshold by randomly shuffling, for each
marker, the phenotypes across individuals thousands of times.
Another source of spurious associations is the stratification of the population due to the
genetic drift or to the artificial selection that exists in some livestock populations (Ma et al.,
2012). These effects can be removed by using a mixed model with the population structure
as random effect.
The mixed model
In mixed models, the expectation of the outcome y is modeled using both fixed and random
effects. Fixed effects are the same as those of the single marker regression, whereas random
effects are the polygenic effect due to population structure. In cattle breeds, the assumption
of independence between traits does not hold because relatives in the sample population
share genomes and the traits are controlled by genome. The heritability h2 characterizes the
strength of control of the trait by genome, whereas the coefficient of relationship φi , j , which
characterizes the relationship between a couple of relatives i and j, is roughly proportional to
the genome shared identical-by-descent. Correlations among phenotypes of the relatives i
and j depend on the degree of relatedness φi , j and on the heritability h2 of the trait, and are
Massimo Cellesi
Statistical Tools for Genomic-Wide Studies
Tesi di Dottorato in Scienze dei Sistemi Agrari e Forestali e delle Produzioni Alimentari
Scienze e Tecnologie Zootecniche – Università degli Studi di Sassari
21
evaluated by the relation ρi , j = h 2φi , j . The model which takes into account the correlation
structure is the following:
y = 1n µ + bX + Za + e
where y is the vector of reliable EBV, 1n is a vector of 1s, µ is the overall mean, X is the
vector of the considered SNP genotype, b is the regression coefficient, Z is a design matrix for
animal effects, a is the vector of the random additive polygenic effects with a N (0, Φσ a2 ) ,
where Φ ={ ρi ,h } is the additive genetic relationship matrix, and e random residual effect
with e N (0, Iσ e2 ) (Yu et al. 2006, Aulchenko et al. 2007). The structure of the mixed model
is like that of BLUP and, therefore, its solutions are obtained as previously described for the
BLUP model. The significance of the regression coefficient b and consequently the
associations between SNPs and traits are assessed by using a t-test or Wald chi-squared.
Even if the mixed model solves the problem of the population stratification, it still has the
shortcomings of multiple testing. When a single-marker linear regression is used to test
associations for complex traits, the model might lead to inconsistent estimation of marker
effects because markers are in linkage disequilibrium with many QTL (de Los Campos et al.
2010). In animal breeding, most of the productive traits are affected by a large number of
genes with possible interactions among them. As a consequence, in genetic studies of
complex traits, the single-locus analysis does not produce reliable results (Cordell, 2009).
Another disadvantage of the single SNP approach is that LD could extend to a wide genome
region. In this case, the detection of the region containing the true mutation and the
significant associated SNPs could be difficult (Pryce et al. 2010). A possible solution to this
problem could be to fit all SNPs simultaneously by using the Bayesian-alphabet model.
Whatever the method used for GWAS, SNPs declared associated with a trait have to be
validated, even if a stringent threshold is used to detect the statistical associations. The best
way to validate the detected SNPs is to verify the associations in an independent population.
In livestock, where the degree of inbreeding is high and the pedigree structure could affect
Massimo Cellesi
Statistical Tools for Genomic-Wide Studies
Tesi di Dottorato in Scienze dei Sistemi Agrari e Forestali e delle Produzioni Alimentari
Scienze e Tecnologie Zootecniche – Università degli Studi di Sassari
22
independent samples, the most convincing validation method is across breeds. However, if a
SNP does not segregate in the breeds considered in the validation procedure, the validation
of the SNP across breeds might fail.
Imputation
Genotype imputation indicates the process of predicting genotypes that are not directly
assayed from a SNP chip panel. These “in silico” genotypes can be used to boost the number
of SNPs across the whole genome as part of a GWAS or a GS program. The imputed markers
can be also used in a more focused region as part of a fine-mapping study (Marchini and
Howie 2010). In GWAS and GS, high-density marker panels of different SNP densities (50K
and 777K) are currently used to genotype bulls and elite cows under study (Hayes et al. 2009,
Schopen et al. 2011, Chamberlain et al. 2012). In animal science, genotyping costs are one of
the major constraints which limit a large-scale implementation of GS. However, the
commercial availability of low-density SNP panels has offered new opportunities to increase
the number of animals involved in association studies and, above all, in selection programs.
Genotypes obtained from a low-density panel are currently imputed to a high-density chip
and used in addition to genotypes obtained with a high density panel.
Imputation is very useful when genotypes coming from different chips panel have to be
joined (Druet et al 2010). In this case, imputation can increase the sample size of the
population under study. In GWAS this implies an increase in the power of a given study and
can also facilitate meta-analyses in studies that combine genotypes obtained from different
sets of variants (Howie et al. 2011).
The Hidden Markov Model (HMM) is the most useful approach to perform imputation. It is
used in many of the available software suite programs, such as Beagle (Browning and
Browning 2009), IMPUTE2 (Howie et al. 2009) and FastPHASE (Scheet and Stephens 2006).
Massimo Cellesi
Statistical Tools for Genomic-Wide Studies
Tesi di Dottorato in Scienze dei Sistemi Agrari e Forestali e delle Produzioni Alimentari
Scienze e Tecnologie Zootecniche – Università degli Studi di Sassari
23
Hidden Markov model
HMM are probabilistic models where the resulting sequences are generated by two
concurrent stochastic processes. The first is a one-state Markov model where the probability
of transition from state j-1 to state j depends only on state j-1. In the second process, there is
the emission of a value (the haplotypes or the genotypes) which is regulated by an emission
probability depending on the state. The result is a sample of sequences conditioned by the
transition between states (i.e. ACCGTC). Because only the final sequence can be observed,
with no understanding of the Markov process, the model is termed hidden.
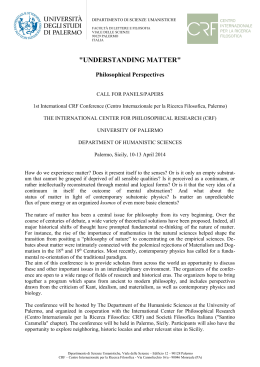
Figure 1 A Hidden Markov model for DNA sequences. The circled Si are the hidden states and the arrows
between the states indicate the state-transition probabilities. Letters inside squares indicate the symbols of
emission and the arrows between a state and a symbol are the emission probabilities.
Using Rabiner’s notation (Rabiner 1989), the five components of a HMM are as follows:
•
N hidden states: S1, S2, …. , SN;
•
M different symbols (the haplotypes A C G T): v1, v2, …. , vM;
•
State-transition
probabilities
A = {ai , j } : =
ai , j P=
xt −1 Si ) that
( xt S j |=
probability to transit from the state Si to the state Sj ;
Massimo Cellesi
Statistical Tools for Genomic-Wide Studies
Tesi di Dottorato in Scienze dei Sistemi Agrari e Forestali e delle Produzioni Alimentari
Scienze e Tecnologie Zootecniche – Università degli Studi di Sassari
is
the
24
•
Emission probabilities B = {b j ,k } : the probability of observing the symbol vk in the
state Sj;
•
Initial-state probabilities distribution π = {π i }=
: π i P=
( x1 Si ) that is the probability
that the HMM process starts at state Si.
In Figure 1 there is a HMM for DNA sequences with the Rabiner’s notation.
Once parameters N and M are fixed, the model is described by means of λ = { A, B, π } , which
is obtained fixing suitable values for A, B and π . Several problems arise with a HMM
inferring the probability of an observed sequence or detecting which could be the most likely
sequence. If the entire sequence s of length L generated by the HMM is known and if w is the
path of the starting state till the final state, the joint probability to observe s is:
L
P ( s, w | λ ) = a0,1 ∏ at ,t +1 bt ,k . Being w unknown, all possible paths should be considered and,
t =1
consequently, the probability to observe the sequence s is P ( s | λ ) = ∑ P ( s, w | λ ) . The
w
procedure to evaluate s is computationally expensive, even for simple applications. To solve
this problem, the forward-backward algorithm was proposed (Baum and Egon 1967; Baum
1972). This algorithm reduces the number of paths to be considered and, consequently, the
probability of sequence s can be determined. Once the sequence is fixed, the next step is to
detect the most probable state sequence that generated it. This issue can be efficiently
solved by using the Viterbi algorithm (Viterbi 1967).
In conclusion, an important shortcoming of the methods based on HMMC is that all of them
require a very long computation time.
Outline of the thesis
The overall aim of this thesis is to propose some alternative approaches to evaluate the
genomic breeding value of animals involved in genomic selection programs. Moreover, a new
Massimo Cellesi
Statistical Tools for Genomic-Wide Studies
Tesi di Dottorato in Scienze dei Sistemi Agrari e Forestali e delle Produzioni Alimentari
Scienze e Tecnologie Zootecniche – Università degli Studi di Sassari
25
method to develop genome wide association studies is proposed. This new method was also
used to reduce the dimensionality of the SNP data. These selected SNPs were then used to
estimate the breeding values.
Massimo Cellesi
Statistical Tools for Genomic-Wide Studies
Tesi di Dottorato in Scienze dei Sistemi Agrari e Forestali e delle Produzioni Alimentari
Scienze e Tecnologie Zootecniche – Università degli Studi di Sassari
26
References
•
Aulchenko YS, de Koning J, Haley C (2007) Genomewide rapid association using mixed
model and regression: a fast and simple method for genomewide pedigree–based
quantitative trait loci association analysis. Genetics, 177: 577–585.
•
Balding DL (2006) A tutorial on statistical methods for population association studies.
Nature Reviews Genetics, 7: 781–79
•
Baum L (1972) An equality and associated maximization technique in statistical
estimation for probabilistic functions of Markov processes. Inequalities, 3: 1–8.
•
Baum L, Egon JA (1967) An equality with applications to statistical estimation for
probabilistic functions of a markov process and to a model of ecology. B Am Math
Soc, 73: 360–363.
•
Browning BL, Browning SR (2009) A unified approach to genotype imputation and
haplotype–phase inference for large data sets of trios and unrelated individuals. Am J
Hum Genet, 84: 210–23.
•
Calus MPL (2009) Genomic breeding value prediction: methods and procedures.
Animal, 4: 157–164.
•
Chamberlain AJ, Hayes BJ, Savin K, Bolormaa S, McPartlan HC, Bowman PJ, Van Der
Jagt C, MacEachern S, Goddard ME (2012) Validation of single nucleotide
polymorphisms associated with milk production traits in dairy cattle. J Dairy Sci, 95:
864–875.
•
Churchill GA, Doerg RW (1994) Empirical threshold values for quantitative trait
mapping. Genetics, 138: 963–971.
•
•
Cordell HJ (2009) Detecting gene–gene interactions that underlie human diseases.
Nat Rev Genet, 10: 392–404.
Daetwyler DH, Pong–Wong R, Villaneuva B, Woolliams JA (2010) The impact of
genetic architecture on Genome–Wide evaluation methods. Genetics, 185: 1021–
1031.
Massimo Cellesi
Statistical Tools for Genomic-Wide Studies
Tesi di Dottorato in Scienze dei Sistemi Agrari e Forestali e delle Produzioni Alimentari
Scienze e Tecnologie Zootecniche – Università degli Studi di Sassari
27
•
Darwin CR (1869) On the origin of species by means of natural selection, or the
preservation of favoured races in the struggle for life. London: John Murray.
•
de Los Campos G, Gianola D, Allison DB (2010) Predicting genetic predisposition in
humans: The promise of whole–genome markers. Nat Rev Genet, 11: 880–886
•
Druet T, Schrooten C, de Roos APW (2010): Imputation of genotypes from different
single nucleotide polymorphism panels in dairy cattle. J Dairy Sci, 93: 5443–5454.
•
Fairfull RW, McMillan I, Muir WM (1998) Poultry Breeding: Progress and prospects for
genetic improvement of egg and meat production. In Proceedings of the 6th World
Congress on Genetics Applied to Livestock Production–WCGALP, Armidale, Australia,
pp. 271–278.
•
Fernando RL, Grossman M (1989) Marker assisted selection using best linear unbiased
prediction. Genet Sel Evol, 21: 467–477.
•
Fisher R (1918) The correlation between relatives on the supposition of Mendelian
inheritance. Trans Roy Soc Edin, 52: 399–433.
•
Georges M, Nielsen D, Mackinnon M et al. (1995) Mapping Quantitative Trait Loci
Controlling Milk Production in Dairy Cattle by Exploiting Progeny Testing. Genetics,
139: 907–920.
•
Gilmour AR, Gogel BJ, Cullis BR, Thompson R (2009). ASReml user guide release 3.0.
VSN International Ltd, Hemel Hempstead, UK.
•
Goddard ME and Hayes BJ (2009) Mapping genes for complex traits in domestic
animals and their use in breeding programmes. Nat Rev Genet, 10: 381–391.
•
Habier D, Fernando RL, Dekkers JCM (2007) The impact of genetic relationship
information on genome–assisted breeding values. Genetics, 177: 2389–239.
•
Hayes BJ, Bowman PJ, Chamberlain AJ, Goddard ME (2009): Genomic selection in
dairy cattle: progress and challenges. J Dairy Sci, 92: 433–443.
•
Hayes BJ, Daetwyler H (2013) Genomic Selection in the era of Genome sequencing.
Piacenza, Italy.
Massimo Cellesi
Statistical Tools for Genomic-Wide Studies
Tesi di Dottorato in Scienze dei Sistemi Agrari e Forestali e delle Produzioni Alimentari
Scienze e Tecnologie Zootecniche – Università degli Studi di Sassari
28
•
Hayes BJ, Goddard M.E. (2001) The distribution of the effects of genes affecting
quantitative traits in livestock. Genet Sel Evol, 33: 209–29.
•
Hazel LN (1943) The genetic basis for constructing selection index. Genetics 28: 476–
490.
•
Henderson CR (1975) Rapid method for computing inverse of a relationship matrix. J
Dairy Sci, 58: 1727–1730.
•
Howie B, Marchini J, Stephens M (2011) Genotype Imputation with Thousands of
Genomes. G3 (Bethesda), 1: 457–470.
•
Howie BN, Donnelly P, Marchini J (2009) A flexible and accurate genotype imputation
method for the next generation of genome–wide association studies. PLoS Genet, 5:
e1000529.
•
Lande R, Thompson R (1990) Efficiency of marker–assisted selection in the
improvement of quantitative traits. Genetics, 124: 743–756.
•
Lehermeier C, Wimmer V, Albrecht T, Auinger HJ, Gianola D, Schmid VJ, Schön CC
(2013). Sensitivity to prior specification in Bayesian genome–based prediction models.
Stat Appl Genet Mol Biol, 1–17.
•
Lush JL (1931) The number of daughters necessary to prove a sire. J Dairy Sci, 14:
209–220.
•
Ma L, Wiggans GR, Wang S, Sonstegard TS, Yang J et al. (2012) Effect of sample
stratification on dairy GWAS results. BMC Genomics, 13: 536.
•
Marchini J, Howie B (2010) Genotype imputation for genome–wide association
studies. Nat Rev Genet, 11: 499–511.
•
Meuwissen THE, Goddard ME (1996) The use of marker haplotypes in animal
breeding scheme. Genet Sel Evol, 28: 161–176.
•
Meuwissen THE, Hayes BJ, Goddard ME (2001) Prediction of total genetic value using
genome–wide dense marker maps. Genetics, 157: 1819–1829.
Massimo Cellesi
Statistical Tools for Genomic-Wide Studies
Tesi di Dottorato in Scienze dei Sistemi Agrari e Forestali e delle Produzioni Alimentari
Scienze e Tecnologie Zootecniche – Università degli Studi di Sassari
29
•
Moser G, Khatkar MS, Hayes BJ, Raadsma HW (2010) Accuracy of direct genomic
values in Holstein bulls and cows using subsets of SNP markers. Genet Sel Evol, 42:
37.
•
Pryce JE, Bolormaa S, Chamberlain AJ, Bowman PJ, Savin K, Goddard ME, Hayes BJ
(2010) A validated genome–wide association study in 2 dairy cattle breeds for milk
production and fertility traits using variable length haplotypes. J Dairy Sci, 93: 3331–
45.
•
Rabiner LR (1989). A tutorial on hidden Markov models and selected applications in
speech recognition. Proc IEEE Inst Electr Electon Eng, 77: 257–286.
•
Ron M, Weller JI (2007) From QTL to QTN identification in livestock –winning by
points rather than knock–out: a review. Anim Genet, 38: 429–439.
•
Scheet P, Stephens M (2006) A fast and flexible statistical model for large–scale
population genotype data: Applications to inferring missing genotypes and haplotypic
phase. Am J Hum Genet, 78: 629–44.
•
Schopen GCB, Visker MHPW, Koks PD, Mullaart E, van Aredonk JAM, Bovenhuis H
(2011): Whole–genome association study for milk protein composition in dairy cattle.
J Dairy Sci, 94: 3148–3158.
•
Shepherd R, Meuwissen T, Woolliams J (2010). Genomic selection and complex trait
prediction using a fast EM algorithm applied to genome–wide markers. BMC
Bioinformatics, 11: 529.
•
Stephens M, Balding DJ (2009). Bayesian statistical methods for genetic association
studies. Nat Rev Genet, 10: 681–690.
•
Stranger BE, Stahl EA, Raj T (2011) Progress and promise of genome–wide association
studies for human complex trait genetics. Genetics, 187: 367–383.
•
Ter Braak CJF, Boer MP, Bink MCAM (2005) Extending Xu's Bayesian model for
estimating polygenic effects using markers of the entire genome. Genetics, 170:
1435–1438.
Massimo Cellesi
Statistical Tools for Genomic-Wide Studies
Tesi di Dottorato in Scienze dei Sistemi Agrari e Forestali e delle Produzioni Alimentari
Scienze e Tecnologie Zootecniche – Università degli Studi di Sassari
30
•
Van Raden PM (2008) Efficient Methods to Compute Genomic Predictions. J Dairy Sci,
91: 4414–4423.
•
Van Raden PM, Van Tassell CP, Wiggans GR, Sonstengard TS, Schnabel RD, Taylor JF,
Schenkel FS (2009) Invited review: reliability of genomic predictions for North
American Holstein bulls. J Dairy Sci, 92: 4414–4423.
•
Viterbi A. (1967) Error bounds for convolutional codes and an asymptotically
optimum decoding algorithm. IEEE T Inform Theory, 13: 260–269.
•
Weller JL, Kashi Y, Soller M (1990) Power of daughter and granddaughter designs for
determining linkage between marker loci and quantitative trait loci in dairy cattle. J
Dairy Sci, 73: 2525–2537.
•
Wiener P, Edriss MA, Williams JL, Waddington D, Law A, Woolliams JA, Gutiérrez–Gil B
(2011) Information content in genome–wide scans: concordance between patterns of
genetic differentiation and linkage mapping associations. BMC Genomics, 12: 65.
•
Xu S (2003a) Estimating polygenic effects using markers of the entire genome.
Genetics 163:789–801.
•
Xu S (2003b) Theoretical Basis of the Beavis Effect. Genetics, 165: 2259–2268.
•
Yi N, Xu S (2008) Bayesian LASSO for quantitative trait loci mapping. Genetics, 179:
1045–1055.
•
Yu J, Pressoir G, Briggs WH, Vroh Bi I, Yamasaki M, Doebley JF, McMullen MD, Gaut
BS, Nielsen DM, Holland JB, Kresovich S, Buckler ES. (2006). A unified mixed–model
method for association mapping that accounts for multiple levels of relatedness. Nat
Genet, 38: 203–208.
Massimo Cellesi
Statistical Tools for Genomic-Wide Studies
Tesi di Dottorato in Scienze dei Sistemi Agrari e Forestali e delle Produzioni Alimentari
Scienze e Tecnologie Zootecniche – Università degli Studi di Sassari
Chapter 2
The impact of the rank of marker variancecovariance matrix in principal component
evaluation for genomic selection applications
Corrado Dimauro, Massimo Cellesi, Maria Annunziata Pintus, Nicolò P.P. Macciotta
Dipartimento di Scienze Zootecniche, Università di Sassari, via De Nicola 9, 07100 Sassari, Italy
Published in Journal of Animal Breeding and Genetics (2011) 128: 440-445.
Statistical Tools for Genomic-Wide Studies
Tesi di Dottorato in Scienze dei Sistemi Agrari e Forestali e delle Produzioni Alimentari
Scienze e Tecnologie Zootecniche – Università degli Studi di Sassari
Massimo Cellesi
32
Summary
In genomic selection (GS) programs, direct genomic values (DGV) are evaluated by using
information provided by high-density SNP chip. Being DGV accuracy strictly dependent on
SNP density, it is likely that an increase of the number of markers per chip will result in
severe computational consequences. Aim of present work was to test the effectiveness of
principal component analysis (PCA) carried out by chromosome in reducing the marker
dimensionality for GS purposes. A simulated data set of 5,700 individuals with an equal
number of SNP distributed over 6 chromosomes was used. PCs were extracted both genomewide (ALL) and separately by chromosome (CHR) and used to predict DGVs. In the ALL
scenario, the SNP variance-covariance matrix (S) was singular, positive semi-definite and
contained null information which introduces ‘spuriousness’ in the derived results. On the
contrary, the S matrix for each chromosome (CHR scenario) had a full rank. Obtained DGV
accuracies were always better for CHR than ALL. Moreover, in the latter scenario DGV
accuracies became soon unsettled as the number of animals decreases whereas, in CHR, they
remain stable till 900-1,000 individuals. In real applications where a 54K SNP chip is used, the
largest number of markers per chromosome is about 2,500. Thus a number of around 3,000
genotyped animals could lead to reliable results when the original SNP-variables are replaced
by a reduced number of PCs.
Introduction
In the last decade, several countries have developed breeding programs based on genomic
selection (GS). In this approach, the genetic merit of an animal is assessed by using marker
information provided by dense SNP platforms (Fernando et al. 2007). The BovineSNP50
BeadChip (Illumina Inc., San Diego, CA), which contains 54K SNP-markers, has been the most
used platform in bovine genomic studies. It is likely that SNP chip density will be further
enlarged in the very next future, being direct genomic value (DGV) accuracy strictly
Massimo Cellesi
Statistical Tools for Genomic-Wide Studies
Tesi di Dottorato in Scienze dei Sistemi Agrari e Forestali e delle Produzioni Alimentari
Scienze e Tecnologie Zootecniche – Università degli Studi di Sassari
33
dependent on SNP density (Solberg et al. 2008). Recently, a 777K SNP platform has been
made available (Illumina Inc., San Diego, CA) for bovine genotyping. In human genetics, for
example, over one million SNPs are usually typed per individual (Hinds et al. 2005; The
International Hapmap Consortium 2005). However, expertise is hardly transferable to
animals being genomic information, in human genetics, mainly used for association studies.
In genomic selection, the primary aim of animal genotyping is the estimation of DGV which is
highly computational demanding. Moreover, being DGV accuracy strictly dependent on the
number of animals with genotypes and phenotypes available (i.e. size of the reference
population), a large number of individuals has to be genotyped, thus increasing the amount
of data to be processed. As an example, a data matrix (X) of nearly 4 billion columns is
generated if 5,000 animals are genotyped with the 777K chip. Such amount of records is very
difficult to handle and the use of complex algorithms such as BLUP, Bayes A (Meuwissen et
al. 2001) or LASSO (Park & Casella 2008) requires a huge computational capacity. Therefore,
the search for methods able to reduce the dimension of the X matrix represents a priority.
With this aim, Vazquez et al. (2011) proposed to select relevant SNP by single marker
regression on phenotypes. However, results on actual data highlight a reduction of DGV
accuracy when a number of SNP are deleted. Moreover, being SNP selection based on their
relevance on the analyzed phenotype, specific sets of SNP should be needed for different
traits (Habier et al. 2009).
Actually, the deletion of some columns in the data matrix X should be avoided, considering
the great economic effort for genotyping a large number of animals with the highest marker
density available. A more rational approach should summarize information contained on the
whole SNP panel in a smaller set of new variables. This is the case of the principal component
analysis (PCA) (Hotelling 1933). This technique removes any redundancy in the original data
by searching for a new set of mutually orthogonal variables (the principal components, PC),
each accounting for decreasing amount of variance in the data. PCA has been used to analyze
human genetic patterns (Cavalli Sforza & Feldman 2003; Paschou et al. 2007). Recently,
Lewis et al. (2011) applied PCA to a genomic dataset (30,000 SNP) generated in a study
Massimo Cellesi
Statistical Tools for Genomic-Wide Studies
Tesi di Dottorato in Scienze dei Sistemi Agrari e Forestali e delle Produzioni Alimentari
Scienze e Tecnologie Zootecniche – Università degli Studi di Sassari
34
involving 19 breeds (13 taurine, three zebu, and three hybrid breeds). Authors demonstrated
that 250-500 carefully selected SNP are sufficient to trace the breed of unknown cattle
samples. In GS simulated experiments, PCA has been used to reduce the dimension of the
SNP data matrix for DGV prediction (Macciotta et al., 2010; Solberg et al., 2009), obtaining
similar accuracies when either SNPs or PCs were used as predictors. These results indicate
that PCA can be considered a suitable tool to reduce the number of SNP variables in GS
programs.
Aim of this work was to demonstrate, both in theory and in practice, that a proper use of PCA
may be effective in reducing the marker dimensionality for GS purposes.
The Principal Component Analysis
PCA is a statistical procedure that transforms a number of (possibly) correlated variables into
an equal number of uncorrelated variables called PCs. The objective of PCA is to redistribute
the original variability of data. Thus, the first principal component accounts for as much as
possible of original variability in the data, and all components are extracted in order to
maximize successively the amount of variance explained (Morrison 1976; Krzanowsky 2003).
In other words, to summarize information contained in the starting m-dimensional space (the
m SNP-variables), original directions are rotated into a new m-dimensional space. The new
m-directions are the principal components where the jth PC is represented by a linear
combination of the observed variables Xm:
PC=
v1 j X 1 + ... + vmj X m
j
with j=1,……,m. The vmj weights are the components of the eigenvectors extracted from the
variance-covariance (correlation) matrix (S) in a so called “eigenvalue problem”. The S matrix
is symmetric and positively semi-definite. It has on the diagonal the variances of each mvariable and off diagonal the covariance between variables. The trace of S (trS) represents
Massimo Cellesi
Statistical Tools for Genomic-Wide Studies
Tesi di Dottorato in Scienze dei Sistemi Agrari e Forestali e delle Produzioni Alimentari
Scienze e Tecnologie Zootecniche – Università degli Studi di Sassari
35
the total variance of the multivariate system. The eigenvalue problem applied to S gives the
following results:
i) m eigenvalues, λ1> λ2>………> λm ≥0, such as
m
∑λ
i
i
= trS .
ii) a set of m vectors (eigenvectors), one for each eigenvalue. These vectors are mutually
orthogonal and their components are the weights vmj used to compose the PCs. These
vectors constitute the matrix V of the eigenvectors.
The first eigenvalue is greater than the second, the second is greater of the third and so on.
The proportion of the total variance accounted by the ith component (varexpl) can be
empirically evaluated as:
varexpl =
λi
trS
Finally, the matrix P whose columns are the new variables, can be calculated as:
P= X ⋅ V
whose dimension is (nxm).
One crucial step of PCA concerns the choice of the number of PCs to be retained. Several
methods have been proposed (see Jolliffe, 2002, for a review of the most frequently used
criteria). The simplest is to retain a number of p components (p<m) until the cumulative
variance explained reach a fixed value. Generally this value is fixed at around 80 – 85% of the
total variance.
The rank of the genomic variance-covariance S matrix and its effect on PC
extraction
The rank (ρ) of a matrix is defined as the maximum number of independent rows (or
columns). For a rectangular matrix Anxm, ρ is minor or equal to the minimum value between n
and m, i.e. ρ ≤ min(n; m) (Bumb 1982; Patterson et al. 2006). In the case of the data matrix
Massimo Cellesi
Statistical Tools for Genomic-Wide Studies
Tesi di Dottorato in Scienze dei Sistemi Agrari e Forestali e delle Produzioni Alimentari
Scienze e Tecnologie Zootecniche – Università degli Studi di Sassari
36
Xnxm, being n<<m, ρx ≤ n. Therefore, its variance-covariance square matrix S has dimension
mxm but not full rank (ρS ≤ n-1). As a consequence, it has one or more eigenvalues equal to
zero.
Let we consider a real situation where X has n=4k rows and m=50k columns. The extraction
of principal components starts from a S matrix with dimension 50k × 50k and rank
ρ S ≤ 4k − 1 . In the best situation, only 4k-1 eigenvalues are greater than zero, and therefore,
the maximum number of non-redundant PCs is 4k-1. The remaining PCs are directions along
which the observations do not have components. The total variability, originally distributed
over 50k variables, has been compressed in 4k-1 directions, being
4 k −1
∑λ
1
i
= trS . This result is
a non-sense because, being the PCs new axes obtained by rotation, their number should be
equal to the original axes. Moreover, the number of PCs is further reduced if a threshold of
85% of the total variance explained is considered.
The same problem has been raised by Bumb (1982) for factor analysis, another dimensionreduction multivariate technique. The author observed “spurious” results, i.e. characterized
by a random variability, when the number of variables exceeds the number of observations.
The S rank issue is particularly relevant in genomic selection due to the huge number of
columns in the SNP data matrix. The extraction of PCs by chromosome instead of genomewide could represent a possible strategy to deal with this problem. The approach is
supported by the substantial biological orthogonality between chromosomes. Moreover, as
stated in the previous section, the number of markers per chromosome is lower than 2,500
in the commercial 54K SNP platform. The current size of reference populations in genomic
projects often exceeds 3,000 individuals. Therefore, both X and S matrices evaluated by
chromosome (XCHR and SCHR) could have a full rank and the related PCs would not lead to
spurious results.
Massimo Cellesi
Statistical Tools for Genomic-Wide Studies
Tesi di Dottorato in Scienze dei Sistemi Agrari e Forestali e delle Produzioni Alimentari
Scienze e Tecnologie Zootecniche – Università degli Studi di Sassari
37
A simulation study
Materials
Data were extracted from an archive generated for the XII QTLs – MAS workshop, freely
available at: http://www.computationalgenetics.se/QTLMAS08/QTLMAS/DATA.html. Briefly,
a genome of six chromosomes with 6,000 biallelic evenly spaced SNP was generated. A total
of 300 SNP were deleted: 75 monomorphic, and 225 with MAF lower than 10%. A number of
animals (5,700) equal to the retained SNP was considered: 5,600 of reference (REF), and the
remaining 100 younger individuals as prediction population (PRED). All animals had
phenotypes available. For complete details on the data generation see Lund et al. (2009).
Methods
Effects of SNP markers on phenotypes in the REF population were estimated by using a BLUP
mixed linear model that included either the fixed effects of mean, sex and generation, and
the random effect of principal component scores (Meuwissen et al. 2001). The overall mean
and the estimated effects of PC scores were then used to predict DGV in PRED population
(for more details on DGV evaluation see Macciotta et al. 2010). Accuracy of DGV prediction
was evaluated by calculating Pearson correlations between DGV and true breeding value
(TBV) in PRED animals.
Two scenarios were simulated. PCs were extracted on all SNP simultaneously (ALL) or
separately by chromosome (CHR). Different sizes of REF population and number of extracted
PCs (corresponding to different percentages of the total variance explained) were tested for
each scenario. In particular, the size of REF was fixed at 5,700, 3,000, 1,000, 900, 800, 500,
400, and 300 animals. Variance retained by PCs ranged from 60% to 95% by a step of 5%.
Massimo Cellesi
Statistical Tools for Genomic-Wide Studies
Tesi di Dottorato in Scienze dei Sistemi Agrari e Forestali e delle Produzioni Alimentari
Scienze e Tecnologie Zootecniche – Università degli Studi di Sassari
38
Results and discussion
The ability of PCA in reducing the space of the 5,700 SNP-variables can be seen in Figure 1,
where the first 2,000 PCs are displayed. In particular, the percentage of explained variance is
around 85% and 95% when 300 or 700 PCs are retained, respectively. Thus the information
contained in around 6k markers can be summarized in a small number of PCs (5 or 12% of the
total PCs).
1
% of explained variance
0,8
0,6
0,4
0,2
0
0
500
1000
1500
2000
Principal Components
Figure 1 Pattern of the cumulative variance explained as the number of retained principal components increases
Table 1 displays the number of retained PCs for increasing amounts of explained variance
and for different sizes of the REF population, both for CHR and ALL approaches. As expected,
the number of extracted PCs decreases together with the population size in each scenario.
For example, when the REF size reduces from 5,700 to 1,000 individuals and 85% of variance
explained is considered, the reduction in predictor dimensionality obtained by PC extraction
is equal to 37% and 13% for ALL and CHR scenarios, respectively. These results highlight that
in PCA the total variance is compressed in a smaller space when the number of observations
is lower than the number of variables (as in ALL). On the other hand, in the CHR scenario the
correct number of PCs is retained till the number of individuals exceeds the maximum
number of SNP per chromosome (i.e. 1,000). Therefore, in a real situation where animals are
genotyped with the 54K chip the number of retained PCs, for 85% of variance accounted, is
Massimo Cellesi
Statistical Tools for Genomic-Wide Studies
Tesi di Dottorato in Scienze dei Sistemi Agrari e Forestali e delle Produzioni Alimentari
Scienze e Tecnologie Zootecniche – Università degli Studi di Sassari
39
likely to be around 3,000-3,500. Such a number of variables can be easily managed with any
personal computer and the computational time for DGV evaluation reduces to few minutes.
Table 1 Number of retained principal components in genome-wide (ALL) and by chromosome (CHR) scenarios
both for original variance explained and the number of involved animals’ reduction
Variance
explained (%)
50
55
60
65
70
75
80
85
90
95
Number of animals
5700
1000
800
500
300
CHR ALL CHR ALL CHR ALL CHR ALL CHR ALL
95
64
89
42
89
41
84
34
84
34
116
80
107
52
107
51
101
43
98
41
140
99
130
65
128
62
121
53
117
50
169 123 155
80
153
77
144
64
140
61
205 152 186
98
184
95
174
79
170
74
251 190 225 122 222 118 210
97
205
90
312 240 277 153 272 148 257 120 250 109
400 313 350 196 344 190 323 150 313 135
542 430 466 263 455 253 429 193 409 170
831 670 696 383 677 366 630 261 589 224
Figure 2 displays DGV accuracies for decreasing sizes of REF population and for different
amounts of accounted variance. Values are in agreement with reports on simulated and real
data (Van Raden et al., 2009). The starting point of simulation is when both SALL and SCHR have
full rank (figure 2a), i.e. when the number of animals is approximately equal to the number of
SNP. In particular, DGV accuracies show a regular rising pattern both for ALL and CHR, with
higher values for the latter scenario. This result is probably due both to mathematical and
“biological” reasons. For a fixed amount of explained variance, the number of components
extracted by chromosome is greater than those obtained genome-wide. This result seems to
indicate a redundant PC calculation in CHR, because PCA is more efficient when the same
amount of variance is accounted by a smaller number of new variables. As a consequence,
higher DGV accuracies for ALL compared to CHR should be expected. However, results
reported on figures 1 highlight a similar behavior of the two methods. Thus the substantial
chromosome orthogonality allows, in the CHR approach, for a correct assessment of PCs
Massimo Cellesi
Statistical Tools for Genomic-Wide Studies
Tesi di Dottorato in Scienze dei Sistemi Agrari e Forestali e delle Produzioni Alimentari
Scienze e Tecnologie Zootecniche – Università degli Studi di Sassari
40
number. Moreover, it can be seen that CHR outperforms ALL for low percentages of retained
variance. The gap between the two scenarios reduces when variance is > 95% or more, i.e.
when almost all the total variance is accounted for.
5,700 animals
a
1
DGV accuracies
DGV accuracies
3,000 animals
b
1
0,9
0,8
0,7
0,6
0,9
0,8
0,7
0,6
60
70
80
90
100
60
% of explained variance
CHR
CHR
ALL
90
100
ALL
900 animals
d
1
DGV accuracies
1
DGV accuracies
80
% of explained variance
1,000 animals
c
70
0,9
0,8
0,7
0,6
0,9
0,8
0,7
0,6
60
70
80
90
100
60
% of explained variance
CHR
ALL
70
80
90
100
% of explained variance
CHR
ALL
Figure 2 Accuracies of direct genomic value (DGV) for increasing values of variance explained and decreasing
number of animals in training population
Massimo Cellesi
Statistical Tools for Genomic-Wide Studies
Tesi di Dottorato in Scienze dei Sistemi Agrari e Forestali e delle Produzioni Alimentari
Scienze e Tecnologie Zootecniche – Università degli Studi di Sassari
41
a
b
800 animals
500 animals
0,9
DGV accuracies
DGV accuracies
0,9
0,8
0,7
0,6
0,5
0,8
0,7
0,6
0,5
60
70
80
90
100
60
% of explained variance
CHR
c
80
90
100
% of explained variance
ALL
CHR
d
400 animals
ALL
300 animals
0,9
DGV accuracies
0,9
DGV accuracies
70
0,8
0,7
0,6
0,8
0,7
0,6
0,5
0,4
0,5
0,3
60
70
80
90
100
60
% of explained variance
CHR
ALL
70
80
90
100
% of explained variance
CHR
ALL
Figure 3 Accuracies of direct genomic value (DGV) for increasing values of variance explained and decreasing
number of animals in training population
Differences between accuracies obtained in the two approaches tend to increase as the
number of animals decreases (figure 2). Moreover, the pattern becomes more irregular for
ALL. These figures are in agreement with other studies that observed spurious results when
the rank of S is markedly smaller than its dimension (Bumb 1982). Figure 3 clearly displays
this effect highlighting that also CHR pattern tends to be irregular for a REF size lower than
1,000 animals. Starting from figure 3a, the behavior became more unpredictable with a
random loss of accuracy (Figure 3b) when 75% of variance is explained by PCs. However,
Massimo Cellesi
Statistical Tools for Genomic-Wide Studies
Tesi di Dottorato in Scienze dei Sistemi Agrari e Forestali e delle Produzioni Alimentari
Scienze e Tecnologie Zootecniche – Università degli Studi di Sassari
42
both figure 2 and 3 shows that DGV accuracies in CHR are always higher than ALL for an
accounted variance greater than 80-85%. Such a value could be used as a criterion for
retaining PC extracted chromosome-wide in an implementation of the PC approach on real
genomic data. Moreover, for these values of variance, DGV accuracies range from 90 to 80%
until the SCHR has a full rank (1,000 animals, in our simulation). On the other hand, they
decrease till around 70% (figure 2d) for a REF size of 300. Thus a number of animals greater
than the number of SNP per chromosome should be used to obtain good accuracies.
Conclusions
With the recent development of high-density marker chips that are routinely used in
genomic selection programs, the need for reducing predictor dimensionality is of primary
importance. The principal component analysis can represent a useful tool for summarizing
and reallocating the overall information contained in the SNP data. A proper use of the
technique requires a full rank S matrix to produce reliable results. This is a relevant issue in
genomic analysis where the number of variables always exceeds the number of genotyped
animals. According to the results of the present work, such an issue can be addressed by
extracting PCs separately by chromosome, i.e. by using this technique on a series of full rank
SCHR matrices. Better accuracies of DGVs have been obtained when PCs are extracted by
chromosome instead of genome-wide, even with both SALL and SCHR at full rank. In the
Illumina 54K chip the largest number of markers per chromosoma, about 2,500, is located on
BTA1. Thus a number around 3,000 genotyped animals could lead to reliable results when
the original SNP-variables are replaced by a reduced number of PCs. Results of the present
work, although obtained with a genome size and number of markers different from the
conditions found on field data, seems to be rather realistic. The recently released Bovine3k
genotyping BeadChip is finding a large use in genomic selection programs. Thus in the very
next future several animals will have genotypes available with this marker density.
Massimo Cellesi
Statistical Tools for Genomic-Wide Studies
Tesi di Dottorato in Scienze dei Sistemi Agrari e Forestali e delle Produzioni Alimentari
Scienze e Tecnologie Zootecniche – Università degli Studi di Sassari
43
References
•
Bumb B (1982) Factor analysis and development. J Dev Econ, 11: 109–112.
•
Cavalli–Sforza LL, Feldman MW (2003) The application of molecular genetic
approaches to the study of human evolution. Nat Genet, 33: 266–275.
•
Fernando RL, Habier D, Stricker C, Dekkers JCM, Totier LR (2007) Genomic selection.
Acta Agric Scand A, 57: 192–195.
•
Habier D, Fernando RL, Dekkers JCM (2009) Genomic selection using low–density
marker panels. Genetics, 182: 343–353.
•
Hinds DA, Stuve LL, Nilsen GB, Halperin E, Eskin E, Ballinger DG, Frazer KA, Cox DR
(2005) Whole–genome patterns of common DNA variation in three human
populations. Science, 307: 1072–1079.
•
Hotelling H (1933). Analysis of a complex of statistical variables into principal
components. J Educational Psych, 24: 417–441.
•
Jolliffe L (2002) Principal component analysis. Second ed. Springer, Berlin.
•
Krzanowsky WJ (2003) Principles of Multivariate Analysis. Oxford University Press Inc.,
New York, NY.
•
Lewis J, Abas Z, Dadousis C, Lykidis D, Paschou P, Drineas P (2011) Tracing cattle
breeds with principal components analysis ancestry informative SNPs. Plos One, 6:
e18007
•
Lund MS, Sahana G, de Koning DJ, Su G, Carlborg Ö (2009) Comparison of analyses of
QTLMAS XII common dataset. I: Genomic selection. BMC Proc 3(Suppl. 1), S1.
•
Macciotta NPP, Gaspa G, Steri R, Nicolazzi EL, Dimauro C, Pieramati C, Cappio–Borlino
A (2010) Using eigenvalues as variance priors in the prediction of genomic breeding
values by principal component analysis. J Dairy Sci, 93: 2765–2774.
•
Meuwissen THE., Hayes BJ, Goddard ME (2001) Prediction of total genetic values
using genome–wide dense marker maps. Genetics, 157: 1819–1829.
Massimo Cellesi
Statistical Tools for Genomic-Wide Studies
Tesi di Dottorato in Scienze dei Sistemi Agrari e Forestali e delle Produzioni Alimentari
Scienze e Tecnologie Zootecniche – Università degli Studi di Sassari
44
•
Morrison F (1976) Multivariate Statistical Methods. McGraw–Hill, New York, NY.
•
Park T, Casella G (2008) The Bayesian Lasso. J Am Stat Assoc, 103: 681–686.
•
Paschou P, Ziv E, Burchard EG, Choudry S, Rodriguez–Cintron W, Mahoney MW,
Drineas P (2007) PCA–correlated SNPs for structure identification in worldwide
human populations. Plos Genet, 3: 1672–1686.
•
Patterson N, Price AL, Reich D (2006) Population structure and eigenanalysis. Plos
Genet, 2: 2074–2093.
•
Solberg TR, Sonesson AK, Woolliams JA, Meuwissen THE (2008) Genomic selection
using different marker types and densities. J Anim Sci, 86: 2447–2454.
•
Solberg TR, Sonesson AK, Woolliams JA, Meuwissen THE (2009) Reducing
dimensionality for prediction of genome–wide breeding values. Genet Sel Evol, 41: 29
•
The International HapMap Consortium (2005) A haplotype map of the human
genome. Nature, 437: 1299–1320.
•
Van Raden PM, Van Tassell C P, Wiggans GR, Sonstengard TS, Schnabel RD, Taylor JF,
Schenkel FS (2009) Invited review: reliability of genomic predictions for North
American Holstein bulls. J Dairy Sci, 92: 4414–4423.
•
Vazquez AI, Rosa GJM, Weigel KA, de los Campos G, Gianola D, Allison DB (2011)
Predictive ability of subsets of single nucleotide polymorfisms with and without
parent average in US Holsteins. J Dairy Sci, 93: 5942–5949.
Massimo Cellesi
Statistical Tools for Genomic-Wide Studies
Tesi di Dottorato in Scienze dei Sistemi Agrari e Forestali e delle Produzioni Alimentari
Scienze e Tecnologie Zootecniche – Università degli Studi di Sassari
Chapter 3
Use of partial least squares regression to
impute SNP genotypes in Italian Cattle breeds
Corrado Dimauro1*, Massimo Cellesi1, Giustino Gaspa1, Paolo Ajmone-Marsan2, Roberto Steri3,
Gabriele Marras1 and Nicolò PP Macciotta1
1) Dipartimento di Agraria, Sezione Scienze Zootecniche, Università di Sassari, 07100 Sassari, Italy
2) Istituto di Zootecnica, Università Cattolica del Sacro Cuore, Piacenza 29100, Italy
3) Consiglio per la Ricerca e la Sperimentazione in Agricoltura, via Salaria 31, 00015, Monterotondo,
Italy
Published in Genetics Selection Evolution (2013), 45: 15.
Statistical Tools for Genomic-Wide Studies
Tesi di Dottorato in Scienze dei Sistemi Agrari e Forestali e delle Produzioni Alimentari
Scienze e Tecnologie Zootecniche – Università degli Studi di Sassari
Massimo Cellesi
46
Abstract
Background
The objective of the present study was to test the ability of the partial least squares
regression technique to impute genotypes from low density single nucleotide polymorphisms
(SNP) panels i.e. 3K or 7K to a high density panel with 50K SNP. No pedigree information was
used.
Methods
Data consisted of 2,093 Holstein, 749 Brown Swiss and 479 Simmental bulls genotyped with
the Illumina 50K Beadchip. First, a single-breed approach was applied by using only data from
Holstein animals. Then, to enlarge the training population, data from the three breeds were
combined and a multi-breed analysis was performed. Accuracies of genotypes imputed using
the partial least squares regression method were compared with those obtained by using the
Beagle software. The impact of genotype imputation on breeding value prediction was
evaluated for milk yield, fat content and protein content.
Results
In the single-breed approach, the accuracy of imputation using partial least squares
regression was around 90 and 94% for the 3K and 7K platforms, respectively; corresponding
accuracies obtained with Beagle were around 85% and 90%. Moreover, computing time
required by the partial least squares regression method was on average around 10 times
lower than computing time required by Beagle. Using the partial least squares regression
method in the multi-breed resulted in lower imputation accuracies than using single-breed
data. The impact of the SNP-genotype imputation on the accuracy of direct genomic
breeding values was small. The correlation between estimates of genetic merit obtained by
using imputed versus actual genotypes was around 0.96 for the 7K chip.
Massimo Cellesi
Statistical Tools for Genomic-Wide Studies
Tesi di Dottorato in Scienze dei Sistemi Agrari e Forestali e delle Produzioni Alimentari
Scienze e Tecnologie Zootecniche – Università degli Studi di Sassari
47
Conclusions
Results of the present work suggested that the partial least squares regression imputation
method could be useful to impute SNP genotypes when pedigree information is not
available.
Background
In genomic selection programs, the breeding value (GEBV) of an individual is assessed by
combining both genomic and traditional pedigree-based predictions. High-density marker
platforms (HDP) of different SNP (single nucleotide polymorphism) densities (50K and 777K)
are currently used to genotype bulls under selection (Hayes et al. 2009) and elite cows and to
test for marker-phenotype associations (Schopen et al. 2011, Chamberlain et al. 2012).
Genotyping costs are among the major constraints for large-scale implementation of
genomic selection in many breeds. However, the commercial availability of low density SNP
panels (LDP), such as the Illumina Bovine3K Genotyping BeadChip or the Illumina BovineLD
BeadChip, which contains around 7K markers (Boichard et al. 2012), has offered new
opportunities to increase the number of animals involved in selection programs. Genotypes
obtained from an LDP must be imputed to the 50K platform by using suitable algorithms.
Genotype imputation can also be useful when combining data sets that were generated using
different SNP chips (Druet et al. 2010).
Genotype imputation refers to in silico reconstruction of missing genotypes. Several
techniques have been proposed to routinely impute SNP genotypes. The following three
steps are common to all procedures: (1) a training population (TP) genotyped with an HDP is
created; (2) a prediction population (PP) is generated by using an LDP; and (3) a suitable
algorithm is used to impute missing SNPs in the PP.
On the basis of the information considered to infer missing marker genotypes, imputation
methods can be classified into three groups. The first relies on linkage and family information
Massimo Cellesi
Statistical Tools for Genomic-Wide Studies
Tesi di Dottorato in Scienze dei Sistemi Agrari e Forestali e delle Produzioni Alimentari
Scienze e Tecnologie Zootecniche – Università degli Studi di Sassari
48
(Daetwyler et al. 2011, Hickey et al. 2011)), the second uses linkage disequilibrium based on
population information (Scheet et al. 2006, Browning et al. 2009), and the third combines the
two former sources of information (Druet et al. 2010, Van Raden et al. 2011). Several factors
affect imputation accuracy. In particular, imputation accuracy strongly depends on the
number of individuals in the training population and on the marker density of the LDP (Druet
et al. 2010, Weigel et al. 2010a, Weigel et al. 2010a, Zhang et al. 2010b).
The impact of imputed genotypes on GEBV accuracies has been investigated. Results are
sometimes discordant or expressed in different ways. For example, Chen et al. (2011)
compared GEBV values obtained with actual and imputed data. Two computer programs,
Findhap (Van Raden et al. 2011) and Beagle (Browning et al. 2009), were used to impute SNP
genotypes from a 3K panel to a 50K panel. The loss of reliability in GEBV prediction by using
imputed data was around 6.5% and 2.6% with Findhap and Beagle, respectively. Recently,
Segelke et al. (2012) reported a reduction in reliability of genomic predictions, averaged over
12 traits, ranging from 5.3% to 1% for the 3K and 7K chips, respectively. Moser et al. (2010)
proposed the use of an LDP that included the highest ranked SNPs for a trait under study.
However, the gain in accuracy of GEBV obtained with the highest ranked SNP was only
slightly higher (5-6%) than the accuracy obtained with an equal number of evenly spaced
markers. Nevertheless, with this strategy, considering that a specific pool of markers is
required for each trait, the use of evenly spaced SNP seems to be preferable over choosing a
specific SNP set for each trait.
Several imputation algorithms have been proposed and implemented in freely available
software such as Beagle (Browning et al. 2009), DAGPHASE (Druet et al. 2010) and Findhap
(Van Raden et al. 2011). Chen et al. (2011) found Beagle to be the most accurate but at the
expense of longer computation time.
A method that uses the Partial Least Squares Regression (PLSR) technique to impute SNP
genotypes was proposed recently (Dimauro et al. 2011). It was tested on a simulated genome
consisting of 6000 SNPs equally distributed on six chromosomes and a data set of 5865
Massimo Cellesi
Statistical Tools for Genomic-Wide Studies
Tesi di Dottorato in Scienze dei Sistemi Agrari e Forestali e delle Produzioni Alimentari
Scienze e Tecnologie Zootecniche – Università degli Studi di Sassari
49
individuals (TP = 4665 and PP = 1200). The PLSR method yielded accuracies in marker
imputation ranging from 0.99 to 0.86 when 10% or 90% genotypes were imputed,
respectively. In the latter case, the accuracy of direct genomic values (DGV) dropped from
0.77 to 0.74. Furthermore, Dimauro et al. (2011) highlighted that, with a fixed percentage
(50%) of SNPs to be predicted, imputation accuracies slowly decreased from 98% with TP =
5000, to 87% with TP = 1000 and to 69% with TP = 600. PLSR requires only genotype data,
and other data, such as pedigree relationships, is not needed. Therefore, this approach could
be useful when the population structure is not known.
The aim of the present work was to test the PLSR imputation method on real data. In
particular, a scenario with a 50K genotyped TP and a PP genotyped using either the 3K or 7K
panel was simulated. Moreover, the ability of the PLSR method to predict SNP genotypes for
different bovine breeds and in a multi-breed approach was tested.
Methods
Data
Data consisted of SNP genotypes belonging to 2179 Italian Holstein bulls genotyped with the
Illumina 50K Beadchip (single-breed dataset). Only markers located on the 29 autosomes
were considered. Monomorphic SNPs and SNPs with more than 2.5% missing values were
discarded. No editing for minor allele frequency (MAF) was applied. A total of 43 427 SNPs
were retained and any missing genotypes for these SNPs were replaced by the most frequent
genotype at that locus. Data on a total of 86 bulls were discarded, of which 48 were
replicates or had inconsistent Mendelian inheritance information, and 38 had a low overall
call rate (lower than 95%).
To study the performance in a multi-breed sample, 749 Brown Swiss and 470 Simmental bulls
were also available. For the multi-breed data set, data from the three breeds were edited
Massimo Cellesi
Statistical Tools for Genomic-Wide Studies
Tesi di Dottorato in Scienze dei Sistemi Agrari e Forestali e delle Produzioni Alimentari
Scienze e Tecnologie Zootecniche – Università degli Studi di Sassari
50
together to obtain the same SNPs in all data sets. At the end of the editing procedure, 30 055
markers were retained.
Genotypes were coded according to the number of copies of a given SNP allele they carried,
i.e. 0 (homozygous for allele B), 1 (heterozygous) or 2 (homozygous for allele A). The
phenotypes available for all animals were polygenic estimated breeding values for milk yield,
protein and fat content. Animals were ranked according to their age: the oldest were
designed as TP with all genotypes considered known, whereas the youngest represented the
PP. For both the single and multi-breed approach, SNPs belonging to 3K and 7K LDP were
identified in the PP animals and all other genotypes were masked, thus mimicking the two
Illumina LDP.
The partial least squares regression imputation method
PLSR is a multivariate statistical covariance-based technique that is able to predict a response
matrix Y(n × p) from a predictor matrix X(n × m) and to describe the common structure of the two
matrices (Dimauro et al. 2011). In both X and Y, n represents the number of animals involved,
m is the number of SNPs in the LDP and p is the number of SNPs to be imputed. PLSR allows
for the identification of underlying variables (known as latent factors) which are linear
combinations of the explanatory variables X, that best model Y. Dimauro et al. (2011)
demonstrated that the accuracy of PLSR prediction increases with the number of latent
factors approaching the number of SNPs to be predicted (the columns of Y). The maximum
number of latent factors depends on the size of X, which has a lower number of columns
than Y. For this reason, in each run, the number of extracted latent factors was fixed to be
equal to the number of predictors (the number of columns of X). PLSR is a multivariate
statistical technique particularly useful in genomic studies in which a great number of
variables are involved. It can overcome the strong collinearity between SNP variables in X or
Y and, at the same time, maximize correlations between Y and X variables (Dimauro et al.
Massimo Cellesi
Statistical Tools for Genomic-Wide Studies
Tesi di Dottorato in Scienze dei Sistemi Agrari e Forestali e delle Produzioni Alimentari
Scienze e Tecnologie Zootecniche – Università degli Studi di Sassari
51
2011, Abdi 2003). A more detailed description of the PLSR imputation method can be found
in Dimauro et al. (2011).
In the present work, each chromosome was processed independently and data were
analyzed by using the PLS procedure of SAS® software (SAS® institute Inc., Cary, NC).
Datasets were organized in a multivariate manner, having SNPs as columns and animals as
rows. The 50K SNPs were divided into SNPs that have to be imputed (Y) and SNPs used as
predictors (X). In particular, X contained only SNPs belonging to the 3K or 7K LDP. For animals
in the PP, genotypes in Y were masked and constituted the SNPs to be predicted.
Genotype imputation from 3K (7K) LDP to the 50K SNP panel
The comparison of imputation performances from different publications is difficult due to the
many differences between studies. TP size and number of markers in LDP heavily affect the
accuracy of prediction. Moreover, the relationships between training and validation animals
have an impact on imputation accuracies (Dassonneville et al. 2011). So, before applying the
PLSR imputation method to our data, the method was tested on external data provided by
Daetwyler et al. (2011) who exploited the ChromoPhase program (Daetwyler et al. 2011) to
impute missing genotypes from low to high density SNP platforms. The data consisted of
1183 Holstein bulls genotyped with the Illumina 50K chip. Only the 2529 markers on
chromosome 1 were available. A PP genotyped with the 3K chip (182 SNP) was simulated by
masking the markers not present on the 3K chip. In particular, the PP was divided into nonfounders (112 individuals that have at least one genotyped parent) and founders (212
animals that do not have a genotyped parent) and imputation accuracies were evaluated for
both categories of animals. The PLSR method and Beagle (Browning et al. 2009) software
were used to impute SNP genotypes in the PP and results were compared with accuracies
obtained by Daetwyler et al. (2011). Population structure or pedigree was not used with
either method.
In our experimental data, PLSR was first applied to the Holstein breed. Animals were ranked
by age and divided in TP = 1993 (the older bulls) and PP = 100 (the younger) and both 3K and
Massimo Cellesi
Statistical Tools for Genomic-Wide Studies
Tesi di Dottorato in Scienze dei Sistemi Agrari e Forestali e delle Produzioni Alimentari
Scienze e Tecnologie Zootecniche – Università degli Studi di Sassari
52
7K scenarios were investigated. The Beagle software was applied to the same data. No
pedigree information was used for either PLSR or Beagle.
On simulated data, Dimauro et al. (2011) demonstrated that, for each chromosome, the PLSR
imputation accuracy improved as the number of variables contained in X increased. The
reason is that when many variables have to be predicted (the columns of the Y matrix), the
number of extracted latent factors should be large. The maximum number of possible latent
factors is, however, less or equal to the number of variables in X. So, for chromosomes with a
relatively low number of markers in X, a lower PLSR predictive ability is expected. This
hypothesis can be easily tested by comparing the imputation accuracies obtained in the 3K
and 7K scenarios. Moreover, a PLSR run using an X matrix obtained by combining SNPs
belonging to chromosomes 26, 27 and 28, was carried out to test for possible improvement
in genotype imputation accuracy when X is artificially enlarged.
Genotype imputation from 3K LDP to the 50K SNP panel for different breeds
The availability of a sufficiently large TP is a crucial factor for genotype imputation.
Therefore, it is interesting to investigate if a multi-breed TP could enhance the accuracy of
genotype predictions. Some authors (Kizilkaya et al. 2010, Pryce et al. 2011) reported a slight
advantage of using a multi-breed TP to evaluate the genetic merit of animals under selection.
However, Hayes et al. (2012) showed that, in sheep breeds, accuracy of imputation in singlebreed analyses was higher than accuracy of imputation in a multi-breed analysis. To test the
PLSR method in a multi-breed context, three groups of animals, one for each breed, were
selected. Each group contained 479 bulls (the size of the Simmental population) and was split
into a TP of 379 and a PP of 100 individuals. The imputation was first performed separately
for each single breed and then by combining the three groups, thus obtaining a multi-breed
dataset with TP = 1137 and PP = 300 bulls.
Evaluation of imputation accuracy
The ability of PLSR to impute SNP genotypes was quantified by considering the allele
imputation error rate. This index represents the number of falsely imputed alleles divided by
Massimo Cellesi
Statistical Tools for Genomic-Wide Studies
Tesi di Dottorato in Scienze dei Sistemi Agrari e Forestali e delle Produzioni Alimentari
Scienze e Tecnologie Zootecniche – Università degli Studi di Sassari
53
the total number of imputed alleles (Zhang et al. 2010). In practice, considering the real and
the imputed genotypes, 0 error was counted if both genotypes were identical, 1 if the real
genotype was homozygous and the imputed genotype heterozygous (or vice versa) and 2 if
the real and imputed genotypes were both homozygous but different. The imputation
accuracy (R), for each SNP, was equal to 1 minus allele error rate. The allele error rate and
the related imputation accuracy were averaged both by chromosome and across all
chromosomes.
The effect of SNP imputation on accuracy of DGV was also evaluated. DGV for milk yield, fat
content and protein content were calculated using both the actual 50K markers (DGV) and
the imputed genotypes (DGV_IMP). Briefly, effects of SNP genotypes on phenotypes in the
TP population were estimated using a BLUP model (Meuwissen et al. 2001):
y =1µ + Zg + e
where y is the vector of polygenic breeding values, 1 is a vector of ones, µ is the overall
mean, Z is the matrix of SNP scores, g is the vector of SNP regression coefficients assumed
(
identically and normally distributed with gi N 0, Iσ g2i
)
where σ g2i =
σ a2
k
( σ a2 = additive
genetic variance, k = number SNP), and e is the vector of random residuals. The overall mean
( µ̂ ) and the vector ( ĝ ) of the marker effects estimated in the TP were used to calculate the
DGV for PP as:
yˆ= µˆ + Z * gˆ
where ŷ is the vector of estimated DGV and Z * is the matrix of SNP scores in PP. For each
phenotype, both DGV and DGV_IMP were obtained and correlations between DGV and
DGV_IMP were calculated (r).
Results
Results obtained by analyzing Daetwyler’s data are reported in Table 1.
Massimo Cellesi
Statistical Tools for Genomic-Wide Studies
Tesi di Dottorato in Scienze dei Sistemi Agrari e Forestali e delle Produzioni Alimentari
Scienze e Tecnologie Zootecniche – Università degli Studi di Sassari
54
Table 1 Accuracy of genotype imputation from 3K to 50K with ChromoPhase, Beagle and PLSR algorithms for
founders (F) and non-founders (NF)
Type
NF
F
Imputation accuracy
ChromoPhase
Beagle
PLSR
0.925
0.926
0.929
0.728
0.868
0.924
1
1
Values from Daetwyler et al. (2011).
Values of R for both PLSR and Beagle were higher than those obtained with ChromoPhase,
especially for founder bulls. Nearly equal values were obtained by PLSR and Beagle for nonfounder animals whereas for founders, imputation accuracy using PLSR was more than 5%
higher than with Beagle.
Table 2 contains accuracies obtained with PLSR and Beagle for imputation from 3K and 7K
SNP chips to 50K based on the 2093 Holstein bulls. The average R using PLSR was 89.6% (±
1.6%) and 94.2% (± 1.0%) for imputation from 3K and 7K chips, respectively. Accuracies
obtained with PLSR were 4% higher than with Beagle for both LDP. As expected, R for each
chromosome was higher for imputation from 7K than for imputation from 3K. For both LDP,
imputation accuracies were higher for chromosomes with a high number of SNPs. For
example, R was more than 4% higher for BTA1 than for BTA28, for imputation from 3K (Table
2). Finally, R obtained by combining SNPs on BTA27, 28 and 29 was 87.4%, which was nearly
equal to the average R of the three chromosomes (87.3%), indicating that no advantage was
obtained by combining markers from multiple chromosomes.
Imputation accuracies obtained by including the Brown Swiss and Simmental breeds, both for
imputation within breed and in the multiple breed scenario, are reported in Table 3. For the
3K LDP, R was 0.88 and 0.89 for Holstein and Brown Swiss breeds, respectively, whereas R
was equal to 0.83 for Simmental. Imputation accuracies from 7K to 50K were, on average, 4%
higher than imputation accuracies from 3K to 50K. However, the multi-breed approach led to
a considerable decrease in accuracy and to a reduction of differences in imputation
accuracies between breeds, for imputation from both 3K and 7K.
Massimo Cellesi
Statistical Tools for Genomic-Wide Studies
Tesi di Dottorato in Scienze dei Sistemi Agrari e Forestali e delle Produzioni Alimentari
Scienze e Tecnologie Zootecniche – Università degli Studi di Sassari
55
Table 2 Number of SNPs per chromosome in the 50K, 3K and 7K SNP panels and the accuracy of imputation
based on 3K and 7K panels with PLSR and Beagle
Number of SNP
Chromosome
1
2
3
4
5
6
7
8
9
10
11
12
13
14
15
16
17
18
19
20
21
22
23
24
25
26
27
28
29
50K
3K
7K
2814
2294
2191
2123
1812
2164
1876
2026
1708
1841
1913
1408
1486
1453
1427
1337
1367
1147
1164
1351
1170
1087
919
1072
831
905
834
806
901
146
119
107
106
107
109
95
104
92
97
91
85
75
70
74
74
65
59
56
70
58
57
47
54
41
45
41
46
47
320
277
261
237
233
254
215
232
214
209
222
175
166
166
167
160
156
136
143
172
134
133
118
135
109
102
100
99
110
Total SNP
43427
2237
5155
Mean
Imputation accuracy
(PLSR)
3K
7K
0.916
0.953
0.911
0.951
0.897
0.944
0.903
0.941
0.912
0.948
0.908
0.953
0.908
0.949
0.919
0.953
0.904
0.949
0.909
0.946
0.901
0.947
0.903
0.942
0.910
0.949
0.897
0.945
0.898
0.945
0.910
0.950
0.888
0.936
0.877
0.924
0.878
0.935
0.921
0.960
0.881
0.934
0.894
0.941
0.887
0.938
0.888
0.941
0.865
0.926
0.889
0.931
0.872
0.924
0.871
0.922
0.875
0.934
Imputation accuracy
(Beagle)
3K
7K
0.876
0.919
0.863
0.922
0.846
0.898
0.861
0.908
0.872
0.912
0.867
0.914
0.858
0.915
0.872
0.915
0.851
0.909
0.872
0.915
0.862
0.914
0.856
0.899
0.860
0.911
0.850
0.912
0.864
0.915
0.864
0.913
0.842
0.900
0.825
0.884
0.827
0.895
0.886
0.933
0.832
0.899
0.849
0.900
0.842
0.895
0.842
0.903
0.816
0.887
0.841
0.890
0.832
0.890
0.826
0.879
0.828
0.888
0.896
0.851
0.942
0.905
Table 3 Average accuracy of imputation from 3K and 7K to 50K panels using single-breed and multi-breed
information
Imputation accuracy
3K
Breed
Single-breed Multi-breed
Holstein
0.882
0.806
Brown Swiss 0.893
0.827
Simmental
0.826
0.788
7K
Single-breed
0.914
0.921
0.854
Massimo Cellesi
Statistical Tools for Genomic-Wide Studies
Tesi di Dottorato in Scienze dei Sistemi Agrari e Forestali e delle Produzioni Alimentari
Scienze e Tecnologie Zootecniche – Università degli Studi di Sassari
Multi-breed
0.837
0.858
0.817
56
Accuracies of DGV predictions were moderate (Table 4), in accordance with the low number
of animals in TP. However, correlations between polygenic EBV and DGV (rEBV,DGV) and
correlations between EBV and DGV_IMP (rEBV,DGV_IMP) were quite similar with actual and
imputed data. This result is in agreement with the relatively high correlations between DGV
and DGV_IMP (rDGV,DGV_IMP), which were on average 0.96 across the three considered traits
with the 7K LDP. However, rDGV,DGV_IMP was lower when using the 3K LDP, for which
rDGV,DGV_IMP was on average 0.89.
Table 4 Correlations of direct genetic values (DGV) with polygenic estimated breeding values (EBV) (rEBV,DGV) and
with DGV based on imputed genotypes (DGV_IMP) (rDGV,DGV_IMP) for milk yield, fat content and protein content
Scenarios
Milk yield
rEBV,DGV rDGV,DGV_IMP
Actual data (50K)
0.58
Imputation from 7K 0.55 0.95
Imputation from 3K 0.52 0.89
Fat content
rEBV,DGV rDGV,DGV_IMP
0.45
0.43 0.96
0.42 0.93
Protein content
rEBV,DGV rDGV,DGV_IMP
0.44
0.43 0.96
0.38 0.86
Discussion
Results of PLSR applied to Daetwyler’s data (Table 1) showed that the method did not
produce different imputation accuracies for founders and non-founders, unlike ChromoPhase
and, partly, Beagle. In our analyses, we never used pedigree information. As a consequence,
both founders and non-founders were handled in the same manner. However, having a
parent in the reference dataset seemed to be more important when using Beagle than when
using PLSR.
This is probably due to the different algorithms implemented in Beagle
(Browning et al. 2009) and PLSR (Abdi 2003, Li et al. 2009).
PLSR imputation accuracies, from 3K and 7K LDP to the 50K panel, were higher than
accuracies obtained with Beagle and ChromoPhase. These results indicate that, if no
pedigree information is available, the PLSR method should be preferred over the other
methods studied here when imputation is from 3K or 7K to 50K.
Massimo Cellesi
Statistical Tools for Genomic-Wide Studies
Tesi di Dottorato in Scienze dei Sistemi Agrari e Forestali e delle Produzioni Alimentari
Scienze e Tecnologie Zootecniche – Università degli Studi di Sassari
57
PLSR was further used to impute SNP genotypes both in single and multi-breed scenarios
based on Holstein, Simmental and Brown Swiss data sets. No MAF threshold was applied in
the editing procedure. To investigate whether differences in imputation accuracies between
PLSR and the Beagle algorithms could arise with edits based on MAF, the impact of several
MAF thresholds (no limit, 0.01, 0.05, 0.10) was evaluated. However, no differences in
imputation accuracies were observed between the PLSR and Beagle results.
Mean R values obtained with PLSR in the single-breed scenario were 89.6% and 94.2% for the
3K and 7K LDP, respectively. It is worth mentioning that, in the present study, the ratio
between the number of animals (n = 2179 Holstein bulls) involved in the study and the mean
number of markers (m = 1497) on each chromosome, Rn / m , was 1.45. Dimauro et al. (2011),
tested the PLSR imputation method on a simulated data set with m = 1000 markers on a
chromosome and n = 5865 individuals. The resulting Rn / m was 5.9. In ordinary statistics and,
even more, in multivariate statistics, the availability of a larger number of observations
guarantees more accurate results. Thus, Dimauro et al. (2011) applied the PLSR method in a
more optimal dataset, obtaining an imputation accuracy of 0.86. Even if the latter study and
the present research are difficult to compare, the large difference between Rn / m ratios
suggests that PLSR also works properly with actual data. This is an important result because,
if a particular technique gives good results when applied to simulated data, it is not obvious
that similar performances are obtained with actual data.
PLSR is an ordinary statistical technique included in the most popular commercial and free
software packages that are currently used to perform genomic data analyses, such as SAS®
and R. The PLSR approach could thus be easily implemented in software for genomic
evaluations previously developed. Moreover, with PLSR, the computing time needed to
impute SNP genotypes was, on average, around 10 times lower than with Beagle. For
example, with the 7K LDP, PLSR took around 1 h to impute SNP genotypes for the first
chromosome, whereas Beagle needed around 8 h. This aspect should not be underrated
when an algorithm is chosen to perform imputation. In particular, PLSR could probably be
Massimo Cellesi
Statistical Tools for Genomic-Wide Studies
Tesi di Dottorato in Scienze dei Sistemi Agrari e Forestali e delle Produzioni Alimentari
Scienze e Tecnologie Zootecniche – Università degli Studi di Sassari
58
used to impute SNP genotypes from the 50K chip to the denser Illumina 777K platform in a
reasonable amount of time.
Imputation from 7K to 50K (R = 0.94) was more accurate than imputation from 3K to 50K (R =
0.90). This is an expected result and it is comparable to that obtained by Mulder et al. (2012),
who found a mean imputation accuracy of around 88% for 3K and 92% for 7K, respectively.
The mean R for each chromosome (Table 2) showed that genotype imputation accuracy
depends strongly on the number of SNP variables in the X matrix. For example, in the 3K
panel, BTA1 and BTA25 have 146 and 41 SNPs, respectively, and the related values of R were
0.92 and 0.87. Dimauro et al. (2011) found that imputation accuracy increases as the number
of extracted latent factors in the PLSR procedure increases. The maximum number of
possible latent factors is lower than or equal to the number of variables in X. This can explain
the lower imputation accuracy for chromosomes with a lower number of markers. Moreover,
the dimension of X cannot be artificially enlarged by using SNP from several chromosomes
because it resulted in an accuracy that was equal to the mean of accuracies obtained with
each chromosome. This result suggests that a chromosome can be considered as a
genetically and statistically independent unit.
Results for imputation based on information from multiple breeds obtained in this study,
basically confirm previous reports. Values of R using multi-breed information (Table 3) were
considerably lower than R for imputation within breeds. Similarly, Hayes et al. (2012)
obtained no advantage or, sometimes, worse results, for imputation based on information
from multiple breeds, compared to single-breed information. Also, R for Simmental was
lower than R for the other breeds. Dassonneville et al. (2012) also reported lower imputation
accuracies in the French Blonde d’Aquitaine beef breed (around 5%) than in two dairy
breeds. The lower imputation accuracy for Simmental may be partially explained by the fact
that the Illumina 50K platform was not tested on the Simmental breed (Illumina 2011) and
that the effective population size of the three breeds is very different, being higher for the
Simmental than the other breeds (Medugorac et al. 2009, Hagger 2005, de Roos et al. 2008).
Massimo Cellesi
Statistical Tools for Genomic-Wide Studies
Tesi di Dottorato in Scienze dei Sistemi Agrari e Forestali e delle Produzioni Alimentari
Scienze e Tecnologie Zootecniche – Università degli Studi di Sassari
59
Differences in the underlying structure (Ajmone-Marsan et al. 2012) of the three populations
may impact imputation accuracies. Finally, the use of a multi-breed TP also did not give
better accuracies in GEBV prediction than the single-breed scenario (Pryce et al. 2012, Hayes
et al. 2009).
The impact of the SNP genotype imputation on the accuracy of DGV was small. Correlations
between DGV and DGV_IMP were, on average, 0.96 for all traits for imputation from 7K to
50K, and 0.89 for imputation from 3K to 50K. Similar results were obtained by Berry and
Kearney (2011), who reported an average correlation of 0.97 across 15 traits for the 3K LDP.
The lowest correlations between DGV and DGV_IMP were observed for imputation from 3K
to 50K for protein content (0.86) and milk yield (0.89). The correlation between DGV and
DGV_IMP was approximately the same (around 0.96) for all traits, when imputation was from
7K to 50K. Weigel et al. (2010) reported similar values, both for milk yield and protein
content, and confirmed that DGV_IMP predictions improve if the number of SNPs on the LDP
increases, both for protein content and milk yield. Therefore, the 7K chip seems to be an
efficient imputation tool and the imputed genotypes could be used to correctly estimate DGV
for milk yield, and fat and protein content.
Conclusions
This study demonstrates that the PLSR imputation method can efficiently impute missing
genotypes from LDP to HDP. With this method, the same good results are obtained whether
animals in the PP have parents in the TP or not. Moreover, the computing time was markedly
lower than with Beagle. The PLSR method was applied chromosome-wise and the results
indicate that imputation accuracies are higher when the number of SNPs in the X matrix is
high. However, combining markers from several chromosomes did not increase the accuracy
of imputation, which confirms that chromosomes are independent genetic and statistical
units. The 7K LDP gave good results both in terms of R and DGV prediction. Similar to the 3K
LDP, the multi-breed approach applied to the 7K scenario, did not yield better results than
the single-breed approach.
Massimo Cellesi
Statistical Tools for Genomic-Wide Studies
Tesi di Dottorato in Scienze dei Sistemi Agrari e Forestali e delle Produzioni Alimentari
Scienze e Tecnologie Zootecniche – Università degli Studi di Sassari
60
Competing interests
The authors declare that they have no competing interests.
Authors’ contributions
CD conceived the original ideas and wrote, under the supervision of NPPM and PAM, the first
version of the SAS code. MC, RS and GG performed the analysis. GM contributed to the
development of the ideas and algorithms. CD, MC and NPPM wrote the draft of the paper
and all authors contributed in refining the manuscript. All authors read and approved the
final manuscript.
Acknowledgements
The research was funded by the Italian Ministry of Agriculture (Rome, Italy), grants SELMOL
and INNOVAGEN, and from the PROZOO Project. Authors wish to acknowledge the Parco
Tecnologico Padano and ANAFI for providing PROZOO data. Helpful comments and
suggestions from the two anonymous reviewers are also acknowledged.
Massimo Cellesi
Statistical Tools for Genomic-Wide Studies
Tesi di Dottorato in Scienze dei Sistemi Agrari e Forestali e delle Produzioni Alimentari
Scienze e Tecnologie Zootecniche – Università degli Studi di Sassari
61
References
•
Abdi H (2003) Partial least square (PLS) regression. In Encyclopedia for Research
Methods for the Social Sciences. Edited by Lewis–Beck M, Bryman A, Futing T.
Thousand Oaks: Sage, pp. 792–795.
•
Ajmone–Marsan P, Nicolazzi E, Negrini R, Macciotta NPP, Fontanesi L, Russo V,
Bagnato A, Santus E, Vicario D, van Kaam JBCHM, Albera A, Filippini F, Marchitelli C,
Mancini G, Nardone A, Valentini A (2010) Integrating population genomics in genomic
selection.
Interbull
Bull
[http://www–
interbull.slu.se/bulletins/bulletin41/Ajmone.pdf]
•
Berry DP, Kearney JF (2011) Imputation of genotypes from low– to high–density
genotyping platforms and implications for genomic selection. Animal, 5: 1162–1169.
•
Boichard D, Chung H, Dassonneville R, David X, Eggen A, Fritz S, Gietzen KJ, Hayes BJ,
Lawley CT, Sonstegard TS, Van Tassell CP, Van Raden PM, Viaud–Martinez KA,
Wiggans GR (2012) Design of a bovine low–density SNP array optimized for
imputation. PLoS One, 7: e34130.
•
Browning BL, Browning SR (2009) A unified approach to genotype imputation and
haplotype–phase inference for large data sets of trios and unrelated individuals. Am J
Hum Genet, 84: 210–223.
•
Chamberlain AJ, Hayes BJ, Savin K, Bolormaa S, McPartlan HC, Bowman PJ, Van Der
Jagt C, MacEachern S, Goddard ME (2012) Validation of single nucleotide
polymorphisms associated with milk production traits in dairy cattle. J Dairy Sci, 95:
864–875.
•
Chen J, Liu Z, Reinhardt F, Reents R (2011) Reliability of genomic prediction using
imputed genotypes for German Holsteins: Illumina 3K to 54K bovine chip. Interbull
Bull 44. [http://www–interbull.slu.se/ojs/index.php/ib/article/view/1191]
•
Daetwyler HD, Wiggans GR, Hayes BJ, Woolliams JA, Goddard ME (2011) Imputation
of missing genotypes from sparse to high density using long–range phasing. Genetics,
189: 317–327.
Massimo Cellesi
Statistical Tools for Genomic-Wide Studies
Tesi di Dottorato in Scienze dei Sistemi Agrari e Forestali e delle Produzioni Alimentari
Scienze e Tecnologie Zootecniche – Università degli Studi di Sassari
62
•
Dassonneville R, Brøndum RF, Druet T, Fritz S, Guillaume F, Guldbrandtsen B, Lund
MS, Ducrocq V, Su G (2011) Effect of imputing markers from a low–density chip on
the reliability of genomic breeding values in Holsteins populations. J Dairy Sci, 94:
3679–3686.
•
Dassonneville R, Fritz S, Ducroq V, Boichard D (2012) Imputation performances of 3
low–density marker panels in beef and dairy cattle. J Dairy Sci, 95: 4136–4140.
•
de Roos APW, Hayes BJ, Spelman RJ, Goddard ME (2008) Linkage disequilibrium and
persistence of phase in Holstein–Friesian, Jersey and Angus cattle. Genetics, 179:
1503–1512.
•
Dimauro C, Steri R, Pintus MA, Gaspa G, Macciotta NPP (2011) Use of partial least
squares regression to predict single nucleotide polymorphism marker genotypes
when some animals are genotyped with a low–density panel. Animal, 5: 833–837.
•
Druet T, Georges M (2010) A hidden Markov model combining linkage and linkage
disequilibrium information for haplotype reconstruction and quantitative trait locus
fine mapping. Genetics, 184: 789–798.
•
Druet T, Schrooten C, de Roos APW (2010) Imputation of genotypes from different
single nucleotide polymorphism panels in dairy cattle. J Dairy Sci, 93: 5443–5454.
•
Hagger C (2005) Estimates of genetic diversity in the brown cattle population of
Switzerland obtained from pedigree information. J Anim Breed Genet, 122: 405–413.
•
Hayes BJ, Bowman PJ, Chamberlain AJ, Goddard ME (2009) Genomic selection in dairy
cattle: progress and challenges. J Dairy Sci, 92: 433–443.
•
Hayes BJ, Bowman PJ, Chamberlain AJ, Verbyla K, Goddard ME (2009) Accuracy of
genomic breeding values in multi–breed dairy cattle populations. Genet Sel Evol, 41:
51.
•
Hayes BJ, Bowman PJ, Daetwyler HD, Kijas JW, van der Werf JHJ (2012) Accuracy of
genotype imputation in sheep breeds. Anim Genet, 43: 72–80.
Massimo Cellesi
Statistical Tools for Genomic-Wide Studies
Tesi di Dottorato in Scienze dei Sistemi Agrari e Forestali e delle Produzioni Alimentari
Scienze e Tecnologie Zootecniche – Università degli Studi di Sassari
63
•
Hickey JM, Kinghorn BP, Tier B, Wilson JF, Dunstan N, van der Werf JHJ (2011) A
combined long–range phasing and long haplotype imputation method to impute
phase for SNP genotypes. Genet Sel Evol, 43: 12.
•
Illumina (2011) BovineSNP50 genotyping BeadChip. Pub. No 370–2007–029.
•
Kizilkaya K, Fernando RL, Garrick DJ (2010) Genomic prediction of simulated
multibreed and purebred performance using observed fifty thousand single
nucleotide polymorphism genotypes. J Anim Sci, 88: 544–551.
•
Li G, Qin SZ, Ji YD, Zhou DH (2009) Total PLS based contribution plots for fault
diagnosis. Acta Automat Sinica, 35: 759–765.
•
Medugorac I, Medugorac A, Russ I, Veit–Kensch CE, Taberlet P, Luntz B, Mix HM,
Förster M (2009) Genetic diversity of European cattle breeds highlights the
conservation value of traditional unselected breeds with high effective population
size. Mol Ecol, 18: 3394–3410.
•
Meuwissen TH, Hayes BJ, Goddard ME (2001) Prediction of total genetic value using
genome–wide dense marker maps. Genetics, 157: 1819–1829
•
Moser G, Khatkar MS, Hayes BJ, Raadsma HW (2010) Accuracy of direct genomic
values in Holstein bulls and cows using subsets of SNP markers. Genet Sel Evol, 42: 37.
•
Mulder HA, Calus MPL, Druet T, Schrooten C (2012) Imputation of genotypes with
low–density chips and its effect on reliability of direct genomic values in Dutch
Holstein cattle. J Dairy Sci, 95: 876–889.
•
Pryce JE, Gredler B, Bolormaa S, Bowman PJ, Egger–Danner C, Fuerst C, Emmerling R,
Sölkner J, Goddard ME, Hayes BJ (2011) Genomic selection using a multi–breed
across–country reference population. J Dairy Sci, 94: 2625–2630.
•
Scheet P, Stephens M (2006) A fast and flexible statistical model for large–scale
population genotype data: applications to inferring missing genotypes and haplotypic
phase. Am J Hum Genet, 78: 629–644.
Massimo Cellesi
Statistical Tools for Genomic-Wide Studies
Tesi di Dottorato in Scienze dei Sistemi Agrari e Forestali e delle Produzioni Alimentari
Scienze e Tecnologie Zootecniche – Università degli Studi di Sassari
64
•
Schopen GCB, Visker MHPW, Koks PD, Mullaart E, van Aredonk JAM, Bovenhuis H
(2011) Whole–genome association study for milk protein composition in dairy cattle. J
Dairy Sci, 94: 3148–3158.
•
Segelke D, Chen J, Liu Z, Reinhadt F, Thaller G, Reents R (2012) Reliability of genomic
prediction for German Holsteins using imputed genotypes from low–density chips. J
Dairy Sci, 95: 5403–5411.
•
Van Raden PM, O’Connell JR, Wiggans GR, Weigel KA (2011) Genomic evaluations
with many more genotypes. Genet Sel Evol, 43: 10.
•
Weigel KA, de los Campos G, Vazquez AI, Rosa GJM, Gianola D, Van Tassell CP (2010a)
Accuracy of direct genomic values derived from imputed single nucleotide
polymorphism genotypes in Jersey cattle. J Dairy Sci, 93: 5423–5435.
•
Weigel KA, Van Tassell CP, O’Connell JR, Van Raden PM, Wiggans GR (2010b)
Prediction of unobserved single nucleotide polymorphism genotypes of Jersey cattle
using reference panels and population–based imputation algorithms. J Dairy Sci, 93:
2229–2238.
•
Zhang Z, Druet T (2010) Marker imputation with low–density marker panels in Dutch
Holstein cattle. J Dairy Sci, 93: 5487–5494.
Massimo Cellesi
Statistical Tools for Genomic-Wide Studies
Tesi di Dottorato in Scienze dei Sistemi Agrari e Forestali e delle Produzioni Alimentari
Scienze e Tecnologie Zootecniche – Università degli Studi di Sassari
Chapter 4
Maximum Difference Analysis: a new
empirical method for genome-wide
association studies
Statistical Tools for Genomic-Wide Studies
Tesi di Dottorato in Scienze dei Sistemi Agrari e Forestali e delle Produzioni Alimentari
Scienze e Tecnologie Zootecniche – Università degli Studi di Sassari
Massimo Cellesi
66
Abstract
The availability of high-density SNPs panels for humans and, recently, for
several animal species has given a great impulse at genome-wide association
studies toward the identification of genes associated with complex traits and
diseases. Marker relevance is traditionally assessed by using the frequentist or
the Bayesian approach. The first is the most used method being intuitive and
easy whereas the second is more complicated than the former but has the
advantage to verify prior information by a posterior probability of association.
In this work we suggest a new empirical method for genome-wide studies that
does not require explicit assumptions on data distribution and it solves the
problem of false positive using a posterior probability that allows for the
exclusion of random associations. This method, called Maximum Difference
Analysis, was applied to find associations between single nucleotide
polymorphisms and milk, fat and protein yield and fat and protein percentage
in 2,093 Italian Holstein bulls. To validate the method, results were compared
with annotated genes linked with traits under study and with results obtained
in previous studies. The method was able to locate important gene as the
diacylglycerol O-acyltransferase 1 (DGAT1), the β-lactoglobulin (BLG), the
bovine casein gene cluster, the prolactin receptor (PRLR). These results
confirm the ability of Maximum Difference Analysis to detect associations
between markers and traits.
Introduction
The availability of high-density SNP panels has given a great impulse toward
the identification of genomic regions associated to complex traits and
diseases in humans and, recently, in several livestock species (Yang et al.
2010, Hayes and Goddard 2010). Even if SNPs are not always directly
Massimo Cellesi
Statistical Tools for Genomic-Wide Studies
Tesi di Dottorato in Scienze dei Sistemi Agrari e Forestali e delle Produzioni Alimentari
Scienze e Tecnologie Zootecniche – Università degli Studi di Sassari
67
responsible for the observed phenotypic variation, they have been coinherited together with unknown causal variants thus enabling the detection
of genomic regions harboring the polymorphisms influencing traits or
diseases. Cattle breeds are of particular interest for studying genetic
differences due to the strong artificial selection they have been subjected
(Hayes et al. 2009b, Qanbari et al 2010). Several genome-wide association
studies (GWAS) pointed out associations between markers, production and
functional traits in dairy breeds (Cole et al. 2009, Pryce et al. 2010, Hayes et
al. 2010).
In spite of a relevant amount of information on genes and genomic regions
that could be implemented in animal breeding, several issues remain to be
addressed in GWAS. A first point is represented by theoretical assumptions on
the genetic architecture of the trait under study. Standard linear models of
quantitative genetics assume additive effects not considering interactions
between genes. This fact may result in false positive associations (Platt et al.
2010). On the other hand, inclusion of factors such as epistasis, lead to a
highly parameterized model structure (Morota et al. 2013). A further cause of
spurious associations can be found in the stratification that exists in cattle
populations, due genetic drift or artificial selection (Ma et al. 2012).
Moreover, the genetic variance explained by markers is usually lower than
estimates
obtained
by
classical
quantitative
genetics
through
the
implementation of the polygenic models that fits the genetic (co)variance
between individuals using pedigree relationships (van Binsbergen et al. 2012).
Finally, the sampling effect should be mentioned: apart from associations that
deal with genes with an assessed major effect on phenotypes such as the
DGAT1 for milk production traits, very often significant SNPs found in a
sample of animals are not confirmed in an independent sample. For example,
Chamberlain et al. (2012) recently tested in a validation population, 423 SNPs
Massimo Cellesi
Statistical Tools for Genomic-Wide Studies
Tesi di Dottorato in Scienze dei Sistemi Agrari e Forestali e delle Produzioni Alimentari
Scienze e Tecnologie Zootecniche – Università degli Studi di Sassari
68
declared significantly associated with milk production traits in different
screening experiments. The association of only 72 markers with milk traits
was finally validated.
A key point for association studies is represented by the criteria used to
declare a marker as significantly associated to a specific trait. Since the
beginning of genome scans aimed at investigating QTLs in livestock by using
microsatellites markers, the problem of assessing a suitable threshold for the
test statistics has been pointed out by many researchers. The two main issues
are represented by the approximation of the test statistics under the null
hypothesis and by the multiple hypothesis testing, i.e. several tests are carried
out for this purpose, but many of them are not independent (Churchill and
Doerge 1994).
In frequentist methods, the issue of multiple testing can be addressed using
the Bonferroni correction that, however, is extremely conservative and
usually discards almost all detected associations (Baldin 2006). An alternative
empirical procedure is the permutation test (Churchill and Doerge 1994). It is
remarkably less stringent, but considering the large number of makers
currently tested in GWAS (tens of thousands), a high risk of false positives
could be hypothesized.
On the other hand, the Bayesian approach requires several explicit
assumptions about the prior probability of association (π), the prior
parameter distribution and the effect size at truly associated SNP. These
assumptions are needed for calculating the Bayes factor (BF). However, small
differences in
r could result in very diffe
probability of association (Stephens and Balding 2009). Moreover, the BF
evaluation requires complex computational procedure as the resolution of
high-dimensional integrals and the posterior density distribution is unknown.
Massimo Cellesi
Statistical Tools for Genomic-Wide Studies
Tesi di Dottorato in Scienze dei Sistemi Agrari e Forestali e delle Produzioni Alimentari
Scienze e Tecnologie Zootecniche – Università degli Studi di Sassari
69
So the BF is approximated by using the Markov chain Monte Carlo analysis
which, however, requires long computing time.
In this paper, an empirical method is presented for testing associations
between SNP genotypes and milk production traits in dairy cattle. This new
proposed method is termed Maximum Difference Analysis (MDA) because it is
based on the comparison of genotypic frequencies between two groups of
animals ranked according to a specific phenotype. MDA could be considered a
different option because does not rely on prior distributions of marker effects,
it is not characterized by a complex mathematical structure, and the
significance of marker association is evaluated by using a posterior probability
distribution obtained with a bootstrap resampling procedure.
In this study, the MDA was used to detect possible associations between SNPgenotypes belonging to Italian Holstein bulls and five productive traits: milk
(MY), fat (FY) and protein yield (PY), fat (FP) and protein percentage (PP).
Results were compared with previous associations reported in literature
(Pryce et al. 2010, Meredith et al. 2012, Jiang et al. 2010). The Python code of
MDA method is provided in this work as supplemental material [S2]
Results
Significant associations
A large number of SNPs were initially declared candidate for possible
associations with one of the 5 traits under study, i.e. with the MDAk,j>1.66 for
at least one resampling (Table 1). In particular, more than 30,000 for MY,
around 29,000 for PY and around 31,000 for FY, FP and PP associations were
pointed out. Most of them, however, were considered false positive
associations. If the threshold value for posterior probability of bootstrap
Massimo Cellesi
Statistical Tools for Genomic-Wide Studies
Tesi di Dottorato in Scienze dei Sistemi Agrari e Forestali e delle Produzioni Alimentari
Scienze e Tecnologie Zootecniche – Università degli Studi di Sassari
70
(pboot) was fixed at 0.95, only a range of 0.5% - 1.8% of the original associated
SNP were confirmed (Table 1).
Table 1 Number of SNPs associated with the trait for different threshold values.
MY
FY
PY
FP
PP
31,148 29,337 31,845
31,662
Total
N° SPNs with MDZ >1.66
30,295
N° SNPs with pboot > 0.95
542
360
684
143
246
1,432
N° SNPs with pboot = 1
51
21
65
26
43
169
For a threshold pboot = 1, fewest markers were selected for each trait (Table 1).
For MY, most of the selected SNPs were located on BTAs 14 and 20. For FY, the
25% of SNPs with a pboot =1 were located on BTA2. Chromosomes 4, 9 and 20
showed the 10% each of significant associated SNPs for PY. For FP and PP, over
the 95% of SNPs with pboot =1 were distributed on BTA14 and BTA20
respectively. It should be remembered that these SNP were associated to the
trait in all 10,000 times in the resampling procedure. Therefore the reliability of
a possible association of these markers with the trait could be considered very
high. Considering threshold for pboot > 0.95, the highest number of significantly
associated SNPs with MY and FY were identified on BTA2 whereas the lowest
number were detected on BTA26 and BTA27. For PY, the highest number of
markers was identified on BTAs 1, 7 and 8, whereas the lowest number was on
BTA 26. In the whole genome scan, BTA14 presented the largest number of
significant SNPs for FP whereas there were several autosomes with only 0 or 1
significant SNPs. Finally, respect the five considered traits, yield traits exhibited
the largest number of significant markers genome-wide whereas PP had the
highest number for an autosome (BTA20) (Table 2).
Massimo Cellesi
Statistical Tools for Genomic-Wide Studies
Tesi di Dottorato in Scienze dei Sistemi Agrari e Forestali e delle Produzioni Alimentari
Scienze e Tecnologie Zootecniche – Università degli Studi di Sassari
71
Table 2 Distribution of SNPs significantly (pboot > 0.95) associated with the 5 traits in the 29
autosomes.
BTA
1
2
3
4
5
6
7
8
9
10
11
12
13
14
15
16
17
18
19
20
21
22
23
24
25
26
27
28
29
total
MY
26
38
26
26
26
25
31
29
24
29
26
9
27
18
8
22
24
10
15
28
20
6
12
8
5
2
5
8
9
542
FY
19
45
12
10
13
16
28
15
19
9
22
14
17
7
5
7
8
9
14
20
8
9
4
8
3
8
2
6
3
360
PY
47
27
39
41
28
27
45
45
24
27
36
20
29
27
8
18
16
16
26
33
27
11
15
8
8
5
9
11
11
684
FP
8
9
5
8
6
2
3
1
5
3
0
0
8
37
1
2
6
3
6
13
1
3
1
1
4
1
4
1
1
143
PP
17
12
4
5
7
9
5
6
4
2
11
6
7
12
6
7
6
7
5
65
3
1
17
4
3
4
2
0
9
246
BTA27 resulted as the chromosome with less significant SNPs for all traits
analyzed. Among the associated markers with pboot > 0.95, several SNPs
influenced more than one trait (Table 3).
Table 3 Number of SNPs associated with one or more traits.
N° of traits
1
2
3
4
5
N° of SNPs
1,166
221
44
1
0
Massimo Cellesi
Statistical Tools for Genomic-Wide Studies
Tesi di Dottorato in Scienze dei Sistemi Agrari e Forestali e delle Produzioni Alimentari
Scienze e Tecnologie Zootecniche – Università degli Studi di Sassari
72
In particular 221 SNPs were shared by two traits, 44 SNPs by three traits and 1
SNP was in common with four traits. No significant marker was associated with
all the five considered traits.
The Manhattan plots for BTAs 6, 11, 14, and BTA20 are reported in Figures 1-4,
respectively.
Figure 1 Plot of SNPs detected for traits and annotated genes on BTA6. The horizontal lines
indicate pboot = 0.95
Massimo Cellesi
Statistical Tools for Genomic-Wide Studies
Tesi di Dottorato in Scienze dei Sistemi Agrari e Forestali e delle Produzioni Alimentari
Scienze e Tecnologie Zootecniche – Università degli Studi di Sassari
73
Figure 2 Plot of SNPs detected for traits and annotated genes on BTA11. The horizontal lines
indicate pboot = 0.95
Figure 3 Plot of SNPs detected for traits and annotated genes on BTA14. The horizontal lines
indicate pboot = 0.95
Massimo Cellesi
Statistical Tools for Genomic-Wide Studies
Tesi di Dottorato in Scienze dei Sistemi Agrari e Forestali e delle Produzioni Alimentari
Scienze e Tecnologie Zootecniche – Università degli Studi di Sassari
74
Figure 4 Plot of SNPs detected for traits and annotated genes on BTA20. The horizontal lines
indicate pboot = 0.95
A list of markers associated with all traits under study represented above the
horizontal line (pboot =0.95), is reported in Table S1 [Supplemental material].
SNPs declared associated with a trait in the MDA were used for a gene discovery
study. In particular, MDA associated SNPs were compared with markers and
annotated genes detected in previous association studies ( Pryce et al. 2010,
Meredith et al. 2012, Jiang et al. 2010, Hayes et al. 2009a, Flori et al. 2009, Cole
et al. 2011).
Milk yield
On whole genome, a total of 542 SNPs with a pboot > 0.95, were identified as
significantly associated with MY (Table 1). Among these, on BTA14, 4 significant
SNPs corresponded to markers detected by Jiang et al. (2010), 9 corresponded
to markers detected by Meredith et al. (2012) and Pryce et al. (2010). Some of
Massimo Cellesi
Statistical Tools for Genomic-Wide Studies
Tesi di Dottorato in Scienze dei Sistemi Agrari e Forestali e delle Produzioni Alimentari
Scienze e Tecnologie Zootecniche – Università degli Studi di Sassari
75
these markers are located in a region spanning from 76Kbp to 679Kb (Figure 3)
that harbors the diacylglycerol O-acyltransferase 1 (DGAT1) locus. Moreover, 8
significant SNPs located between 30-41 Mb on BTA20, were the same reported
by Meredith et al. (2012) (Figure 4). MDA highlighted a SNPs associated with MY
(pboot>0.95) on BTA6. This marker was located at 37.5 Mb and it identifies a
cluster of genes ATP-binding cassette, sub-family G (WHITE), member 2 (ABCG2),
polycystic kidney disease 2 (PKD2), secreted phosphoprotein 1 (SPP1) already
proposed by several authors as candidates for milk QTL (Ron and Weller 2007).
Moreover, the Hapmap 26848-BTC-038527 marker (44.7 Mb), highlighted on
BTA6, was close to the peroxisome proliferator-activated receptor gamma,
coactivator 1 alpha (PPARGC1A) gene, which has been reported to be associated
to milk traits (Ogorevc et al. 2009). Three significant SNPs (Hapmap42161BTA26363, BTA-92644-no-rs and ARS-BFGL-NGS-65409) from 41.2 Mb to 41.6
Mb were highlighted on BTA20, where PRLR locus maps. In this study the PRLR
polymorphism is in agreement with the results of Zhang et al. (2007) in Chinese
Holstein and Wang et al. (2012) in German Holstein-Frisian population.
Fat yield
The MDA method highlighted 360 SNPs (Table 1). Several of them were close to
annotated genes known to affect lipid metabolism as DGAT1, glutamate
receptor, ionotropic, N-methyl D-aspartate-associated protein 1 (GRINA),
alkylglycerone phosphate synthase (AGPS), vasoactive intestinal peptide (VIP),
ATP-binding cassette, sub-family G (WHITE), member 5 (ABGC5), ATP-binding
cassette, sub-family G (WHITE), member 8 (ABCG8), lysophosphatidylglycerol
acyltransferase 1 (LPGAT1). Moreover, 4 SNPs on BTA14 and 8 SNPs on BTA 20
were the same SNPs declared associated with FY by Meredith et al. (2012) in
Irish Holstein Friesian.
Massimo Cellesi
Statistical Tools for Genomic-Wide Studies
Tesi di Dottorato in Scienze dei Sistemi Agrari e Forestali e delle Produzioni Alimentari
Scienze e Tecnologie Zootecniche – Università degli Studi di Sassari
76
Protein yield
For the PY trait, 684 significant SNPS were detected (Table 1). Two SNPs were
close to casein cluster on BTA6 (88.8 Mb), and one to the β-lactoglobulin locus
on BTA11 (107.6 Mb). It is known that caseins (CSNs) and β-lactoglobulin genetic
polymorphisms are related to milk production traits (Boettcher et al. 2004,
Lunden et al. 1997). Four relevant SNPs nearby to the DGAT1 gene were the
same reported in previous studies ( Pryce et al. 2010, Meredith et al. 2012, Jiang
et al. 2010). In the central portion of BTA20, a well-known major QTL affecting
the PY, but also PP and MY, was identified using the MDA. This relatively narrow
region contains the Growth hormone receptor (GHR) and the PRLR loci. In
particular the significant marker ARS-BFGL-NGS-118998 positioned at 34 Mb
was found to fall within the GHR gene. This marker was the same reported by
Jiang et al. (2010) for Chinese Holstein. The F279Y polymorphism in GHR was
associated with a strong effect on milk yield and composition (Zhang et al. 2007)
and it was considered responsible for the phenotypic variability in HolsteinFriesian milk (Plante et al. 2001, Blott et al. 2003).
Fat percentage
Most of 143 significant SNPs associated to FP (Table 1) were located on BTA14
and BTA20 (37 and 13 respectively). 34 out of 37detected SNPs on BTA14 and 5
out of 13 on BTA 20, respectively, were in common with the markers selected by
Meredith et al. (2012) in Irish Holstein Friesian. 25 markers located on BTA14
were in common with SNPs detected by Jiang et al. (2010) in Chinese Holstein
and 27on BTA 14 and 8 on BTA 20 were shared with Pryce et al. (2010) on
American Holstein bulls, respectively. On BTA 14, all the significant SNPs
detected were contained in a region spanning from 50 Kb to 5,000 Kb where a
known QTL for milk traits was located. Figure 3 shows a region crowded of
significant SNPs near the centromere where DGAT1 locus was positioned.
Massimo Cellesi
Statistical Tools for Genomic-Wide Studies
Tesi di Dottorato in Scienze dei Sistemi Agrari e Forestali e delle Produzioni Alimentari
Scienze e Tecnologie Zootecniche – Università degli Studi di Sassari
77
Protein percentage
For PP a total of 246 significant SNPs were discovered (Table 1). 49 out of 65 and
45 out of 65 significant SNPs detected on BTA20 were in common with Meredith
et al. (2012) and Pryce et al. (2010). Moreover, 13 out of 65 markers were in
common with SNPs detected by Jiang et al. (2010). In Figure 4 a dense region of
SNPs (between GHR and PRLR loci) could be observed. A considerable number
of significant SNPs associated with PP were detected on BTA1 and BTA23 (Table
S1).
Discussion
In the present work a method for GWAS was developed and tested on 2,093
Italian Holstein Frisian bulls for detecting associations between SNP markers
and five dairy traits. The MDA approach was able to select 1,432 significant
SNPs spanning the entire genome. This number of associated markers is
comparable with results obtained in analogue studies developed by using
common GWAS approaches (Pryce et al. 2010, Meredith et al. 2012, Jiang et
al. 2010, Kolbehdari et al. 2009, Mai et al. 2010). The significant markers were
distributed across all 29 autosomes and the positions were generally in
agreement with those reported in literature (Meredith et al. 2012, Jiang et al.
2010, Khatkar et al. 2004, Smaragdov 2006). The number of significant
markers reflected the assessed genetic architecture of traits: more relevant
SNP were found for yield in comparison with composition traits. Actually it is
well known that the genetic control of milk composition traits could be
ascribed to a relatively small number of genes with a large to moderate effect
(Hayes et al. 2010, Grisart et al. 2002) whereas a stronger polygenic
background could be hypothesised for yield traits.
Massimo Cellesi
Statistical Tools for Genomic-Wide Studies
Tesi di Dottorato in Scienze dei Sistemi Agrari e Forestali e delle Produzioni Alimentari
Scienze e Tecnologie Zootecniche – Università degli Studi di Sassari
78
The whole genome scan confirmed, as expected, the important role of major
QTLs for milk traits on BTA14 (Grisart et al. 2002, Bennewitz et al. 2003) and
BTA20 (Blott et al. 2003). In addition, MDA highlighted candidate QTLs on
BTA2 for MY and FY, and on BTA7 and BTA8 for PY. These three chromosomes
have been recently investigated by other authors for association with milk
traits (Buitenhuis et al. 2013, Gray et al. 2012).
BTA6 is one of the most studied chromosomes for milk QTLs within and
between cattle breeds [37-41]. In a meta-analysis investigation, Khatkar et al.
(2004) reported at least 77 QTLs on BTA6 with around 60% of them involved
in milk production traits. The MDA was able to find, on BTA6, three significant
SNPs mainly associated with PP were found at about 40Mb, where the slit
homolog 2 (Drosophila) (SLIT2) gene maps (Figure 1). This locus encodes a
protein expressed during neuronal development and also in mammary gland
during ductal morphogenesis (Strickland et al. 2006).
On BTA11, MDA detected one SNP associated with FY, (BTB-01550704)
located close to ABCG5 and ABCG8 at 27.4 Mb. These genes are believed to be
involved in the mammalian cholesterol balance and in the physiology of
intracellular lipid transport (Schmitz et al. 2001). Viturro et al. (2006)
hypothesized their potential role in lipid trafficking and excretion during
lactation. Many association studies identified QTLs affecting FY and FP in the
centromeric region of BTA14 (Meredith et al. 2012, Jiang et al. 2010, Ogorevc
et al. 2009, Viitala et al. 2003). The DGAT1 locus is an enzyme that catalyzes
the synthesis of diacylglycerols involved in several biological processes (Mai et
al, 2010). The association between polymorphisms in the DGAT1 gene and
milk fat content in dairy cattle has been evidenced in several breeds (Grisart
et al. 2002). To explain the genetic variability presented by milk production
traits Bennewitz et al. (2003) hypothesized the existence of a further QTL with
Massimo Cellesi
Statistical Tools for Genomic-Wide Studies
Tesi di Dottorato in Scienze dei Sistemi Agrari e Forestali e delle Produzioni Alimentari
Scienze e Tecnologie Zootecniche – Università degli Studi di Sassari
79
possible epistatic effects in linkage with the DGAT1 locus. This second QTL was
localized closely to the gene cytochrome P450, family 11, subfamily B,
polypeptide 1 (CYP11B1) (Mai et al, 2010). In cattle this enzyme is involved in
the lipogenesis and lipolysis mediated by corticosteroids (Kaupe et al. 2007).
For all five milk traits considered in this study, MDA highlighted, on BTA14,
several significant SNPs in the region where DGAT1 and CYP11B1 loci are
located. These SNPs were the same observed by Jiang et al. (2010) in Chinese
Holstein population, Pryce et al. (2010) in bulls of American Holstein and
Meredith et al. (2012) in Irish Holstein-Frisian. Moreover, other six significant
SNPs, delimited a QTL region spanning from 62Mb to 69 Mb, associated to PY,
PP and MY phenotypes were found when MDA was applied on BTA14. Within
this genomic segment a QTL affecting production traits in Holstein cattle was
already detected (Heyen et al 1999, Ashwell et al. 2004).
On BTA22, at 55.7 Mb, the Ghrelin-obestatin prepropeptide (GHRL)
(Hapmap41094-BTA83358), associated with FP trait, was pointed out. This
gene encodes a precursor that generates two hormones: ghrelin and
obestatin. The first molecule is involved in the regulation of the growth
hormone release and influences the body general metabolism. Recently, GHRL
was proposed as candidate gene for milk production traits (Gil et al. 2011).
Indeed, a polymorphism affected FY, FP and PP was observed in water buffalo
and Polish Holstein-Friesian (Gil et al. 2011, Kowalewska-Luczak et al. 2011).
In addition to the QTLs discussed above, MDA method confirmed two QTLs
affecting milk traits previously reported in literature. The significant marker
Hapmap43212-BTA-23629 on BTA4 pointed out the CD36 molecule
(thrombospondin receptor) (CD36) locus already reported by Lemay et al.
(2009) in an analysis of genes expressed in cattle during lactation. The
Hapmap41328-BTA-66089 on BTA29 focused the fibroblast growth factor 4
Massimo Cellesi
Statistical Tools for Genomic-Wide Studies
Tesi di Dottorato in Scienze dei Sistemi Agrari e Forestali e delle Produzioni Alimentari
Scienze e Tecnologie Zootecniche – Università degli Studi di Sassari
80
(FGF4) gene. Hayes et al. (2009a) speculate about the presence of a QTL for
MY in BTA29 asserting that the strongest candidate gene for harboring a
mutation affecting the trait was FGF4. Also Pryce et al. (2010) considered this
region like an area for further investigation in Holstein and Jersey cattle
breeds. Indeed, during mammary gland morphogenesis and involution this
gene regulates the apoptosis and induces the end of lactation (Monks and
Henson 2009). Using MDA two new intriguing QTLs not previously associated
to milk production traits were detected. On BTA2 the marker ARS-BFGL-N GS110442 was significantly associated with FY. This marker is located at 137 Mb
where the phospholipase A2 gene cluster containing the phospholipase A2,
group IIA (platelets, synovial fluid) (PLA2G2) maps. This gene cluster encodes
for a group of enzymes involved in the hydrolysis of phospholipids into fatty
acids and other lipophilic molecules. The expression level of transcripts varied
between dry period and lactation in mammary gland (Golik et al. 2006).
On BTA24 two significant markers, the BTB-00885200 and BTB-00885058
were associated with MY. These SNPs were positioned close the Aquaporin 4
(AQP4) gene. Aquaporins (AQPs) is a family of ubiquitous membrane proteins
involved in the transport of water and a wide range of solutes (Gomes et al.
2009). Recently, a functional role for AQP1, AQP3, AQP4, AQP5 and AQP7
during the production and secretion of bovine milk was confirmed in an
immunohistochemical study conducted by Mobasheri et al. (2011). Therefore,
on the basis of results of the present study and of previous investigations,
PLA2G2 and AQP4 could be considered as potential candidate genes for dairy
traits in cattle.
In the present work, as in many previous studies (Pryce et al. 2010, Mai et al.
2010, Smaragdov 2006), 266 SNPs showing significant effects on more than
one trait have been detected. The genetic correlation can be the result of
Massimo Cellesi
Statistical Tools for Genomic-Wide Studies
Tesi di Dottorato in Scienze dei Sistemi Agrari e Forestali e delle Produzioni Alimentari
Scienze e Tecnologie Zootecniche – Università degli Studi di Sassari
81
pleiotropic effects of single QTL affecting more than one trait or of linkage
disequilibrium between two or more QTLs each affecting one trait only
(Bolormaa et al. 2010). Therefore, the pleiotropic action of QTLs should be
considered when animal will be selected for a particular breeding goal. More
detailed investigations, such the use of much denser marker map, will be
necessary to move from the marker associations toward the discovery of
causal mutations underlying economically important traits in dairy cattle.
Materials and Methods
The data
Data consisted of SNPs genotypes belonging to 2,093 Italian Holstein bulls,
born between 1979 and 2007. Animals were genotyped with the Illumina 50K
BeadChip. Only SNPs located in the 29 autosomes, with a call rate higher than
2.5% were retained for the analysis. Missing genotypes in each single SNP
were imputed according to the most frequent allele at that locus. After
editing, 49,933 SNPs were retained. Genotypes were coded as the number of
copies of one SNP allele it carries, i.e. 0 and 2 for homozygous alleles, 1 for
heterozygous alleles. Phenotypes were polygenic estimated breeding values
for milk yield (MY), protein yield (PY) fat yield (FY), fat percentage (FP) and
protein percentage (PP) supplied by the Italian Holstein Association (ANAFI).
The MDA method
MDA is an empirical method based on the comparison of the genotypic
frequencies recorded in two different groups of animals ranked according to a
particular trait (T).
Massimo Cellesi
Statistical Tools for Genomic-Wide Studies
Tesi di Dottorato in Scienze dei Sistemi Agrari e Forestali e delle Produzioni Alimentari
Scienze e Tecnologie Zootecniche – Università degli Studi di Sassari
82
Let n the number of animals in whole data set (A) and S a subset containing p
individuals (p < n) randomly sampled from A. The MDA starts by sorting
animals in S according to T. Two groups, each with pbw individuals (pbw << p)
are then selected from S. They consist of the top (B) and bottom (W) ranked
animals. B and W are, therefore, two disjoint subsets of S which contain
animals with a different genetic merit for T. Thus animals belonging to B and
W should be genetically more similar within each group than between groups.
The next step is the calculation of the genotypic frequencies for each SNP,
both in B and W, and the identification of the genotype having the largest
frequency (fB) of animals in B . The maximum difference is then calculated as
the difference between fB and the frequency of the same genotype in W (fW).
An example is reported in (Table 5). SNP1 has the maximum frequency for the
genotype 2 (fB= 58), while in W, the frequency of the same genotype is fW=
26. Thirty-two represents the maximum difference (MD) between the
genotypic frequencies for the SNP1
MD = f B − fW = 58 − 26 = 32
Table 5 Genotypic frequencies evaluated both for SNP in best (B) and worst (W) subset. The
maximum difference (MD) between genotypic frequencies in B and W is also reported.
Subset
B
W
Genotype
Snp1
Snp2
Snp3
Snp4
…
0
12
78
20
40
…
1
30
20
65
38
…
2
58
2
15
22
…
0
20
40
25
75
…
1
54
51
65
15
…
2
26
9
10
10
…
MD
32
36
0
-35
…
Massimo Cellesi
Statistical Tools for Genomic-Wide Studies
Tesi di Dottorato in Scienze dei Sistemi Agrari e Forestali e delle Produzioni Alimentari
Scienze e Tecnologie Zootecniche – Università degli Studi di Sassari
83
A marker i, located on autosome k with a large value for MDi,k (max value
equal to pbw) is considered a putative candidate for association with T. Low or
negative MD values may indicate that the locus is not involved the genetic
determinism of the trait (genotypic frequencies fB and fW are similar) or that
the predominant allelic combination at that locus is not favorable for T. After
standardization, according to MD mean and standard deviation of the k-th
chromosome, MDk,i can be considered a random variable approximately
normally distributed with mean zero and standard deviation 1. In the present
paper, a marker was declared positively associated with T if its standardized
MDk,i value was greater than 1.66.
A test for possible false positive associations of candidate SNPs found in the
previous step was then developed by using a bootstrap resampling procedure
without replacement. The size of the S subset was fixed at p=1,500 whereas
the dimension of both B and W groups was set at pbw=100. For each marker,
N=10,000 randomly subset S were generated by resampling and the MDA was
calculated each time. At the end of the resampling procedure, a frequency
value, fi, was calculated for each SNP. This value indicates how many times a
marker was flagged as associated to T (MD >1.66) in the bootstrap procedure.
The posterior probability (pboot) of association between T and the ith marker
was the calculated as:
pboot i =
fi
N
A level of 0.95 of significance for pboot, was considered indicating association
between markers and traits.
The MDA procedure was applied on whole genome and to the goodness of
method was mainly evaluated performing the analysis on four chromosomes
(BTA6, BTA11, BTA14 and BTA20) known to harbor genes affecting milk
production traits. Results obtained confirmed the effectiveness of the MDA
Massimo Cellesi
Statistical Tools for Genomic-Wide Studies
Tesi di Dottorato in Scienze dei Sistemi Agrari e Forestali e delle Produzioni Alimentari
Scienze e Tecnologie Zootecniche – Università degli Studi di Sassari
84
procedure.
The
Baylor
release
BTAU_4.0
assembly,
(http://genome.ucsc.edu/cgi-bin/hgGateway?org=cow) was used to locate
the genes position and detected SNPs were considered associated to a gene if
the locus was contained within a window of 250 Kb upstream and
downstream the marker position.
Conclusions
MDA is a new empirical method able to discover associations between SNPs
and quantitative traits. This technique was applied on a population of Italian
Holstein bulls born between 1979 and 2007. Some among selected SNPs were
detected close to well-known genes that affect milk production traits.
Moreover, the MDA detected numerous markers in common with other
association studies. These results confirmed that the MDA should be used to
perform GWAS analysis.
Massimo Cellesi
Statistical Tools for Genomic-Wide Studies
Tesi di Dottorato in Scienze dei Sistemi Agrari e Forestali e delle Produzioni Alimentari
Scienze e Tecnologie Zootecniche – Università degli Studi di Sassari
85
References
•
Ashwell MS, Heyen DW, Sonstegard TS, et al. (2004) Detection of QTL
affecting milk production, health and reproductive traits in Holstein
cattle. J Dairy Sci 87: 468-475.
•
Baldin DJ (2006) A tutorial on statistical methods for population
association studies. Nat Rev Genet 7: 781-791.
•
Bennewitz J, Reinsch N, Grohs C, Levéziel H, Malafosse A, Thomsen H, Xu
N, Looft C, Kühn C, Brockmann GA, et al (2003) Combined analysis of
data from two granddaughter designs: a simple Multivariate analysis of a
genome-wide association study in dairy cattle strategy for QTL
confirmation and increasing experimental power in dairy cattle. Genet
Sel Evol 35: 319-338.
•
Blott S, Kim J-J, Moisio S, Schmidt-Kuntzel A, Cornet A, et al. (2003)
Molecular dissection of a quantitative trait locus: a phenylalanine-totyrosine substitution in the transmembrane domain of the Bovine
growth hormone receptor is associated with a major effect on milk yield
and composition. Genetics, 163: 253-266.
•
Boettcher PJ, Caroli A, Stella A, Chessa S, Budelli E, et al. (2004) Effects of
casein haplotypes on milk production traits in Italian Holstein and Brown
Swiss cattle. J Dairy Sci 87: 4311-4317.
•
Bolormaa S, Pyerce JE, Hayes BJ, Goddard ME (2010) Multivariate
analysis of a genome-wide association study in dairy cattle. J Dairy Sci 93:
3818-33.
•
Buitenhuis AJ, Sundekilde UK, Poulsen NA, Bertram HC, Larsen LB,
Sørensen P (2013). Estimation of genetic parameters and detection of
quantitative trait loci for metabolites in Danish Holstein milk. J. Dairy Sci.
96: 3285-95.
Massimo Cellesi
Statistical Tools for Genomic-Wide Studies
Tesi di Dottorato in Scienze dei Sistemi Agrari e Forestali e delle Produzioni Alimentari
Scienze e Tecnologie Zootecniche – Università degli Studi di Sassari
86
•
Chamberlain AJ, Hayes BJ, Savin K, Bolormaa S, McPartlan HC, Bowman
PJ, Van Der Jagt C, MacEachern S Goddard ME (2012) Validation of single
nucleotide polymorphisms associated with milk production traits in dairy
cattle. J. Dairy Sci. 95: 864–875.
•
Choen-Zinder M, Seroussi E, Larkin DM, Loor JJ, Everts-van der Wind A,
et al. (2005) Identification of a missense mutation in the bovine ABCG2
gene with a major effect on the QTL on chromosome 6 affecting milk
yield and composition in Holstein cattle. Genome Res 15: 936-944.
•
Churchill GA,
Doerge RW (1994) Empirical threshold values for
quantitative trait mapping. Genetics 138: 963-971.
•
Cohen M, Reichenstein M, Everts-Van der Wind A, Heon-Lee J, Shani M,
Lewin H A, Weller JI, Ron M, Seroussi E (2004) Cloning and
characterization of FAM13A1—a gene near a milk protein QTL on BTA6:
evidence for population-wide linkage disequilibrium in Israeli Holsteins.
Genomics 84: 374-383.
•
Cole J, Wiggans G, Ma L, Sonstegard T, Lawlor T, Crooker B, et al. (2011).
Genome-wide association analysis of thirty one production, health,
reproduction and body conformation traits in contemporary US Holstein
cows. BMC Genom 12: 408.
•
Cole JB, Van Raden PM, O’Connell JR, Tassell CPV., Sonstegard TS,
Schnabel RD, Taylor JF, Wiggans JR (2009) Distribution and location of
genetic effects for dairy traits. J Dairy Sci 92: 2931-2946.
•
Flori L, Fritz S, Jaffrézic F, Boussaha M, Gut I, Heath S, Foulley JL, Gautier
M (2009). The genome response to artificial selection: a case study in
dairy cattle. PLoS One 4, e6595.
•
Gil FMM, Souza FRP, de Camargo GMF, Fonseca PDS, Cardoso DF,
Aspilqueta-Boequis RR, Stefani G, Tonhati H (2011) Association between
Massimo Cellesi
Statistical Tools for Genomic-Wide Studies
Tesi di Dottorato in Scienze dei Sistemi Agrari e Forestali e delle Produzioni Alimentari
Scienze e Tecnologie Zootecniche – Università degli Studi di Sassari
87
the ghrelin gene with milk production traits in Murrah buffaloes (bubalus
bubalis). J Anim Sci 89: 708.
•
Golik M, Cohen-Zinder M, Loor JJ, Drackley JK, Band MR, Lewin HA,
Weller JI, Ron M, Seroussi E (2006) Accelerated expansion of group IIDlike phospholipase A2 genes in Bos Taurus. Genomics 87:527–533.
•
Gomes D, Agasse A, Thiebaud P, Dierot S, Geros H and Chumont F (2009)
Aquaporins are multifunctional water and solute transporters highly
divergent in living organisms. Biochim Biophys Act 1788: 1213-1228.
•
Gray KA, Maltecca C, Bagnato A, Dolezal M, Rossoni A, et al. (2012).
Estimates of marker effects for measures of milk flow in the Italian
brown Swiss dairy cattle population. BMC Vet Res, 8: 199.
•
Grisart B, Coppieters W, Farnir F, Karim L, Ford C, Berzi P, Cambisano N,
Mni M, Reid S, Simon P, Spelman R, Georges M, Snell R (2002) Positional
Candidate Cloning of a QTL in Dairy Cattle: Identification of a Missense
Mutation in the Bovine DGAT1 Gene with Major Effect on Milk Yield and
Composition. Genome Res 12: 222–231.
•
Hayes
BJ, Chamberlain AJ, Maceachern S, Savin K, McPartlan H,
MacLeod I, Sethuraman L, Goddard ME (2009b). A genome map of
divergent artificial selection between Bos taurus dairy cattle and Bos
taurus beef cattle. Anim Genet 40: 176-184.
•
Hayes BJ, Bowmann PJ, Chamberlain AJ, Savin K, van Tassell CP,
Sonstegard TS,
Goddard ME (2009a)
A validated genome-wide
association study to breed cattle adapted to an environment alterated
by climate change. PloS ONE 4:e6676.
•
Hayes BJ, Goddard M. (2010). Genome-wide association and genomic
selection in animal breeding. Genome 53: 876-883.
•
Hayes BJ, Pryce J, Chamberlain AJ, Bowman PJ Goddard ME (2010)
Genetic Architecture of Complex Traits and Accuracy of Genomic
Massimo Cellesi
Statistical Tools for Genomic-Wide Studies
Tesi di Dottorato in Scienze dei Sistemi Agrari e Forestali e delle Produzioni Alimentari
Scienze e Tecnologie Zootecniche – Università degli Studi di Sassari
88
Prediction: Coat Colour, Milk-Fat Percentage, and Type in Holstein Cattle
as Contrasting Model Traits. PLoS Genet 6: e1001139.
•
Heyen DW, Weller JI, Ron M, et al. (1999) A genome scan for QTL
influencing milk production and health traits in dairy cattle. Physiol
Genome 1: 165-175.
•
Jiang L, Liu J, Sun D, Ma P, Ding X, Yu Y, Zhang Q (2010) Genome wide
association studies for milk production traits in Chinese Holstein
population. PLoS One 5:e13661.
•
Kaupe B, Brandt H, Prinzenberg EM and G Erhardt (2007) Joint analysis
of the influence of CY11B1 and DGAT1 genetic variation on milk
production , somatic cel score, conformation, reproduction and
productive lifespan in German Holstein cattle. J Anim Sci 85: 11-21.
•
Khatkar MS, Thomson PC, Tammen I, Raadsma HW (2004) Quantitative
trait loci mapping in dairy cattle: review and meta-analysis. Genet Sel
Evol 36: 163–190.
•
Kolbehdari D, Wang Z, Grant JR, Murdoch B, Prasad A, Xiu Z, Marques E,
Stothard P, Moore SS (2009) A whole genome scan to map QTL for milk
production traits and somatic cell score in Canadian Holstein bulls. J
Anim Breed Genet 126:216–227.
•
Kowalewska-Luczak I, Szenbek M, Kulig H (2011) Ghrelin gene
polymorphism in dairy cattle. J Central Europ Agric 12: 744-751.
•
Lemay DG, Lynn DJ , Martin WF, Neville MC, Casey TM, Rincon G,
Kriventseva EV, et al. (2009) The bovine lactation genome: insights into
the evolution of mammalian milk. Genome Biol 10: R43 1-18.
•
Lunden A, Nilsson M, Janson L (1997) Marked effect of beta-lactoglobulin
polymorphism on the ratio of casein to total protein milk. J Dairy Sci 80:
2996-3005.
Massimo Cellesi
Statistical Tools for Genomic-Wide Studies
Tesi di Dottorato in Scienze dei Sistemi Agrari e Forestali e delle Produzioni Alimentari
Scienze e Tecnologie Zootecniche – Università degli Studi di Sassari
89
•
Ma L, Wiggans GR, Wang S, Sonstegard TS, Yang J et al. (2012) Effect of
sample stratification on dairy GWAS results. BMC Genomics 13:536.
•
Mai MD, Sahana G, Christiansen FB, Guldbrandtsen B (2010) A genomewide association study for milk production traits in Danish Jersey cattle. J
Anim Sci 88: 3522-3528.
•
Meredith BK, Kearney FJ, Finlay EK, Bradley DG, Fahey AG, Berry DP,
Lynn DJ (2012) Genome-wide associations for milk production and
somatic cell score in Holstein-Friesian cattle in Ireland. BMC Genet 13:21
•
Mobasheri A, Kendall BH, Maxwell JE, Sawran AV, German AJ, Marples D,
Luck MR, Royal MD (2011) Cellular localization of aquaporins along the
secretory pathway of the lactating bovine mammary gland: an
immunohistochemical study. Acta Histochem 113:137-49.
•
Monks J, Henson PM (2009). Differentiation of the mammary epithelial
cell during involution: implications for breast cancer. J Mammary Gland
Biol Neoplasia 14: 159-170.
•
Morota G, Koyama M, Rosa GJ, Weigel KA, Gianola D (2013) Predicting
complex traits using a diffusion kernel on genetic markers with an
application to dairy cattle and wheat data. Genet Sel Evol 45: 17.
•
Ogorevc J, Kunej T, Razpet A, Dovc P (2009) Database of cattle candidate
genes and genetic markers for milk production and mastitis Anim Genet
40: 832-851.
•
Olsen HG, Liens S, Svedsen H, Nilsen H, Roseth A, Opsal aasland M and
THE Mewissen (2004) Fine mapping of milk production QTL on BTA6 by
combined linkage and linkage disequilibrium analysis. J Dairy Sci 87: 690698.
•
Plante Y, Gison JP, Nadesalingam J, et al. (2001) Detection of QTL
affecting milk production traits on 10 chromosomes in Holstein cattle. J
Dairy Sci 84: 1516-1524.
Massimo Cellesi
Statistical Tools for Genomic-Wide Studies
Tesi di Dottorato in Scienze dei Sistemi Agrari e Forestali e delle Produzioni Alimentari
Scienze e Tecnologie Zootecniche – Università degli Studi di Sassari
90
•
Platt A, Vilhjálmsson BJ, Nordborg M (2010) Conditions under which
genome-wide association studies will be positively misleading. Genetics
186: 1045-1052.
•
Pryce JE, Bolormaa S, Chamberlain AJ, Bowman PJ, Savin K, Goddard ME,
Hayes BJ (2010) A validated genome-wide association study in 2 dairy
cattle breeds for milk production and fertility traits using variable length
haplotypes. J Dairy Sci 93:3331-3345.
•
Qanbari S, Pimentel ECG, Tetens J, Thaller G, Lichtner P, Sharifi AR,
Simianer H (2010). A genome‐wide scan for signatures of recent
selection in Holstein cattle. Anim Genet 41: 377-389.
•
Ron M, Weller JI (2007) From QTL to QTN identification in livestock –
winning by points rather than knock-out: a review. Anim Genet 38:429–
439.
•
Schmitz G, Langmann T, Heimer D (2001) Role of ABCG1 and other ABCG
family members in lipid metabolism. J Lipid Res 49: 1513–1520.
•
Schnabel RB, Kim JJ, Aswell MS, Sonstegard TS, van Tassell CP, Connor
EE, Taylor JF (2005) Fine-mapping milk production quantitative trait loci
on BTA6: Analysis of the bovine osteopontin gene. PNAS 102: 6896-6901.
•
Smaragdov M (2006) Genetic mapping of loci responsible for milk
production traits in dairy cattle. Russ J Genet 42:1-15.
•
Stephens M, Balding DJ (2009) Bayesian statistical methods for genetic
association studies. Nat Rev Genet 10: 681-690.
•
Strickland P, Shin GC, Plump A, Tessier-Lavigne M, Hinck L (2006) Slit2
and netrin 1 act synergistically as adhesive cues to generate tubular bilayers during ductal morphogenesis. Development 133: 823-832
•
van Binsbergen R, Veerkamp RF, Calus MPL (2012) Makeup of the
genetic correlation between milk production traits using genome-wide
single nucleotide polymorphism information. J Dairy Sci 95: 2132-2143.
Massimo Cellesi
Statistical Tools for Genomic-Wide Studies
Tesi di Dottorato in Scienze dei Sistemi Agrari e Forestali e delle Produzioni Alimentari
Scienze e Tecnologie Zootecniche – Università degli Studi di Sassari
91
•
Viitala SM, Schulmann NF, de Koning DJ, Elo K, Kinos R, Virta A, Virta J,
Maki-Tanila A, Vilkki JH (2003) Quantitative trait loci affecting milk
production traits in Finnish Ayrshire dairy cattle. J Dairy Sci 86: 18281836.
•
Viturro E, Farke C, Meyer HHD, Albrecht C (2006) Identification,
Sequence Analysis and mRNA Tissue Distribution of the Bovine Sterol
Transporters ABCG5 and ABCG8. J Dairy Sci 89:553–561.
•
Wang X, Wurmser C, Paush H, Jung S, Reinhardt F, Tetens J, Thaller G and
R Fries (2012) Identification and dissection of four major QTL affecting
milk fat cintent in the German Holstein- Friesian population. PloS One 7:
e40711.
•
Weikard R, Widmann P, Buitkamp J, Emmerling R, Kuehn C (2012)
Revisiting the quantitative trait loci for milk production traits on BTA6.
Anim Genet 43: 318-23.
•
Yang J, Benyamin B, McEvoy BP, Gordon S, Henders AK, Nyholt DR, .et
al. (2010) Common SNPs explain a large proportion of the heritability for
human height. Nat Genet 42: 565-569.
•
Zhang JL, Zan LS, Fang P, Zhang F, Shen G, Tian WQ (2007) Genetic
variation of PRLR gene and association with milk performance traits in
dairy cattle. Can J Anim Sci 88: 33-39.
Massimo Cellesi
Statistical Tools for Genomic-Wide Studies
Tesi di Dottorato in Scienze dei Sistemi Agrari e Forestali e delle Produzioni Alimentari
Scienze e Tecnologie Zootecniche – Università degli Studi di Sassari
Chapter 5
Prediction of direct genomic values by using
a restricted pool of SNP selected by maximum
difference analysis
Statistical Tools for Genomic-Wide Studies
Tesi di Dottorato in Scienze dei Sistemi Agrari e Forestali e delle Produzioni Alimentari
Scienze e Tecnologie Zootecniche – Università degli Studi di Sassari
Massimo Cellesi
93
Introduction
In the last few years, several national breeding organizations have implemented genomic
selection (GS) programmes for dairy cattle. Expected results are an acceleration in the
breeding cycle and a gain in reliability of the genomic breeding value (GEBV) estimation (Van
Raden and Sullivan 2010) compared to traditional EBV. However, genotyping costs and
computational difficulties are two of the most important constraints that limit a wider
diffusion of the GS. Several researches demonstrated that accuracy of genomic predictions
strongly depend on the size of the training population (TP) that should be as large as
possible (Goddard and Hayes 2009), and on the SNP platform density (Solberg et al. 2008,
Habier et al. 2009). Actually, the Illumina 50K BeadChip high-density platform (HDP), is the
most widely used chip in bovine GS programs. Costs for genotyping in a large population are,
however, still high and become prohibitive when HDPs are used to genotype animals
belonging to species as chicken, rabbit or sheep whose individuals have a lower economic
importance. Moreover, the combination of a large genotyped population size and a high
number of SNP variables requires huge amount of computer resources and long
computational time.
Most of these problems could be partially overcome by using a reduced number of markers
able to produce genomic predictions with good reliabilities. Actually, some low density SNP
panels (LDP), cheaper than the 50K chip, are commercially available (the Illumina Bovine3K
Genotyping BeadChip or the Illumina BovineLD Bead-Chip, for example) (Boichard et al.
2012). These panels have offered new opportunities to increase the number of animals
involved in genomic selection programs. The resulting GEBV reliabilities are, however, lower
than accuracies obtained by using the 50K platform (Solberg et al. 2008, Habier et al. 2009).
For this reason, genotypes obtained from a commercial LDP are usually imputed to HDP by
using suitable algorithms. Dimauro et al. (2013), for example, obtained up to 95% of
reliability in DGV evaluation by using data imputed from the 7K to the 50K Illumina’s chips for
milk, protein and fat yield in Italian Holstein bulls. In a similar scenario, Segelke et al. (2012)
Massimo Cellesi
Statistical Tools for Genomic-Wide Studies
Tesi di Dottorato in Scienze dei Sistemi Agrari e Forestali e delle Produzioni Alimentari
Scienze e Tecnologie Zootecniche – Università degli Studi di Sassari
94
reported a negligible reduction in reliability of genomic predictions, averaged over 12 traits,
of around 1% by using the Beagle package (Browning and Browning, 2009).
Several authors have proposed different strategies to select, for each trait under study, a
suitable restricted pool of SNP from a HDP. This approach should assure that the pool of
selected markers is the smallest as possible and that it is specific for the population and the
trait under study. Vazquez et al. (2010), starting from the 50K Illumina’s BeadChip, selected
several SNP subsets that could be used to develop a LDP. Two strategies were adopted. In
the first, evenly spaced SNP across the genome were selected; in the second, “best” SNP
were chosen on the basis of their estimated effects on six traits of economic interest. Results
indicated that LDP including “best” SNP outperformed predictions based on evenly spaced
SNP. With 2,000 “best” SNP, the 95% of the predictive ability provided by the HDP was
reached. Similar results were obtained by Zhang et al. (2011) who exploited simulated data
to obtain the best combination of the number of SNP in LDP and the effective population size
to respect a specific trait. As before 95% of reliability obtained by using an HDP was reached
with the “best” combination.
In the present research, an alternative strategy for selecting a reduced number of SNP
significantly associated with some traits from a HDP, is developed. The method was called
Maximum Difference Analysis (MDA) and the association with traits was assessed on the
basis of the differences between the genotypic frequencies of each SNP. The selected
markers could be used to produce a custom low cost breed-specific assay to genotype
animals involved in GS programs.
Aim of this work was 1) to assess the ability of MDA to detect SNP significantly associated
with five productive traits, 2) to compare the direct genomic value (DGV) of the involved
animals obtained by using both the MDA selected markers and the full original marker set.
Massimo Cellesi
Statistical Tools for Genomic-Wide Studies
Tesi di Dottorato in Scienze dei Sistemi Agrari e Forestali e delle Produzioni Alimentari
Scienze e Tecnologie Zootecniche – Università degli Studi di Sassari
95
Materials and methods
The data
Data consisted of SNP genotypes belonging to 2,054 Italian Holstein bulls genotyped with the
Illumina’s 50K BeadChip. Genotypes were generated into two research projects: SELMOL and
PROZOO, funded by the Italian Ministry of Agriculture and Fondazione CARIPLO, respectively.
Animals were ranked according with age: the 204 youngest bulls were flagged as prediction
population (PP), whereas the remaining animals were considered as training population (TP).
PP animals were excluded from the original dataset and used only in the direct genomic
value (DGV) evaluation. Only markers located on the 29 autosomes were considered. Non
mapped SNP, monomorfic markers and SNP with more than 2.5% missing values were
removed. At the end of the data editing 39,555 SNP were retained. Missing genotypes at
each single locus were imputed according to the most frequent allele. Genotypes were coded
as the number of copies of one SNP allele it carries, i.e. 0 (homozygous for allele A), 1
(heterozygous) or 2 (homozygous for allele B). Phenotypes were deregressed proofs for milk
(MY), fat (FY) and protein (PY) yield, fat (F%) and protein (P%) percentage calculated by the
Italian Holstein Association (ANAFI)
The MDA approach
MDA is an empirical method based on the comparison of the genotypic frequencies recorded
in two different groups of individuals selected to respect a particular trait T.
Let n the number of the involved animals and S a subset containing p-animals (p < n)
randomly selected from n. The MDA starts with the sorting of S animals by T. Two groups,
each with pb individuals (pb << p) are selected. The first group, named best (B), consists of
the top ranked animals for T. On the contrary, the second group, named worst (W), contains
individuals with the lowest values of T. B and W are, therefore, two disjoint subsets of S and
the two groups contain animals whose T values are very different. As a consequence, we
assume that animals belonging to B and W are genetically more similar within groups than
Massimo Cellesi
Statistical Tools for Genomic-Wide Studies
Tesi di Dottorato in Scienze dei Sistemi Agrari e Forestali e delle Produzioni Alimentari
Scienze e Tecnologie Zootecniche – Università degli Studi di Sassari
96
between groups. In other words, B and W bulls should have allele combinations positively (B)
or negatively (W) associated with the trait under study, respectively. To detect positively
(P_SNP) and negatively (N_SNP) associated markers, the genotypic frequencies for each SNP
are calculated both in B and W, respectively, and then compared. Table 1 shows an example
of genotypic frequencies evaluated for some markers.
Table 1 Genotypic frequencies evaluated both for best (B) and worst (W) dataset. The maximum
difference (MD) between genotypic frequencies in B and W is also reported.
Subset
B
W
Genotype
0
1
2
0
1
2
MD
Snp1
12
30
58
20
54
26
32
Snp2
78
20
2
40
51
9
36
Snp3
20
65
15
25
65
10
0
Snp4
40
38
22
75
15
10
-35
…
…
…
…
…
…
…
…
P_SNP for a particular T are detected by considering, for each marker, the maximum
genotypic frequency in B. For SNP1 (Table 1), for example, the maximum frequency, fB= 58, is
obtained for genotype=2. In W, for the same genotype=2, the frequency is fW= 26. The
difference MD1 = fB- fW = 32 represents the maximum difference (MD) between the
genotypic frequencies for the SNP1. The MDs were evaluated for each SNP into a
chromosome and for all chromosomes. MD can be considered a random variable
approximately normally distributed and, after standardization within each chromosome, with
mean zero and standard deviation one. Markers with high MD (max value equal to pb) are
considered as P_SNP, whereas markers with low or negative MD indicate that the marker
does not positively influence T. The i-th marker is considered positively associated with T if its
MDi value is greater than 1,66. A test for possible false positive associations is then
developed by using a bootstrap procedure to generate a posterior probability distribution.
The original animals are N=10,000 times resampled. At each resample, the subset S which
contains p <n individuals, is generated. In the present study, p was fixed equal to 1,220 and
pb equal to 100. The MDA procedure was run on all the 10,000 S-subsets and SNP with MDi
Massimo Cellesi
Statistical Tools for Genomic-Wide Studies
Tesi di Dottorato in Scienze dei Sistemi Agrari e Forestali e delle Produzioni Alimentari
Scienze e Tecnologie Zootecniche – Università degli Studi di Sassari
97
>1,66 were retained. At the end of the resampling procedure, a frequency value (fi) was
assigned to each SNP. This value indicated how many times a marker was flagged as a P_SNP
in the bootstrap procedure. The posterior probability (pboot) of association between T and
the i-th marker is calculated as:
pbooti =
fi
N
At the end of the procedure only the P_SNP with a pboot greater than 0.80 were retained.
To select the N_SNP associated with T, the MDA was completely redeveloped simply
changing the group where the MD is evaluated. In other words, if we consider the former
example (Table 1), for SNP1 in W, the maximum frequency, fW= 54, is obtained for
genotype=1. In B, for the same genotype=1, the frequency is fB= 30. The MD value fW-fB =
24 is calculated and the entire MDA procedure is repeated. At the end, a pool of N_SNP is
selected.
Direct genomic value evaluation
DGV for milk, fat and protein yield, fat and protein content were calculated using both the
about 40K original markers and the P_SNP+N_SNP selected in the MDA procedure. Effects of
SNP markers on phenotypes in the TP population were estimated by using the following
BLUP model:
y =1µ + Xg + e
where y is the vector of the deregressed proofs, 1s is a vector of ones, µ is the overall mean,
X is the matrix of SNP genotypes, g is the vector of SNP regression coefficients treated as
random, and e is the vector of random residuals. The overall mean (µ) and the vector (ĝ) of
the marker effects estimated in the TP were used to calculate the DGV for PP as:
ŷ = X*gˆ
Massimo Cellesi
Statistical Tools for Genomic-Wide Studies
Tesi di Dottorato in Scienze dei Sistemi Agrari e Forestali e delle Produzioni Alimentari
Scienze e Tecnologie Zootecniche – Università degli Studi di Sassari
98
where ŷ is the vector of estimated DGV and X* is the matrix of SNP genotypes in PP. For each
phenotype, the DGV for the PP was evaluated by using both all original markers and the
P_SNP+N_SNP. Moreover, a number of evenly spaced markers equal to the MDA selected
SNP were chosen across the entire genome. These SNP were used to evaluate the DGV of the
PP to test the goodness of MDA SNP selection. Accuracies in DGV predictions were assessed
calculating the Pearson correlations between the evaluated DGVs and the original
deregressed proofs.
Results
Results of the MDA procedure are reported in Table 2 where, for each T, the selected P_SNP,
N_SNP and their common markers into traits are displayed. Moreover, some identically
markers were detected among two or more traits and, considering them only one time, the
little number of 2,213 different markers were selected for all the involved traits.
Table 2 Number of MDA selected markers positively (P_SNP) and negatively (N_SNP) associated to each trait.
The number of SNPs associated both positively and negatively (P_SNP+N_SNP) and the number of common
SNPs between P_SPN and N_SNP are also displayed for each trait.
Trait
P_SNP
N_SNP
P_SNP+N_SNP
Common SNP
Milk yield
Fat yield
478
346
763
61
300
297
557
40
Protein yield
512
377
823
66
Fat %
215
210
380
45
Protein %
286
264
515
35
DGV accuracies for the PP evaluated by using all markers (All_SNP) of the chip after editing,
the MDA selected SNP and an equal number of evenly spaced markers are displayed in Table
3.
Massimo Cellesi
Statistical Tools for Genomic-Wide Studies
Tesi di Dottorato in Scienze dei Sistemi Agrari e Forestali e delle Produzioni Alimentari
Scienze e Tecnologie Zootecniche – Università degli Studi di Sassari
99
Table 3 Direct genomic values (DGV) accuracies evaluated by using the MDA selected SNP (P_SNP+N_SNP), all
the original SNP (All_SNP) and 2,200 evenly spaced SNP.
Markers
DGV accuracies for
Milk yield
Fat yield
Protein yield
Fat %
Protein %
All_SNP
0.43
0.41
0.39
0.44
0.51
P_SNP+N_SNP
0.45
0.51
0.39
0.61
0.57
Evenly spaced
0.41
0.25
0.24
0.35
0.31
For each trait, accuracies in DGV prediction for P_SNP+N_SNP were greater or nearly equal
than values obtained with All_SNP. In particular, accuracies for fat percentage and fat yield
were around 0.17 and 0.10 greater than results obtained with All_SNP, respectively. Finally,
DGV accuracies obtained by using 2,200 evenly spaced markers were lower than values
obtained both with All_SNP and P+N_SNP.
Discussion
The MDA procedure was able to select a reduced pool of associated markers for each trait.
The number of the N_SNP was nearly equal for every T, apart from for protein yield, where
the number of P_SNP was 25% greater than the number of N_SNP. Moreover, F% shows the
lowest number of both P_SNP and N_SNP respect to the number of associated markers for
the other traits. Particularly important are markers in common to P_SNP and N_SNP. These
markers have both a positive and a negative impact on the trait. All common SNP are
homozygous with genotypes, for example, AA in P_SNP and BB in N_SNP or vice-versa. In
consequence, these common SNP have a positive influence on the trait for the best animals,
negative in worst animals. Among the P_SNP+N_SNP selected for each T, several markers are
common to two or more traits and, in consequence, the total number of selected SNP is
lower than the simple sum of P_SNP+N_SNP across the traits. Our study suggests that 2,213
markers could be enough to turn out a custom LDP to genotype Italian Holstein bulls. The
obtained data could be used to evaluate the genetic merit of the involved animals to respect
Massimo Cellesi
Statistical Tools for Genomic-Wide Studies
Tesi di Dottorato in Scienze dei Sistemi Agrari e Forestali e delle Produzioni Alimentari
Scienze e Tecnologie Zootecniche – Università degli Studi di Sassari
100
the six traits used in selecting markers with the MDA procedure. This procedure could be
useful to lay out a GS program for livestock species different from bovine. First, a TP
genotyped with a HDP should be created. Then, a restricted pool of markers should be
selected by using the MDA procedure. A PP would be created by using the LDP which
contains the MDA selected markers. At the end, the overall costs of the genomic breeding
program should be reduced.
DGV accuracies obtained by using the P_SNP+N_SNP (table 3) were on average nearly equal
or, sometimes, greater than accuracies obtained by using all SNP. In particular accuracies for
fat and, partially, for protein percentage are considerably greater than values obtained with
all original SNP. Moreover, the number of P_SNP+N_SNP selected for the two percentage
traits is the lowest among the traits under study.
Conclusion
The MDA method applied to 2,054 Italian Holstein bulls selected 2,213 markers that could be
used to develop a LDP to genotype animals under selection. Accuracies of the estimated DGV
were equal or greater than accuracies obtained by using all SNP. Therefore, no SNP
imputation to a HDP is required if the MDA selected markers are used. This results in a
considerable reduction in the computational time as well as a reduction costs.
Massimo Cellesi
Statistical Tools for Genomic-Wide Studies
Tesi di Dottorato in Scienze dei Sistemi Agrari e Forestali e delle Produzioni Alimentari
Scienze e Tecnologie Zootecniche – Università degli Studi di Sassari
101
References
•
Browning BL and Browning SR (2012) A unified approach to genotype imputation and
haplotype-phase inference for large data sets of trios and unrelated individuals. Am J
Hum Genet, 84: 210–223.
•
Goddard ME and Hayes BJ (2009) Mapping genes for complex traits in domestic
animals and their use in breeding programmes. Nature Rev Genet, 10: 381–39.
•
Van Raden PM, Sullivan PG (2010) International genomic evaluation methods for dairy
cattle. Genet Sel Evol, 42: 7
•
Vazquez AI, Rosa GJM, Weigel KA, de los Campos G, Gianola D, Allison B (2010)
Predictive ability of subsets of single nucleotide polymorphisms with and without
parent average in US Holsteins. J Dairy Sci, 93: 5942–5949
•
Zhang Z, Ding X, Liu J, de Koning DJ (2011) Accuracy of genomic prediction using lowdensity panels. J Dairy Sci, 94: 3642–3650
•
Dimauro C, Steri R, Pintus MA, Gaspa G, Macciotta NPP (2011) Use of partial least
squares regression to predict single nucleotide polymorphism marker genotypes
when some animals are genotyped with a low-density panel. Animal, 5: 833–837.
•
Boichard D, Chung H, Dassonneville R, David X, Eggen A, Fritz S, Gietzen KJ, Hayes BJ,
et al. (2012) Design of a bovine low-density SNP array optimized for imputation. PLoS
One, 7: e34130.
•
Dimauro C, Cellesi M, Gaspa G, Ajmone-Marsan P, Steri R, Marras G, Macciotta NPP
(2013) Use of partial least squares regression to impute SNP genotypes in Italian
Cattle breeds. Genet Sel Evol, 45: 15.
•
Segelke D, Chen J, Liu Z, Reinhadt F, Thaller G, Reents R (2012) Reliability of genomic
prediction for German Holsteins using imputed genotypes from low-density chips. J
Dairy Sci, 95: 5403–5411.
•
Solberg TR, Sonesson AK, Woolliams JA, Meuwissen THE (2008) Genomic selection
using different marker types and densities. J Anim Sci, 86: 2447-2454.
Massimo Cellesi
Statistical Tools for Genomic-Wide Studies
Tesi di Dottorato in Scienze dei Sistemi Agrari e Forestali e delle Produzioni Alimentari
Scienze e Tecnologie Zootecniche – Università degli Studi di Sassari
102
•
Habier D, Fernando RL, Dekkers JC (2009) Genomic selection using low-density marker
panels. Genetics, 182: 343-353.
Massimo Cellesi
Statistical Tools for Genomic-Wide Studies
Tesi di Dottorato in Scienze dei Sistemi Agrari e Forestali e delle Produzioni Alimentari
Scienze e Tecnologie Zootecniche – Università degli Studi di Sassari
103
Chapter 6
Conclusions
Massimo Cellesi
Statistical Tools for Genomic-Wide Studies
Tesi di Dottorato in Scienze dei Sistemi Agrari e Forestali e delle Produzioni Alimentari
Scienze e Tecnologie Zootecniche – Università degli Studi di Sassari
104
One of the most important issues in genomic selection is the estimation of the effects of tens of
thousands of SNPs by using only few thousands of genotyped animals. Multivariate dimension
reduction techniques, such as the principal component analysis (PCA), could be an alternative
approach to other methods, such as BayesB and BayesL. Using the PCA, the contribution of each
marker is estimated taking into consideration the total SNP variance structure, whereas the
reduction of both data dimensionality and computational complexity do not decrease the
accuracy of GEBV evaluation (Macciotta et al. 2010). All PCAs start from the variance-covariance
matrix obtained from the X matrix of data. In Chapter 2, the impact of the rank of the variancecovariance matrix on GEBV accuracy is studied when the PCA technique is used to reduce the
dimensionality of the data. Results indicated that, if the variance-covariance matrix has a full
rank, the reduction of the data dimensionality by using the PCA does not worsen the accuracy of
GEBV predictions. In particular, the study evaluated the accuracy of GEBV when the number of
animals in a reference population decreased comparing two scenarios: one where the PCs were
extracted genome-wide (ALL) and another where PCs were extracted separately by
chromosome (CHR). In ALL, the GEBV accuracies became soon unsettled as the number of
animals decreased because the SNP variance-covariance matrix (S) was singular. Differently, in
CHR, the S matrix of each chromosome had a full rank and, consequently, the GEBV accuracy
remained stable as long as the number of animals remained greater than or equal to the
number of SNPs in the chromosomes. Moreover, obtained GEBV accuracies were always better
for CHR than for ALL. Results of the present study can be used to fix the size of the reference
population at a value nearly equal to the number of SNPs in the largest chromosome when the
PCA technique is used.
Another important issue that affects the genomic selection is the low number of animals
involved in selection programs. Generally, only males and elite females are genotyped by using
high-density platforms (Weigel et al. 2010). The reason is that their commercial price is high,
thus limiting their use only to animal population with high economic value, such as cattle or
swine. To increase the number of animals involved in breeding programs, cheaper low-density
Massimo Cellesi
Statistical Tools for Genomic-Wide Studies
Tesi di Dottorato in Scienze dei Sistemi Agrari e Forestali e delle Produzioni Alimentari
Scienze e Tecnologie Zootecniche – Università degli Studi di Sassari
105
panels (LDP) could be used. However, to avoid a reduction in the accuracy of GEBV estimation,
markers not present in economic chips are currently imputed to HDP. In Chapter 3, the partial
least squared regression (PLSR) is proposed to impute missing genotypes from a LDP to a HDP.
The study demonstrates that the PLSR imputation method can efficiently impute missing
genotypes from LDP to HDP and requires much less time than the commonly used methods.
The study was performed on a single-breed and on a multi-breed and tested the ability of PLSR
to impute from a LDP of 3K and 7K to a HDP with 50K SNP. In the single-breed approach, the
accuracy of imputation using PLSR was approximately 90 and 94% for the 3K and 7K platforms,
respectively; whereas the corresponding accuracies obtained with Beagle were approximately
85% and 90%. Moreover, computing time using the PLSR method was on average around 10
times lower than the computing time required by Beagle. Imputation accuracy obtained with
PLSR was lower in the multi-breed than in the single-breed data. Moreover, in the single-breed
approach, the impact of the SNP-genotype imputation on the accuracy of GEBV was small and
the correlation between estimates of genetic merit obtained by using imputed versus SNPs of
HDP was around 0.96 for the 7K chip.
In Chapter 4, a new empirical approach for GWAS is proposed. The method called Maximum
Difference Analysis (MDA) could be an alternative to the frequentist and Bayesian methods that
are usually used. MDA does not need any assumptions about genome architecture or data
distribution. The obtained results were validated by comparing them with those published in
other studies which used both frequentist and Bayesian approaches. MDA was applied to find
associations between SNP and five quantitative traits: milk, fat and protein yield and fat and
protein percentage. The MDA method was able to locate some well-known genes that affect
milk production, such as diacylglycerol O-acyltransferase 1 (DGAT1), β-lactoglobulin (BLG),
bovine casein gene cluster, and prolactin receptor (PRLR). In addition, some hardly identified
genes in other studies were located by MDA. For example, on BTA4, MDA located the CD36
molecule (thrombospondin receptor) (CD36) locus previously reported by Lemay et al. (2009) in
an analysis of genes expressed in cattle during lactation. Moreover, on BTA29, MDA identified
Massimo Cellesi
Statistical Tools for Genomic-Wide Studies
Tesi di Dottorato in Scienze dei Sistemi Agrari e Forestali e delle Produzioni Alimentari
Scienze e Tecnologie Zootecniche – Università degli Studi di Sassari
106
the fibroblast growth factor 4 (FGF4) gene. Hayes et al. (2009) speculated about the presence of
a QTL for milk yield in BTA29 asserting that the strongest candidate gene for harboring a
mutation affecting the trait was FGF4. The results demonstrated the ability of MDA to detect
associations between markers and traits.
Results obtained in Chapter 4 were then used to reduce the dimensionality of the data in a
study proposed in Chapter 5. In this research, markers selected by MDA were used to evaluate
the GEBV of the animals involved. Results indicate that accuracies obtained with the MDA
selected SNPs are comparable with and sometimes better than results obtained by using all 54K
markers. In particular, accuracies for fat percentage and fat yield were around 0.17 and 0.10
percentage units greater than the accuracy obtained with all SNPs, respectively. These results
were obtained using 380 and 555 selected SNPs for fat percentage and fat yield, respectively,
instead of the 39,555 SNPs available in HDP. The selected SNPs could be implemented in a
cheaper customized LDP that could be used instead of a HDP. The results obtained in this
chapter confirmed the goodness of MDA to select SNPs.
Massimo Cellesi
Statistical Tools for Genomic-Wide Studies
Tesi di Dottorato in Scienze dei Sistemi Agrari e Forestali e delle Produzioni Alimentari
Scienze e Tecnologie Zootecniche – Università degli Studi di Sassari
107
References
•
Hayes BJ, Bowmann PJ, Chamberlain AJ, Savin K, van Tassell CP, Sonstegard TS, Goddard
ME (2009) A validated genome-wide association study to breed cattle adapted to an
environment alterated by climate change. PloS ONE 4:e6676.
•
Lemay DG, Lynn DJ , Martin WF, Neville MC, Casey TM, Rincon G, Kriventseva EV, et al.
(2009) The bovine lactation genome: insights into the evolution of mammalian milk.
Genome Biol 10: R43 1-18.
•
Macciotta NPP, Gaspa G, Steri R, Nicolazzi EL, Dimauro C, Pieramati C, Cappio–Borlino A
(2010) Using eigenvalues as variance priors in the prediction of genomic breeding values
by principal component analysis. J. Dairy Sci, 93 :2765–2774.
•
Weigel KA, de Los Campos G, Vazquez AI, Rosa GJM, Gianola D, Van Tassell CP (2010)
Accuracy of direct genomic values derived from imputed single nucleotide polymorphism
genotypes in Jersey cattle. J Dairy Sci, 93: 5423–5435.
Massimo Cellesi
Statistical Tools for Genomic-Wide Studies
Tesi di Dottorato in Scienze dei Sistemi Agrari e Forestali e delle Produzioni Alimentari
Scienze e Tecnologie Zootecniche – Università degli Studi di Sassari
108
Supplemental material (Chapter 4)
Table S1 List of significant SNPs detected using MDA method (pboot>0.95) for milk yield (MY), fat yield (FY) protein yield( PY)
fat percentage (FP) and protein percentage (PP).
position
marker
chr
(Kp)
Hapmap52416rs29016842
1
25,183
ARS-BFGL-BAC-6737
FY
PY
1
25,510
BTA-49289-no-rs
1
25,790
BTA-49283-no-rs
1
27,135
ARS-BFGL-BAC-5834
1
31,801
BTB-01335860
1
40,996
ARS-BFGL-NGS-20360
1
41,169
BTB-01249999
PY
1
42,390
Hapmap23514-BTA150593
PY
1
53,341
Hapmap38361-BTA-93866
1
54,738
Hapmap48975-BTA-99363
Trait
MY
PY
FY
FP
1
29
1
1,480
ARS-BFGL-NGS-39992
FY
1
1,937
BTA-120704-no-rs
FY
1
2,486
ARS-BFGL-NGS-79093
1
2,581
BTB-00001612
FY
1
3,211
ARS-BFGL-NGS-108686
FY
1
4,071
BTB-01747944
MY
1
4,827
ARS-BFGL-NGS-111125
MY
1
9,576
ARS-BFGL-NGS-113570
FP
1
67,948
BTA-05186-no-rs
PY
1
10,144
Hapmap51183-BTA-19351
FP
1
76,506
ARS-BFGL-NGS-116528
PY
1
11,132
Hapmap38737-BTA-22640
FP
1
76,557
ARS-BFGL-NGS-15456
PY
1
14,322
Hapmap24335-BTA127763
PY
1
84,394
Hapmap40421-BTA-39479
MY
PY
1
84,416
ARS-BFGL-NGS-69661
MY
PY
1
14,841
BTA-28028-no-rs
PY
1
93,284
Hapmap41804-BTA-24071
MY
1
15,464
ARS-BFGL-BAC-13008
1
98,640
ARS-BFGL-NGS-96389
1
16,276
Hapmap41782-BTA-16216
1
117,880
Hapmap24434-BTA-48171
1
16,444
BTB-01084253
1
118,986
ARS-BFGL-NGS-10545
1
16,958
Hapmap60239rs29019581
FY
1
120,397
BTB-02013809
MY
1
17,455
Hapmap49012-BTA109196
FY
1
120,444
BTB-01877866
MY
121,510
BTB-00052125
MY
17,516
Hapmap48613-BTA112066
1
1
FY
1
121,532
BTB-01476130
MY
1
17,699
Hapmap44269-BTA-67047
PY
1
121,811
ARS-BFGL-BAC-13578
MY
1
23,763
Hapmap32844-BTA151959
FY
PY
1
123,610
Hapmap43795-BTA-16918
MY
1
24,040
BTB-00010021
FY
1
123,918
BTA-49414-no-rs
PY
PY
FP
MY
PY
PY
FY
PY
FY
MY
FP
FP
FY
PP
PY
Massimo Cellesi
Statistical Tools for Genomic-Wide Studies
Tesi di Dottorato in Scienze dei Sistemi Agrari e Forestali e delle Produzioni Alimentari
Scienze e Tecnologie Zootecniche – Università degli Studi di Sassari
FY
PY
PY
PP
109
1
124,766
UA-IFASA-8594
PP
1
148,854
ARS-BFGL-NGS-25873
MY
1
124,845
BTB-00055741
PP
1
148,912
ARS-BFGL-NGS-30170
1
124,989
ARS-BFGL-BAC-14851
PY
1
149,025
ARS-BFGL-BAC-12960
1
125,016
Hapmap38963-BTA-50274
PY
1
149,865
BTA-58315-no-rs
1
127,445
Hapmap41768-BTA120174
MY
1
150,396
BTB-01975281
1
150,807
ARS-BFGL-BAC-5688
1
127,680
ARS-BFGL-NGS-98257
MY
1
151,530
ARS-BFGL-NGS-105124
PY
1
128,191
ARS-BFGL-NGS-27011
MY
1
152,228
ARS-BFGL-NGS-110653
PY
1
130,259
ARS-BFGL-NGS-116868
1
153,237
ARS-BFGL-NGS-105623
PY
1
130,335
ARS-BFGL-NGS-99827
1
131,506
BTB-01662109
PP
1
153,609
Hapmap60790rs29024220
1
131,552
Hapmap38448-BTA-92131
PP
1
154,731
ARS-BFGL-NGS-45342
PY
1
131,657
Hapmap35746SCAFFOLD181011_3284
PP
1
155,843
ARS-BFGL-NGS-95240
PY
1
134,026
BTB-00059569
MY
1
157,424
Hapmap60257rs29016165
1
136,344
Hapmap35582SCAFFOLD40562_2432
MY
2
373
1
137,001
ARS-BFGL-NGS-72308
2
1,030
Hapmap55208ss46526613
1
137,924
ARS-BFGL-NGS-107390
2
2,241
ARS-BFGL-NGS-113652
1
140,707
ARS-BFGL-NGS-82122
PP
2
7,564
ARS-BFGL-NGS-90839
PY
1
141,310
ARS-BFGL-NGS-73455
PP
2
7,745
Hapmap60397ss46527095
PY
1
141,469
ARS-BFGL-NGS-14502
PY
2
8,882
ARS-BFGL-NGS-37283
1
141,510
ARS-BFGL-NGS-104662
PY
PP
2
9,505
BTB-02094616
1
142,224
Hapmap41574-BTA-54365
PY
PP
2
9,590
Hapmap43273-BTA-47993
PY
1
142,643
ARS-BFGL-NGS-22768
PP
2
11,032
BTA-23383-no-rs
PY
1
144,559
ARS-BFGL-NGS-31728
PP
2
16,525
BTB-00080812
1
145,522
ARS-BFGL-NGS-106222
PP
2
16,561
ARS-BFGL-NGS-100666
PP
1
145,578
BTB-00068200
PP
1
146,075
ARS-BFGL-NGS-82590
2
16,632
Hapmap35360SCAFFOLD145911_8451
PP
1
148,570
ARS-BFGL-NGS-65139
PY
2
17,552
BTA-49719-no-rs
1
148,765
Hapmap47854-BTA119090
PY
2
17,932
BTA-04435-no-rs
2
18,171
ARS-BFGL-NGS-24246
PP
PY
MY
FY
PY
PY
FY
PY
PY
MY
PY
PY
FY
MY
ARS-BFGL-NGS-11180
Massimo Cellesi
Statistical Tools for Genomic-Wide Studies
Tesi di Dottorato in Scienze dei Sistemi Agrari e Forestali e delle Produzioni Alimentari
Scienze e Tecnologie Zootecniche – Università degli Studi di Sassari
PP
FP
MY
PY
MY
PY
FP
MY
PY
FY
MY
PY
PY
FY
110
2
19,105
ARS-BFGL-BAC-35137
FY
2
19,202
Hapmap53232rs29020795
2
19,256
Hapmap43615-BTA-54400
2
20,045
ARS-BFGL-NGS-23300
2
20,235
Hapmap59161rs29014139
2
20,505
BTB-01112976
FY
2
20,738
BTB-00083220
FY
2
21,841
UA-IFASA-1574
FY
2
21,961
ARS-BFGL-NGS-119036
FY
2
22,381
Hapmap50971-BTA-46778
FY
2
22,512
BTB-00085286
FY
2
22,556
ARS-BFGL-NGS-32709
FY
2
26,218
Hapmap51238-BTA-46810
FY
2
26,428
Hapmap43586-BTA-46818
FY
2
26,937
BTB-00088008
2
28,144
BTB-00091356
2
35,032
BTB-00088434
2
38,338
BTA-55603-no-rs
MY
2
39,159
ARS-BFGL-NGS-28859
MY
2
40,697
ARS-BFGL-NGS-60043
2
42,702
Hapmap38483-BTA-25757
MY
2
42,771
BTB-01341517
MY
2
43,208
BTA-47440-no-rs
MY
2
43,229
Hapmap50154-BTA-91586
MY
2
43,875
BTB-01242184
MY
2
44,195
ARS-BFGL-NGS-115659
MY
2
46,284
ARS-BFGL-NGS-93283
2
48,820
Hapmap57575rs29011345
2
52,255
BTA-47682-no-rs
PY
MY
2
53,269
BTA-47612-no-rs
MY
PY
2
53,307
BTB-00098202
MY
PY
2
54,237
BTB-00098707
MY
FY
2
54,258
BTB-00098730
MY
FY
2
54,637
BTB-00098773
2
55,505
ARS-BFGL-NGS-49789
MY
2
56,762
Hapmap34718BES7_Contig295_922
MY
2
58,164
BTB-01160816
FY
2
59,718
BTA-19224-no-rs
FY
2
64,245
ARS-BFGL-NGS-109852
MY
2
65,110
ARS-BFGL-NGS-12099
MY
2
65,525
ARS-BFGL-NGS-102253
2
65,624
Hapmap39338-BTA-47826
2
66,145
ARS-BFGL-NGS-100643
MY
2
71,513
BTB-01941823
MY
2
74,662
ARS-BFGL-NGS-105719
MY
2
79,981
BTB-02066351
MY
2
80,592
BTA-48073-no-rs
MY
2
80,678
BTB-00103137
MY
2
80,701
ARS-BFGL-NGS-111158
MY
2
83,588
ARS-BFGL-NGS-38368
2
83,641
ARS-BFGL-NGS-114651
2
88,599
Hapmap47638-BTA-47957
MY
2
97,062
BTA-24303-no-rs
MY
2
98,989
ARS-BFGL-NGS-2970
2
101,231
Hapmap51953-BTA-48787
2
101,681
BTA-48456-no-rs
PP
2
101,850
Hapmap44082-BTA-48435
PP
2
101,883
ARS-BFGL-NGS-31792
PP
2
102,811
ARS-BFGL-NGS-5965
PY
FY
PP
MY
FY
FP
PY
FY
PY
FY
PY
PY
PY
FY
PY
FP
FY
PP
FP
FY
FY
PY
MY
FY
PP
MY
FP
Massimo Cellesi
Statistical Tools for Genomic-Wide Studies
Tesi di Dottorato in Scienze dei Sistemi Agrari e Forestali e delle Produzioni Alimentari
Scienze e Tecnologie Zootecniche – Università degli Studi di Sassari
FP
111
2
103,004
ARS-BFGL-NGS-107381
2
106,249
BTA-27937-no-rs
2
111,235
2
FP
3
36,915
Hapmap41054-BTA-67528
PY
FY
3
37,863
ARS-BFGL-NGS-14022
ARS-BFGL-NGS-108395
FY
3
39,299
ARS-BFGL-NGS-23295
PY
111,917
BTA-48867-no-rs
FY
3
39,339
ARS-BFGL-NGS-117495
PY
2
112,139
ARS-BFGL-NGS-82228
FY
3
40,024
ARS-BFGL-NGS-1886
PY
2
113,354
BTB-00111019
FY
3
44,394
Hapmap60335rs29018229
2
113,572
Hapmap48786-BTA-49002
FY
3
47,248
113,931
FY
Hapmap32570-BTA141315
PY
2
Hapmap59378rs29018764
3
49,688
Hapmap38207-BTA-19427
PY
2
116,200
Hapmap39834-BTA-49029
FY
3
50,463
BTA-18980-no-rs
MY
2
116,462
ARS-BFGL-NGS-274
FY
3
50,486
Hapmap42865-BTA-18979
MY
2
116,798
ARS-BFGL-NGS-12225
3
53,427
ARS-BFGL-NGS-23466
MY
2
117,480
UA-IFASA-2047
2
118,686
Hapmap43218-BTA-26258
3
54,013
Hapmap57732rs29023272
PY
2
122,549
ARS-BFGL-NGS-110996
3
56,417
Hapmap43965-BTA-89883
PY
2
127,173
ARS-BFGL-NGS-109716
3
60,237
ARS-BFGL-NGS-103935
PY
2
130,628
ARS-BFGL-NGS-118505
3
60,523
Hapmap43156-BTA112841
PY
2
131,281
ARS-BFGL-NGS-34317
FY
3
60,996
Hapmap44119-BTA-67972
PY
2
131,318
ARS-BFGL-NGS-21994
FY
2
132,409
ARS-BFGL-NGS-41994
3
61,622
Hapmap43441-BTA103289
PY
2
133,769
ARS-BFGL-NGS-36151
3
62,908
ARS-BFGL-NGS-16054
PY
2
133,982
BTA-49769-no-rs
3
65,463
BTA-68142-no-rs
PY
2
134,028
ARS-BFGL-NGS-33709
PY
3
65,706
BTB-00131364
MY
2
135,336
ARS-BFGL-NGS-110186
PY
3
65,833
BTB-01587097
MY
PY
2
135,752
BTB-01978832
PY
3
65,860
BTB-01587043
MY
PY
2
136,681
ARS-BFGL-NGS-100214
3
66,290
Hapmap51550-BTA111095
MY
2
137,038
ARS-BFGL-NGS-110442
FY
3
89,434
Hapmap47699-BTA-68564
3
7,009
BTB-01678060
FY
3
91,680
ARS-BFGL-NGS-11694
PY
3
31,193
ARS-BFGL-NGS-112694
3
93,948
Hapmap32684-BTA-89476
PY
3
33,866
ARS-BFGL-NGS-113746
MY
3
94,618
BTB-00141843
PY
3
34,191
ARS-BFGL-NGS-40213
MY
MY
PP
PP
PY
PP
PY
FP
PP
FY
PY
FP
MY
FY
PY
MY
FY
PP
FY
FY
PY
PP
Massimo Cellesi
Statistical Tools for Genomic-Wide Studies
Tesi di Dottorato in Scienze dei Sistemi Agrari e Forestali e delle Produzioni Alimentari
Scienze e Tecnologie Zootecniche – Università degli Studi di Sassari
FY
PY
FY
112
3
95,082
BTB-00143272
PY
3
125,025
ARS-BFGL-NGS-111207
MY
3
95,291
ARS-BFGL-NGS-100400
PY
3
125,046
ARS-BFGL-NGS-101315
MY
3
95,509
Hapmap41332-BTA-68635
3
125,114
ARS-BFGL-NGS-90439
MY
3
95,552
BTB-00142550
PY
3
127,818
ARS-BFGL-NGS-114675
3
95,572
BTB-00142497
PY
4
21
3
97,188
Hapmap32622-BTA155129
PY
4
5,129
ARS-BFGL-NGS-91047
FP
4
8,952
ARS-BFGL-NGS-106242
FP
3
97,233
ARS-BFGL-NGS-40591
4
14,620
BTA-70786-no-rs
MY
PY
3
97,485
ARS-BFGL-NGS-73518
4
14,645
ARS-BFGL-NGS-113152
MY
PY
3
99,280
ARS-BFGL-NGS-111451
23,086
103,040
Hapmap52129rs29016142
4
3
Hapmap33790-BTA159878
3
103,945
BTB-00147905
MY
PY
4
23,125
Hapmap27025-BTA159880
FY
3
105,270
BTB-00150138
MY
PY
4
28,917
Hapmap48233-BTA-16470
FY
3
108,063
ARS-BFGL-NGS-3713
MY
PY
4
29,093
BTB-01114634
FY
3
108,917
ARS-BFGL-NGS-32606
4
36,814
Hapmap44123-BTA-70017
PY
3
109,147
ARS-BFGL-NGS-102829
4
37,909
Hapmap34749BES4_Contig461_1146
PY
3
109,604
ARS-BFGL-NGS-118597
MY
4
40,236
BTB-01885061
PY
3
111,281
ARS-BFGL-NGS-55043
MY
3
111,321
ARS-BFGL-NGS-1038
MY
4
40,280
Hapmap24263-BTA161141
PY
3
111,371
BTB-00154062
MY
4
41,684
Hapmap43212-BTA-23629
PY
3
112,790
BTB-00148908
MY
4
42,073
BTB-00176150
3
114,946
Hapmap35089BES2_Contig293_493
FP
4
42,107
Hapmap43659-BTA-70032
4
42,909
BTB-01927917
PY
3
114,969
ARS-BFGL-NGS-66328
FP
4
43,207
BTB-00178712
PY
3
115,221
ARS-BFGL-NGS-117810
FP
4
44,482
BTA-70272-no-rs
3
115,721
ARS-BFGL-NGS-87394
4
44,896
ARS-BFGL-NGS-113663
MY
3
116,604
ARS-BFGL-NGS-34881
4
46,361
Hapmap38427-BTA-70434
MY
FY
PY
3
120,475
Hapmap56950ss46526304
4
46,393
Hapmap49715-BTA-70437
MY
FY
PY
3
120,899
ARS-BFGL-NGS-32060
4
48,626
ARS-BFGL-NGS-104842
3
122,299
ARS-BFGL-NGS-115542
4
62,192
ARS-BFGL-NGS-71481
FP
MY
FY
FY
Hapmap38667-BTA-28216
PY
PY
FY
PP
PY
PP
PY
PY
MY
PY
FY
PY
FP
PY
FP
MY
FY
PY
FY
MY
PY
Massimo Cellesi
Statistical Tools for Genomic-Wide Studies
Tesi di Dottorato in Scienze dei Sistemi Agrari e Forestali e delle Produzioni Alimentari
Scienze e Tecnologie Zootecniche – Università degli Studi di Sassari
PP
FP
113
4
63,586
BTB-00192005
FP
4
99,532
ARS-BFGL-NGS-103036
PY
4
63,721
ARS-BFGL-NGS-3438
FP
4
99,587
ARS-BFGL-NGS-13008
PY
4
63,774
BTB-00191572
FP
4
99,998
Hapmap50564-BTA110789
MY
PY
4
74,927
Hapmap42065-BTA111154
MY
4
100,994
ARS-BFGL-NGS-52947
MY
PY
4
75,091
BTB-01595788
MY
4
101,912
ARS-BFGL-NGS-77010
PY
4
75,135
BTB-01708864
MY
4
105,002
ARS-BFGL-NGS-36185
PY
4
76,782
ARS-BFGL-NGS-55672
MY
4
105,339
ARS-BFGL-NGS-25648
PY
4
78,755
ARS-BFGL-NGS-112329
MY
4
108,845
ARS-BFGL-NGS-5899
PY
4
82,824
Hapmap46191-BTA101479
MY
4
108,885
ARS-BFGL-NGS-76596
PY
4
109,186
ARS-BFGL-NGS-3479
PY
4
84,629
BTB-01497290
MY
4
111,350
ARS-BFGL-NGS-39879
PP
4
84,788
BTB-00566744
MY
4
117,784
ARS-BFGL-NGS-119857
PP
4
86,308
BTA-96855-no-rs
PY
5
1,751
ARS-BFGL-NGS-109950
MY
4
86,342
BTB-01142755
PY
5
1,792
ARS-BFGL-NGS-104371
MY
PY
4
86,402
BTA-96837-no-rs
5
1,905
BTB-01252633
MY
PY
4
87,190
BTB-01278461
5
3,785
BTB-01357570
4
87,452
BTB-01443627
4
88,270
BTB-01257567
5
3,951
Hapmap55203rs29023737
4
89,021
BTA-65916-no-rs
PY
5
12,945
BTA-23621-no-rs
4
91,593
ARS-BFGL-NGS-26218
PY
5
15,738
BTA-72768-no-rs
PY
4
94,254
ARS-BFGL-NGS-109045
PY
5
16,101
Hapmap36482SCAFFOLD163485_1458
PY
4
94,520
ARS-BFGL-NGS-118100
5
17,250
BTA-05007-rs29019174
4
95,049
ARS-BFGL-NGS-114724
5
20,301
Hapmap45956-BTA-74297
PY
4
95,125
Hapmap32136-BTA160383
5
20,328
BTA-74300-no-rs
PY
4
96,632
Hapmap25269-BTA142380
PY
5
22,523
BTA-27242-no-rs
MY
5
23,091
BTA-06872-rs29021228
MY
4
96,652
ARS-BFGL-NGS-110997
PY
5
25,064
ARS-BFGL-NGS-44305
MY
4
97,467
BTB-00203494
MY
5
25,740
ARS-BFGL-NGS-29300
MY
4
97,734
BTB-01502164
MY
5
36,496
BTB-01226567
4
99,412
ARS-BFGL-NGS-38881
MY
5
36,959
BTB-01496004
PY
PP
PY
PY
MY
PP
PP
FY
PY
FP
MY
FY
PY
MY
PY
PY
PY
FY
PY
PY
PP
PY
Massimo Cellesi
Statistical Tools for Genomic-Wide Studies
Tesi di Dottorato in Scienze dei Sistemi Agrari e Forestali e delle Produzioni Alimentari
Scienze e Tecnologie Zootecniche – Università degli Studi di Sassari
MY
114
5
39,604
BTB-00225371
5
40,261
BTB-01635088
PY
5
40,346
BTB-01832706
PY
5
45,449
ARS-BFGL-NGS-18989
5
46,500
BTB-00226702
5
46,856
BTB-01675520
5
50,023
ARS-BFGL-NGS-98210
5
50,069
ARS-BFGL-NGS-114616
5
54,953
ARS-BFGL-NGS-114918
5
58,821
BTA-54940-no-rs
PY
5
59,065
ARS-BFGL-NGS-3921
PY
5
60,764
ARS-BFGL-NGS-4763
5
64,566
Hapmap53993rs29024740
5
64,749
ARS-BFGL-NGS-5504
FY
5
70,327
ARS-BFGL-NGS-20849
FY
5
72,205
ARS-BFGL-NGS-28026
FY
5
72,980
Hapmap49622-BTA-46973
FY
5
84,392
Hapmap57435rs29016994
5
86,756
BTA-74203-no-rs
5
88,530
Hapmap49859-BTA109537
5
91,221
ARS-BFGL-NGS-71971
5
93,640
ARS-BFGL-NGS-11173
5
94,607
BTB-01602960
5
94,733
BTB-01278306
5
96,688
Hapmap50624-BTA-22932
5
97,370
Hapmap23365-BTA156277
FY
5
98,725
Hapmap33512-BTA158274
FY
5
103,348
ARS-BFGL-NGS-29237
MY
PP
MY
5
105,028
Hapmap59520rs29021624
5
105,238
Hapmap46939-BTA114206
5
108,587
ARS-BFGL-NGS-81143
5
108,769
Hapmap36373SCAFFOLD248777_1273
5
114,329
ARS-BFGL-NGS-118406
5
114,799
BTA-74965-no-rs
5
116,803
ARS-BFGL-NGS-6829
FP
5
116,877
ARS-BFGL-NGS-32908
FP
5
118,958
BTA-75110-no-rs
MY
5
119,005
Hapmap23876-BTA143610
MY
5
122,834
ARS-BFGL-NGS-78419
PY
5
123,572
ARS-BFGL-NGS-36365
PY
5
123,841
ARS-BFGL-NGS-1089
6
2
Hapmap27542-BTC062507
6
6,995
ARS-BFGL-NGS-104900
PY
6
7,962
BTB-00242529
PY
6
19,485
Hapmap57362rs29014889
MY
6
24,357
Hapmap49541-BTA-24412
MY
6
26,537
Hapmap27407-BTA143867
6
26,946
ARS-BFGL-NGS-22019
6
27,720
ARS-BFGL-NGS-10082
FY
6
30,817
Hapmap53749rs29023061
FY
6
31,265
ARS-BFGL-NGS-103412
6
32,130
BTA-120439-no-rs
6
33,499
Hapmap41633-BTA-75713
PY
6
33,720
Hapmap27945-BTC073459
PY
FP
PY
FY
FP
FP
PP
MY
FY
PY
MY
PY
PP
MY
PY
PY
PP
PY
PP
MY
FY
PY
MY
FY
MY
MY
FP
Massimo Cellesi
Statistical Tools for Genomic-Wide Studies
Tesi di Dottorato in Scienze dei Sistemi Agrari e Forestali e delle Produzioni Alimentari
Scienze e Tecnologie Zootecniche – Università degli Studi di Sassari
PY
MY
FY
PY
MY
MY
FY
PY
PY
PP
115
37,564
Hapmap27503-BTC033786
6
37,670
Hapmap26259-BTC033526
PY
6
39,509
BTB-00260450
PY
6
39,604
Hapmap27818-BTC035199
6
40,700
Hapmap60113rs29017603
PP
6
40,741
BTB-00252917
PP
6
40,967
Hapmap57625rs29027071
FY
6
42,099
BTB-00251852
FY
6
42,376
Hapmap44280-BTA-75941
FY
6
42,512
6
6
92,788
Hapmap40845-BTA-97263
MY
6
93,683
BTB-01428718
MY
6
94,434
ARS-BFGL-NGS-83066
MY
6
95,043
BTA-77154-no-rs
6
95,528
ARS-BFGL-NGS-100802
MY
6
99,688
BTB-00274080
MY
6
100,740
Hapmap10869-BTA-77464
MY
6
101,684
Hapmap30053-BTA161410
MY
6
102,756
BTB-01791461
MY
6
103,177
Hapmap50779-BTA-77533
PY
PY
6
103,431
ARS-BFGL-NGS-114582
PY
Hapmap43676-BTA-75936
PY
6
104,437
ARS-BFGL-NGS-93120
MY
42,787
BTA-95818-no-rs
PY
6
107,336
Hapmap53924rs29022499
MY
6
43,805
ARS-BFGL-NGS-42501
6
107,444
ARS-BFGL-NGS-116512
6
44,699
Hapmap26848-BTC038527
MY
6
109,808
ARS-BFGL-NGS-10777
6
45,960
Hapmap49746-BTA-76106
MY
6
113,960
BTB-01754370
6
46,921
BTA-76116-no-rs
PP
6
116,998
Hapmap55397rs29017692
MY
6
48,864
Hapmap39620-BTA113785
PP
6
122,474
ARS-BFGL-NGS-29384
MY
6
50,150
BTA-18812-no-rs
7
15,513
Hapmap60436ss46526689
6
55,267
BTB-00843793
7
18,373
BTB-00296617
6
60,289
ARS-BFGL-NGS-106371
7
23,021
BTA-78558-no-rs
PP
6
60,704
BTA-97854-no-rs
6
75,093
BTA-76827-no-rs
7
23,447
Hapmap59434rs29012267
PP
6
85,083
Hapmap43417-BTA-96760
7
30,629
BTB-00549060
MY
6
88,807
ARS-BFGL-NGS-82008
MY
7
30,891
ARS-BFGL-NGS-21597
MY
6
88,947
Hapmap57014rs29019575
MY
7
33,067
UA-IFASA-4938
7
36,876
ARS-BFGL-NGS-17959
MY
6
89,355
ARS-BFGL-NGS-54753
MY
7
36,967
Hapmap32661-BTA-28979
MY
90,356
Hapmap51409-BTA122717
7
36,997
ARS-BFGL-NGS-18669
MY
6
6
MY
FY
FY
PY
PP
PY
PY
FY
PY
PY
PY
PY
PY
FY
FP
PP
PP
PY
PY
PP
FY
FP
PP
MY
PY
FY
PY
Massimo Cellesi
Statistical Tools for Genomic-Wide Studies
Tesi di Dottorato in Scienze dei Sistemi Agrari e Forestali e delle Produzioni Alimentari
Scienze e Tecnologie Zootecniche – Università degli Studi di Sassari
PY
FY
116
7
37,319
ARS-BFGL-NGS-119880
MY
7
73,749
ARS-BFGL-NGS-26484
7
37,339
ARS-BFGL-NGS-35666
MY
7
39,761
ARS-BFGL-NGS-30468
7
40,196
BTB-00368665
PY
7
74,122
ARS-BFGL-NGS-23727
PY
7
77,583
BTB-01339356
7
78,201
ARS-BFGL-NGS-31863
7
44,805
BTB-00309643
7
78,653
BTB-01273562
7
45,473
BTB-00310653
7
81,598
ARS-BFGL-NGS-11872
MY
7
50,743
ARS-BFGL-NGS-96012
7
81,753
BTB-01514268
MY
7
53,416
Hapmap58262rs29024901
PP
7
84,571
Hapmap51053-BTA-80120
MY
PY
7
55,024
Hapmap54976rs29019286
PP
7
84,684
ARS-BFGL-NGS-103162
MY
PY
7
84,854
BTB-01363214
7
55,357
BTB-01961486
7
86,472
BTB-01455682
MY
7
57,095
Hapmap52252rs29011665
7
86,515
ARS-BFGL-NGS-110503
MY
7
57,365
BTB-00311684
7
88,937
Hapmap43690-BTA-80156
FY
7
57,651
ARS-BFGL-NGS-33432
7
89,538
Hapmap39294-BTA-80145
FY
7
57,712
BTB-00311926
7
94,536
ARS-BFGL-NGS-43916
7
57,747
BTB-00311957
7
95,187
Hapmap46388-BTA-93108
PY
7
58,158
BTB-00313206
7
95,640
ARS-BFGL-NGS-113774
PY
7
58,355
BTB-00314357
MY
7
96,469
Hapmap47490-BTA108189
PY
7
62,700
BTB-00316348
MY
7
96,893
Hapmap48501-BTA-87072
PY
7
63,358
Hapmap36214SCAFFOLD145184_7453
7
96,986
ARS-BFGL-NGS-68719
FY
7
63,609
ARS-BFGL-NGS-113819
MY
7
97,011
Hapmap24200-BTA147598
FY
7
63,664
ARS-BFGL-NGS-109819
MY
FY
7
98,261
ARS-BFGL-NGS-94147
7
65,093
ARS-BFGL-NGS-42452
MY
FY
PY
7
99,797
ARS-BFGL-NGS-70915
FY
7
69,587
BTB-00318531
MY
FY
PY
7
99,898
ARS-BFGL-NGS-70114
FY
7
72,070
BTA-112613-no-rs
PY
7
100,457
BTA-87872-no-rs
7
72,456
BTB-01217472
FY
PY
7
102,077
Hapmap31054-BTA112283
7
72,746
Hapmap48995-BTA103787
FY
PY
7
102,166
ARS-BFGL-NGS-4342
7
72,792
BTB-01557864
FY
PY
7
103,092
BTA-80441-no-rs
7
72,871
ARS-BFGL-NGS-89239
PY
7
105,245
BTB-00955215
FP
MY
PY
FY
MY
PY
PY
FP
PY
MY
FY
MY
FY
FY
PY
PY
MY
PY
MY
PY
PY
MY
PY
PY
FY
PY
PY
Massimo Cellesi
Statistical Tools for Genomic-Wide Studies
Tesi di Dottorato in Scienze dei Sistemi Agrari e Forestali e delle Produzioni Alimentari
Scienze e Tecnologie Zootecniche – Università degli Studi di Sassari
PY
PY
PY
PY
FY
FP
FY
PY
117
7
106,689
Hapmap50111-BTA-80468
PY
7
106,918
Hapmap48479-BTA-80447
FY
7
107,109
ARS-BFGL-NGS-69739
FY
7
109,340
Hapmap44412-BTA-80524
FY
8
1
Hapmap42099-BTA120289
PY
8
44,047
Hapmap52331rs29021338
8
45,276
ARS-BFGL-NGS-86183
8
46,413
Hapmap54235rs29024181
PY
8
47,990
ARS-BFGL-NGS-113176
PY
8
51,778
Hapmap42685-BTA-81134
MY
8
53,071
ARS-BFGL-NGS-10990
MY
MY
PY
FY
PY
8
4,169
Hapmap54974rs29015318
8
4,251
BTA-86031-no-rs
PY
8
61,711
ARS-BFGL-NGS-118882
MY
PY
8
4,287
BTB-01956236
PY
8
62,535
ARS-BFGL-NGS-100613
MY
PY
8
4,999
ARS-BFGL-NGS-68739
PY
8
64,072
BTB-00105019
PY
8
6,369
Hapmap44053-BTA-28733
PY
8
64,104
ARS-BFGL-NGS-118369
PY
8
6,585
Hapmap43365-BTA-81894
PY
8
64,140
BTB-00351490
PY
8
7,456
ARS-BFGL-NGS-20843
PP
8
64,871
ARS-BFGL-NGS-97020
PY
8
14,685
BTA-92138-no-rs
PP
8
66,814
ARS-BFGL-NGS-16925
PY
8
16,151
Hapmap51695-BTA-16700
PP
8
67,247
Hapmap43062-BTA-81698
PY
8
16,988
Hapmap53455rs29027941
8
67,282
Hapmap44415-BTA-81700
PY
8
67,320
ARS-BFGL-NGS-66565
MY
PY
8
18,616
Hapmap50115-BTA-80812
8
22,250
ARS-BFGL-NGS-3384
PY
8
67,350
Hapmap30871-BTA158348
MY
PY
8
22,833
BTB-01168801
PY
8
67,696
BTA-19348-no-rs
8
22,856
ARS-BFGL-NGS-34771
PY
8
68,392
ARS-BFGL-NGS-24979
8
26,936
ARS-BFGL-NGS-24524
8
69,841
ARS-BFGL-NGS-29663
MY
8
33,339
BTB-01469421
8
70,711
Hapmap59270rs29027144
MY
8
33,664
Hapmap54720rs29023017
PY
8
71,591
Hapmap25871-BTA152798
8
75,261
BTB-01227548
MY
8
75,485
ARS-BFGL-NGS-16507
MY
8
75,556
ARS-BFGL-NGS-29576
MY
8
77,113
ARS-BFGL-NGS-5294
8
80,713
ARS-BFGL-NGS-29876
8
88,798
ARS-BFGL-NGS-26532
FY
FY
PY
MY
PP
PP
MY
8
35,520
Hapmap23351-BTA123397
PY
8
41,832
Hapmap32013-BTA104628
PY
8
42,208
ARS-BFGL-NGS-82111
8
43,646
ARS-BFGL-NGS-30070
8
43,709
BTA-80993-no-rs
FY
PY
PY
PY
FP
PY
PY
FY
MY
PY
Massimo Cellesi
Statistical Tools for Genomic-Wide Studies
Tesi di Dottorato in Scienze dei Sistemi Agrari e Forestali e delle Produzioni Alimentari
Scienze e Tecnologie Zootecniche – Università degli Studi di Sassari
PY
118
8
88,843
ARS-BFGL-NGS-104204
PY
9
23,736
ARS-BFGL-NGS-74851
8
90,328
ARS-BFGL-NGS-119337
9
24,624
BTB-01362120
8
91,547
ARS-BFGL-NGS-104416
PY
9
27,740
Hapmap31053-BTA111664
PY
8
92,786
ARS-BFGL-NGS-33495
PY
8
95,575
Hapmap48568-BTA103950
9
28,519
ARS-BFGL-NGS-79864
PY
FY
9
30,185
BTB-00387060
MY
8
96,576
BTB-01864543
FY
PY
9
34,031
ARS-BFGL-NGS-14098
MY
8
97,070
BTA-101737-no-rs
FY
PY
9
34,706
UA-IFASA-814
MY
8
97,099
BTA-101724-no-rs
FY
PY
9
40,130
Hapmap29482-BTA146449
PY
8
97,973
BTB-01734135
MY
8
98,726
ARS-BFGL-NGS-52705
MY
9
42,326
ARS-BFGL-NGS-72216
PY
8
99,390
ARS-BFGL-NGS-113098
9
42,423
ARS-BFGL-NGS-13783
PY
8
108,182
BTB-00369009
MY
9
44,569
UA-IFASA-4157
8
112,918
Hapmap49333-BTA-82773
MY
9
46,601
BTA-10828-no-rs
MY
8
113,162
BTB-01515798
MY
9
48,193
Hapmap34923BES9_Contig458_891
MY
8
114,396
ARS-BFGL-NGS-33591
MY
9
50,230
ARS-BFGL-NGS-27097
8
114,480
Hapmap49395-BTA-98771
MY
9
52,206
ARS-BFGL-NGS-22125
8
115,942
Hapmap53326rs29023047
MY
9
52,314
UA-IFASA-4980
9
57,732
BTB-01828494
9
58,626
BTB-01151441
PY
9
58,723
Hapmap49396-BTA-98905
PY
9
59,861
BTA-104917-no-rs
MY
FY
PY
PY
9
59,894
BTB-01604502
MY
FY
PY
PY
9
62,055
Hapmap49337-BTA-83888
MY
9
62,195
ARS-BFGL-NGS-107809
MY
9
65,149
ARS-BFGL-NGS-36482
FP
9
65,181
BTB-01673493
FP
9
67,711
BTA-33284-no-rs
9
72,409
Hapmap49339-BTA-84110
9
73,068
ARS-BFGL-NGS-78172
9
75,732
ARS-BFGL-NGS-36451
MY
PP
FY
FY
PY
PY
9
2,289
Hapmap36664SCAFFOLD50340_7682
9
9,412
ARS-BFGL-NGS-57285
9
9,957
ARS-BFGL-NGS-10202
MY
9
12,088
ARS-BFGL-NGS-59162
MY
9
13,730
BTA-91270-no-rs
MY
9
15,209
Hapmap28752-BTA146270
MY
9
15,958
BTB-01407982
MY
9
19,432
UA-IFASA-1686
PY
9
19,560
Hapmap47550-BTA-25655
PY
9
21,423
BTB-01095008
9
21,474
BTA-20861-no-rs
MY
FY
FP
FY
FY
PY
PY
FY
FP
FY
FY
MY
PP
PY
FY
Massimo Cellesi
Statistical Tools for Genomic-Wide Studies
Tesi di Dottorato in Scienze dei Sistemi Agrari e Forestali e delle Produzioni Alimentari
Scienze e Tecnologie Zootecniche – Università degli Studi di Sassari
MY
PY
119
9
75,802
BTA-84237-no-rs
MY
PY
10
36,426
ARS-BFGL-NGS-35605
9
75,843
Hapmap42339-BTA-84231
MY
PY
9
83,201
BTB-01182727
MY
9
84,177
ARS-BFGL-NGS-99576
10
36,557
Hapmap53714rs29017586
MY
10
38,937
ARS-BFGL-BAC-12872
MY
PY
9
85,451
ARS-BFGL-NGS-25441
10
39,506
BTB-00093532
MY
PY
9
89,138
ARS-BFGL-NGS-43711
10
40,770
BTA-122483-no-rs
PY
9
89,501
Hapmap54036ss46525997
10
41,245
BTB-01700213
PY
10
45,088
ARS-BFGL-NGS-16794
PY
9
92,155
BTB-00404735
10
46,922
ARS-BFGL-NGS-15826
MY
9
92,490
ARS-BFGL-NGS-46105
FY
10
47,637
ARS-BFGL-NGS-36243
MY
9
92,776
BTB-00404235
FY
10
47,879
ARS-BFGL-NGS-103757
9
93,253
BTB-01839335
FY
10
48,053
ARS-BFGL-NGS-104551
9
95,864
ARS-BFGL-NGS-112933
10
49,231
ARS-BFGL-BAC-11657
9
96,229
Hapmap44147-BTA-84872
10
54,386
BTB-01137783
MY
9
105,894
FY
PY
PY
MY
FY
FY
FP
PP
PY
PY
MY
FY
PY
PY
ARS-BFGL-NGS-87714
PP
10
54,632
Hapmap47128-BTA-89018
MY
PP
10
54,740
BTB-01137914
MY
PY
10
54,810
BTA-95978-no-rs
MY
PY
10
61,188
Hapmap57627rs29027143
MY
PY
10
62,511
ARS-BFGL-NGS-1410
10
66,285
ARS-BFGL-NGS-69379
10
68,128
BTA-100674-no-rs
10
69,724
ARS-BFGL-NGS-110711
MY
10
70,431
ARS-BFGL-NGS-57077
MY
10
70,455
Hapmap50263-BTA122214
MY
10
71,120
ARS-BFGL-NGS-12520
MY
10
71,842
BTA-74271-no-rs
MY
10
86,227
BTB-00436473
MY
10
86,940
ARS-BFGL-NGS-117016
10
88,110
ARS-BFGL-NGS-16573
MY
10
92,399
Hapmap39512-BTA-79353
MY
10
2,690
ARS-BFGL-NGS-118679
10
8,136
ARS-BFGL-NGS-115023
10
11,075
BTB-00407977
PY
10
13,344
ARS-BFGL-BAC-13545
PY
10
13,592
ARS-BFGL-NGS-71024
PY
10
13,840
ARS-BFGL-NGS-100004
PY
10
20,945
Hapmap57100rs29013509
10
31,421
BTB-00416806
MY
10
31,807
BTB-00415821
MY
10
31,948
BTB-00416033
MY
10
31,973
BTB-00416055
10
34,700
Hapmap25237-BTA125338
10
35,862
Hapmap34243BES6_Contig306_1185
MY
10
35,929
Hapmap55209rs29013243
MY
MY
PY
FY
PY
FY
MY
PY
PY
PY
PY
PY
PY
FY
PY
Massimo Cellesi
Statistical Tools for Genomic-Wide Studies
Tesi di Dottorato in Scienze dei Sistemi Agrari e Forestali e delle Produzioni Alimentari
Scienze e Tecnologie Zootecniche – Università degli Studi di Sassari
FP
120
10
93,400
ARS-BFGL-NGS-26052
FP
10
93,838
BTB-00445081
10
95,836
ARS-BFGL-NGS-74928
10
96,040
Hapmap54178rs29021913
10
96,098
BTB-00446145
FY
10
96,955
Hapmap50620-BTA-21279
FY
10
105,001
11
6,209
ARS-BFGL-NGS-91251
11
6,516
BTB-00454142
11
7,134
ARS-BFGL-NGS-47869
FY
11
7,545
BTA-101065-no-rs
FY
11
11,906
ARS-BFGL-NGS-19864
FY
11
12,468
ARS-BFGL-BAC-13568
11
13,451
BTA-85470-no-rs
11
14,044
ARS-BFGL-NGS-13679
11
15,627
BTB-00483333
MY
11
15,648
BTB-00461989
MY
11
15,690
ARS-BFGL-NGS-74492
11
16,521
ARS-BFGL-BAC-14856
11
17,940
BTB-01391227
PY
11
18,851
BTB-01934985
PY
11
18,999
BTB-01679746
PY
11
19,023
BTB-01940421
PY
11
19,130
BTB-01913936
PY
11
20,980
ARS-BFGL-NGS-104435
PY
11
23,779
ARS-BFGL-NGS-43804
11
27,454
BTB-01550704
11
35,658
BTB-01431917
PY
11
35,716
BTB-01293391
PY
11
35,947
BTB-02040693
PY
FY
MY
FY
PY
FP
BTA-83475-no-rs
11
36,475
BTA-91929-no-rs
PP
11
37,465
ARS-BFGL-NGS-112269
11
38,704
ARS-BFGL-NGS-32737
11
40,185
ARS-BFGL-NGS-118144
PP
11
40,276
ARS-BFGL-BAC-14233
PP
11
43,053
ARS-BFGL-NGS-14714
PP
11
50,639
ARS-BFGL-NGS-68510
PY
11
50,695
ARS-BFGL-NGS-108232
PY
11
50,727
Hapmap59833rs29027583
PY
11
57,819
BTA-32746-no-rs
11
58,725
BTB-01079189
PP
11
58,778
BTB-00475277
PP
11
65,840
Hapmap34879BES7_Contig396_841
PY
11
65,871
ARS-BFGL-NGS-100607
PY
11
68,383
BTA-101061-no-rs
FY
11
68,724
ARS-BFGL-NGS-109780
FY
PY
11
69,456
ARS-BFGL-NGS-18300
11
70,246
Hapmap34845BES7_Contig520_696
FY
PY
11
70,268
Hapmap12055-BTA-86516
11
71,197
Hapmap27139-BTA102152
11
73,281
ARS-BFGL-NGS-110450
11
73,342
ARS-BFGL-NGS-20385
11
75,076
ARS-BFGL-NGS-74702
MY
11
76,426
ARS-BFGL-NGS-95312
MY
11
78,221
Hapmap25799-BTA126762
11
78,484
ARS-BFGL-NGS-112276
MY
11
80,363
ARS-BFGL-NGS-61477
MY
11
80,576
ARS-BFGL-NGS-73132
MY
MY
FY
PP
MY
FY
PY
PY
PY
PY
FY
PP
PY
MY
PY
FY
MY
PY
FY
MY
PY
FY
FY
PY
MY
FY
PP
Massimo Cellesi
Statistical Tools for Genomic-Wide Studies
Tesi di Dottorato in Scienze dei Sistemi Agrari e Forestali e delle Produzioni Alimentari
Scienze e Tecnologie Zootecniche – Università degli Studi di Sassari
PP
FY
121
11
80,973
ARS-BFGL-NGS-32286
PY
12
52,640
Hapmap43521-BTA-23812
11
83,876
ARS-BFGL-NGS-105586
MY
FY
11
84,956
Hapmap46768-BTA117394
MY
FY
11
87,632
ARS-BFGL-NGS-83288
MY
11
88,003
ARS-BFGL-NGS-107825
11
88,023
11
12
52,880
Hapmap59400rs29023728
12
53,843
BTB-00496702
PY
12
55,173
ARS-BFGL-NGS-2151
MY
PY
12
55,793
BTB-00499073
PY
Hapmap43168-BTA119307
MY
PY
12
55,813
Hapmap56826rs29013564
PY
89,891
ARS-BFGL-NGS-33784
MY
12
57,806
BTB-01839492
11
92,078
Hapmap42125-BTA-19379
MY
PY
12
65,371
BTB-01337869
11
94,840
ARS-BFGL-NGS-14308
PY
12
65,419
BTB-01337853
11
98,252
Hapmap41435-BTA115556
MY
12
65,741
ARS-BFGL-BAC-14364
PY
12
65,797
ARS-BFGL-NGS-90411
PY
11
100,331
ARS-BFGL-NGS-113879
MY
12
67,030
ARS-BFGL-NGS-54132
11
103,079
ARS-BFGL-NGS-114094
MY
PY
12
68,594
BTB-00503215
11
105,482
ARS-BFGL-NGS-39065
MY
PY
12
73,402
UA-IFASA-2256
MY
FY
PY
11
105,535
ARS-BFGL-NGS-102267
MY
12
73,480
ARS-BFGL-NGS-19305
MY
FY
PY
11
106,046
ARS-BFGL-NGS-22188
PY
12
75,467
ARS-BFGL-NGS-12480
11
107,651
ARS-BFGL-NGS-114744
PY
12
78,334
Hapmap42176-BTA-31298
12
126
ARS-BFGL-NGS-104447
FY
12
5,492
BTA-17590-no-rs
FY
12
78,512
Hapmap59799rs29010339
FY
12
6,221
ARS-BFGL-NGS-28486
12
80,766
ARS-BFGL-NGS-53938
FY
12
8,964
ARS-BFGL-NGS-112946
MY
12
80,870
ARS-BFGL-NGS-107794
FY
12
11,872
Hapmap50654-BTA-31559
MY
12
81,408
BTB-01315661
12
12,313
ARS-BFGL-NGS-31202
12
81,705
ARS-BFGL-NGS-41933
12
14,213
ARS-BFGL-NGS-16501
PY
12
82,410
BTB-01198427
12
14,373
BTA-31571-no-rs
PY
13
680
BTB-01141508
12
14,511
ARS-BFGL-NGS-42200
MY
PY
13
1,122
BTA-122179-no-rs
12
15,522
ARS-BFGL-NGS-43671
MY
PY
13
1,311
ARS-BFGL-BAC-12483
MY
12
18,461
ARS-BFGL-NGS-62217
FY
13
1,372
BTA-15911-no-rs
MY
12
21,939
BTA-120906-no-rs
FY
13
1,498
Hapmap45253-BTA-15908
12
22,947
ARS-BFGL-NGS-51613
FY
13
3,111
PY
PY
FY
FY
Hapmap35931-
Massimo Cellesi
Statistical Tools for Genomic-Wide Studies
Tesi di Dottorato in Scienze dei Sistemi Agrari e Forestali e delle Produzioni Alimentari
Scienze e Tecnologie Zootecniche – Università degli Studi di Sassari
FY
PP
PY
PP
PP
PY
MY
MY
PY
FY
PY
PY
PY
PP
PY
MY
PP
PY
FY
PY
PY
FY
PY
122
SCAFFOLD200024_14429
MY
13
41,409
BTB-00522444
FP
PY
13
42,319
Hapmap51209-BTA-32563
MY
PY
13
42,702
ARS-BFGL-NGS-57335
MY
PY
13
44,016
ARS-BFGL-NGS-5872
FP
13
44,039
ARS-BFGL-NGS-104720
FP
13
3,251
ARS-BFGL-BAC-15070
13
3,483
ARS-BFGL-NGS-4272
13
4,058
ARS-BFGL-NGS-62490
13
4,078
ARS-BFGL-NGS-105636
13
4,457
BTB-01748916
PY
13
44,982
BTB-01376014
13
4,566
BTB-00511781
PY
13
45,361
BTB-01505690
PP
13
5,019
ARS-BFGL-NGS-98610
PY
13
46,536
ARS-BFGL-NGS-97782
PP
13
5,082
ARS-BFGL-NGS-92938
MY
13
47,301
ARS-BFGL-NGS-80072
13
5,660
ARS-BFGL-NGS-84327
MY
13
48,171
Hapmap54365rs29014934
PY
13
6,459
ARS-BFGL-NGS-105883
13
48,188
BTB-01718516
PY
13
8,968
ARS-BFGL-NGS-93056
FY
13
48,300
ARS-BFGL-NGS-3711
13
12,438
Hapmap50305-BTA-27942
FY
13
48,393
BTB-00527671
13
13,139
ARS-BFGL-NGS-114459
PY
13
55,371
BTB-00529185
13
13,408
ARS-BFGL-NGS-109071
PY
13
55,818
Hapmap40246-BTA-32935
13
13,909
ARS-BFGL-NGS-113489
13
56,446
ARS-BFGL-NGS-1365
13
15,059
ARS-BFGL-NGS-92946
13
61,718
ARS-BFGL-NGS-83014
FP
13
16,262
Hapmap39397-BTA-31932
MY
13
72,684
ARS-BFGL-NGS-81880
FP
13
16,285
Hapmap42509-BTA-31930
MY
13
77,103
ARS-BFGL-NGS-104779
13
24,489
Hapmap42181-BTA-31908
13
78,470
ARS-BFGL-NGS-18031
13
24,517
ARS-BFGL-NGS-104788
MY
13
79,539
ARS-BFGL-NGS-16572
13
25,233
BTA-31957-no-rs
MY
13
82,440
ARS-BFGL-NGS-56575
FP
13
26,814
Hapmap25132-BTA-96391
13
32,893
Hapmap40947-BTA-32313
MY
14
5
Hapmap29758-BTC003619
FP
13
33,741
Hapmap57166rs29020401
MY
14
51
Hapmap30381-BTC005750
FP
13
35,765
BTB-00517708
PY
14
77
Hapmap30383-BTC005848
13
36,033
BTB-00517668
PY
14
101
BTA-34956-no-rs
13
38,193
BTA-32346-no-rs
14
237
ARS-BFGL-NGS-57820
MY
PY
FP
13
39,178
ARS-BFGL-NGS-110611
14
444
ARS-BFGL-NGS-4939
MY
PY
FP
13
39,371
ARS-BFGL-BAC-14448
FY
MY
FY
FY
PY
PY
MY
PY
FP
PP
PY
MY
PY
PP
PP
MY
PY
PY
FY
MY
FP
FY
FY
FY
MY
MY
FY
PY
PY
PY
MY
PY
FP
PY
PP
PY
Massimo Cellesi
Statistical Tools for Genomic-Wide Studies
Tesi di Dottorato in Scienze dei Sistemi Agrari e Forestali e delle Produzioni Alimentari
Scienze e Tecnologie Zootecniche – Università degli Studi di Sassari
123
14
2,826
Hapmap27703-BTC053907
14
3,019
Hapmap22692-BTC068210
MY
FP
14
3,100
Hapmap23302-BTC052123
MY
UA-IFASA-8997
FP
14
3,122
ARS-BFGL-NGS-113309
931
ARS-BFGL-NGS-101653
FP
14
3,189
Hapmap25217-BTC067767
997
ARS-BFGL-NGS-26520
FP
14
3,698
ARS-BFGL-NGS-78318
14
3,834
Hapmap32262-BTC066621
FP
14
3,941
Hapmap30091-BTC005211
FP
14
4,694
Hapmap30988-BTC056315
FP
14
4,956
ARS-BFGL-NGS-112858
FP
14
5,282
ARS-BFGL-NGS-110894
FP
14
5,640
Hapmap32234-BTC048199
PY
14
8,692
ARS-BFGL-NGS-28580
PY
14
8,810
Hapmap25450-BTC055819
PY
14
10,792
ARS-BFGL-NGS-119373
14
11,525
Hapmap57409rs29021898
PY
14
14,073
ARS-BFGL-NGS-33755
PY
14
596
ARS-BFGL-NGS-71749
FP
14
680
ARS-BFGL-NGS-107379
14
742
ARS-BFGL-NGS-18365
FP
14
763
Hapmap30922-BTC002021
14
812
14
14
MY
FY
FP
FP
PP
PP
FP
PP
Hapmap29888-BTC003509
FP
1,264
ARS-BFGL-NGS-3122
FP
14
1,285
Hapmap25486-BTC072553
14
1,308
ARS-BFGL-NGS-31471
14
1,409
ARS-BFGL-NGS-41248
FP
14
1,461
Hapmap30646-BTC002054
FP
14
1,889
ARS-BFGL-NGS-74378
14
1,913
ARS-BFGL-NGS-117542
14
2,011
ARS-BFGL-BAC-1511
14
2,049
Hapmap30730-BTC064822
FP
14
2,131
ARS-BFGL-NGS-33248
FP
14
2,202
UA-IFASA-9288
FP
14
2,262
Hapmap24777-BTC064977
FP
14
14,132
ARS-BFGL-NGS-117354
PY
14
2,347
ARS-BFGL-NGS-22111
FP
14
14,409
ARS-BFGL-NGS-549
PY
14
2,370
UA-IFASA-7269
FP
14
14,560
UA-IFASA-5528
PY
14
2,392
Hapmap26072-BTC065132
FP
14
14,806
BTA-122375-no-rs
PY
14
14,884
2,419
Hapmap60993rs29025756
PY
14
Hapmap26527-BTC005059
14
16,048
BTB-00553468
PY
14
2,580
ARS-BFGL-NGS-56327
14
2,712
UA-IFASA-5306
14
16,746
Hapmap33723-BTA156547
MY
14
16,788
UA-IFASA-9744
MY
14
14
1,154
FP
FY
MY
FP
FP
FP
PP
FP
MY
FY
FP
Massimo Cellesi
Statistical Tools for Genomic-Wide Studies
Tesi di Dottorato in Scienze dei Sistemi Agrari e Forestali e delle Produzioni Alimentari
Scienze e Tecnologie Zootecniche – Università degli Studi di Sassari
PY
124
14
17,851
UA-IFASA-6305
14
17,956
BTB-01720377
14
18,078
14
PP
15
32,753
ARS-BFGL-NGS-2713
PY
15
34,467
BTB-01444556
BTB-00555233
PY
15
35,145
BTB-01559217
PY
18,116
ARS-BFGL-NGS-100788
PY
15
44,055
UA-IFASA-2402
PY
14
21,668
UA-IFASA-7382
PY
15
44,672
ARS-BFGL-BAC-19395
14
33,321
Hapmap40239-BTA-20881
PY
15
44,705
BTB-01459155
14
33,756
Hapmap49579-BTA-34549
PY
15
47,944
ARS-BFGL-BAC-21163
PP
14
34,728
ARS-BFGL-NGS-72344
15
58,052
Hapmap53286rs29015961
PP
14
38,982
ARS-BFGL-BAC-21453
14
46,013
BTB-01223066
15
58,948
Hapmap57960rs29017396
14
47,657
ARS-BFGL-NGS-3879
15
61,155
BTB-01177461
PP
14
61,165
ARS-BFGL-NGS-112068
PY
15
61,202
BTB-01177436
PP
14
62,078
Hapmap58177rs29027340
PY
15
68,125
ARS-BFGL-NGS-101744
PY
15
72,891
BTA-98582-no-rs
PY
14
65,845
ARS-BFGL-NGS-119102
15
73,800
BTB-00479196
PY
14
66,091
ARS-BFGL-NGS-32742
15
75,599
ARS-BFGL-NGS-31754
PP
14
69,097
ARS-BFGL-NGS-3717
MY
16
2,468
ARS-BFGL-NGS-22265
PP
14
69,119
ARS-BFGL-NGS-69078
MY
16
2,656
ARS-BFGL-NGS-21426
PP
14
69,828
BTA-35465-no-rs
16
9,738
BTB-01698088
14
70,164
UA-IFASA-7141
MY
16
14,324
BTA-40290-no-rs
14
77,487
ARS-BFGL-BAC-26943
MY
16
17,950
Hapmap42200-BTA-40314
15
1,808
ARS-BFGL-NGS-101623
MY
16
19,001
ARS-BFGL-NGS-35246
MY
15
3,801
Hapmap42143-BTA-23359
16
27,619
ARS-BFGL-NGS-41039
MY
15
11,900
Hapmap45702-BTA-93884
16
31,374
BTB-00636189
MY
15
14,307
ARS-BFGL-NGS-100235
PY
16
33,890
Hapmap42928-BTA-38715
MY
15
14,339
Hapmap44375-BTA-37785
PY
16
34,941
BTA-38771-no-rs
MY
15
20,916
ARS-BFGL-NGS-73400
16
35,329
Hapmap47936-BTA-38791
MY
15
23,112
Hapmap42921-BTA-36160
16
35,581
ARS-BFGL-NGS-117892
MY
15
31,000
BTA-09703-rs29025860
16
35,606
BTB-00639530
MY
15
31,441
ARS-BFGL-BAC-35396
16
43,454
ARS-BFGL-NGS-110930
15
31,586
ARS-BFGL-NGS-107321
FY
MY
FY
MY
FY
PP
FY
FP
FP
PP
PY
PY
PY
PY
MY
PY
FP
FY
PY
MY
FY
MY
PY
PP
MY
Massimo Cellesi
Statistical Tools for Genomic-Wide Studies
Tesi di Dottorato in Scienze dei Sistemi Agrari e Forestali e delle Produzioni Alimentari
Scienze e Tecnologie Zootecniche – Università degli Studi di Sassari
PP
PY
125
16
44,730
ARS-BFGL-NGS-111082
PY
17
6,811
Hapmap47945-BTA-41852
MY
16
46,838
ARS-BFGL-NGS-59272
PY
17
6,838
BTB-00669586
MY
16
47,763
Hapmap39327-BTA-39134
17
7,693
Hapmap54786rs29011077
MY
16
48,117
ARS-BFGL-NGS-18487
PY
16
48,227
BTB-00646159
PY
17
7,809
Hapmap28805-BTA147247
MY
16
49,781
ARS-BFGL-NGS-63175
17
7,976
BTB-01381100
MY
16
49,945
ARS-BFGL-NGS-111268
17
11,307
Hapmap52387rs29021226
MY
16
50,801
ARS-BFGL-NGS-29043
MY
16
55,747
BTB-00648059
MY
17
11,991
Hapmap47504-BTA111690
MY
16
55,769
BTB-00648053
MY
17
13,429
BTA-42193-no-rs
MY
16
57,448
BTB-01492749
17
13,548
ARS-BFGL-NGS-96040
16
62,401
ARS-BFGL-NGS-61156
17
14,162
Hapmap24693-BTA156848
FP
16
62,593
ARS-BFGL-NGS-101997
17
14,209
62,931
MY
FY
PY
Hapmap26095-BTA113931
FP
16
Hapmap59629rs29013680
16
63,025
ARS-BFGL-NGS-113169
MY
FY
PY
17
14,231
Hapmap28090-BTA113932
FP
16
66,661
BTA-39971-no-rs
MY
FY
PY
17
14,607
ARS-BFGL-NGS-22135
FP
16
68,149
BTB-00659112
PP
17
16,137
ARS-BFGL-NGS-29973
16
69,413
ARS-BFGL-NGS-36241
PP
17
20,351
ARS-BFGL-BAC-34046
16
69,702
BTB-00660988
FY
17
27,083
BTA-22770-no-rs
16
70,486
UA-IFASA-8461
FY
17
29,262
BTA-40721-no-rs
16
70,546
ARS-BFGL-NGS-32521
PP
17
29,830
Hapmap58096rs29011314
16
71,333
Hapmap39023-BTA-39937
PP
17
33,515
ARS-BFGL-NGS-38157
16
71,857
ARS-BFGL-NGS-112904
17
47,053
ARS-BFGL-NGS-11160
PY
16
72,921
ARS-BFGL-NGS-117855
17
48,762
BTA-117207-no-rs
PY
17
102
BTB-01851867
17
60,835
ARS-BFGL-NGS-10055
MY
17
139
BTB-01927707
17
61,232
ARS-BFGL-NGS-118636
MY
17
474
BTB-00666435
17
61,413
ARS-BFGL-NGS-3759
MY
17
1,325
ARS-BFGL-NGS-45119
17
62,375
ARS-BFGL-NGS-26121
17
3,253
BTA-109611-no-rs
17
63,451
Hapmap51186-BTA-21161
17
6,783
BTB-00669395
FY
MY
PY
PY
PY
PY
MY
FY
PY
MY
FP
MY
FY
PY
PY
MY
PY
FY
MY
Massimo Cellesi
Statistical Tools for Genomic-Wide Studies
Tesi di Dottorato in Scienze dei Sistemi Agrari e Forestali e delle Produzioni Alimentari
Scienze e Tecnologie Zootecniche – Università degli Studi di Sassari
PY
PY
FY
MY
PP
MY
PP
MY
PY
MY
PY
126
17
63,727
Hapmap49912-BTA-21169
MY
18
43,330
ARS-BFGL-NGS-113354
PP
17
64,993
BTB-01301223
18
43,604
ARS-BFGL-NGS-3258
PP
17
65,228
BTA-41643-no-rs
PY
18
43,660
ARS-BFGL-NGS-75672
PP
17
65,255
ARS-BFGL-NGS-39284
PY
18
46,112
UA-IFASA-2345
17
65,289
ARS-BFGL-NGS-50172
18
47,572
ARS-BFGL-NGS-110180
MY
17
66,561
ARS-BFGL-NGS-34489
FY
18
48,909
ARS-BFGL-BAC-35461
MY
17
68,948
ARS-BFGL-NGS-118351
FY
PY
18
51,133
Hapmap49609-BTA-43790
17
69,005
ARS-BFGL-NGS-118399
PY
18
52,162
ARS-BFGL-NGS-114962
17
69,246
BTA-41779-no-rs
PP
18
52,355
UA-IFASA-9064
17
69,280
ARS-BFGL-NGS-114711
PP
18
53,069
ARS-BFGL-NGS-10036
MY
PY
17
72,467
ARS-BFGL-NGS-70175
PP
18
53,126
ARS-BFGL-NGS-116232
MY
PY
17
72,850
ARS-BFGL-NGS-116537
18
54,290
ARS-BFGL-NGS-100074
18
2,773
BTB-00691673
PY
18
55,150
BTA-43890-no-rs
18
2,822
BTB-01590114
PY
18
55,626
BTA-43831-no-rs
FY
18
6,448
BTB-00695596
18
55,862
ARS-BFGL-NGS-25104
FY
18
8,739
ARS-BFGL-NGS-1116
MY
18
61,209
ARS-BFGL-NGS-49873
18
12,987
ARS-BFGL-NGS-25688
MY
19
1,965
18
21,508
Hapmap51449-BTA-42665
FY
19
16,212
ARS-BFGL-NGS-6298
18
23,970
ARS-BFGL-NGS-32550
FY
19
18,879
ARS-BFGL-NGS-82757
18
25,961
ARS-BFGL-NGS-66258
19
21,097
Hapmap53206rs29014774
18
28,275
ARS-BFGL-NGS-99463
19
21,681
Hapmap41542-BTA-44740
PY
18
34,256
ARS-BFGL-NGS-23693
19
23,211
ARS-BFGL-NGS-4411
PY
18
37,107
Hapmap45736-BTA-43103
19
24,364
ARS-BFGL-NGS-4744
PY
18
39,837
ARS-BFGL-NGS-88483
19
24,407
ARS-BFGL-NGS-81462
PY
18
40,852
ARS-BFGL-NGS-63087
19
25,075
ARS-BFGL-NGS-103353
PY
18
41,399
BTA-42967-no-rs
19
25,556
ARS-BFGL-NGS-101545
PY
18
41,453
BTA-23408-no-rs
PY
18
41,828
ARS-BFGL-NGS-112414
PY
19
25,806
Hapmap46758-BTA108921
PY
18
41,887
Hapmap40976-BTA-43213
19
26,253
ARS-BFGL-NGS-1837
PY
18
43,246
UA-IFASA-8905
19
31,896
ARS-BFGL-NGS-57209
FP
MY
PP
FP
MY
PP
PY
PY
FY
PY
PY
FP
PY
PY
MY
PY
Hapmap50697-BTA-44862
FY
MY
PY
FY
FP
FY
PP
FP
PP
PY
MY
PY
FY
PP
Massimo Cellesi
Statistical Tools for Genomic-Wide Studies
Tesi di Dottorato in Scienze dei Sistemi Agrari e Forestali e delle Produzioni Alimentari
Scienze e Tecnologie Zootecniche – Università degli Studi di Sassari
PP
127
19
31,954
ARS-BFGL-NGS-39118
MY
PY
20
1,291
ARS-BFGL-NGS-17557
19
32,590
ARS-BFGL-NGS-103323
MY
19
34,150
BTA-45034-no-rs
20
3,014
ARS-BFGL-NGS-23863
20
8,767
ARS-BFGL-NGS-44829
19
34,230
ARS-BFGL-BAC-33744
20
13,234
ARS-BFGL-NGS-12791
19
40,563
ARS-BFGL-NGS-119404
20
19,982
Hapmap50241-BTA115966
19
44,019
ARS-BFGL-NGS-28651
FP
MY
19
46,188
BTB-00753901
FP
20
20,006
ARS-BFGL-NGS-110436
MY
19
46,499
ARS-BFGL-NGS-31468
20
20,041
BTA-115956-no-rs
MY
19
46,829
ARS-BFGL-BAC-2364
FP
20
23,528
ARS-BFGL-NGS-110975
19
48,216
BTA-23253-no-rs
FP
20
24,231
Hapmap50712-BTA-50068
19
51,542
BTA-45898-no-rs
MY
20
26,229
ARS-BFGL-NGS-108866
19
51,635
ARS-BFGL-NGS-105988
MY
20
26,556
ARS-BFGL-NGS-18978
PP
19
51,667
ARS-BFGL-NGS-83703
FY
20
27,037
ARS-BFGL-NGS-38132
PP
19
51,692
ARS-BFGL-NGS-102298
FY
20
29,212
ARS-BFGL-BAC-36217
PP
19
61,273
UA-IFASA-8477
PY
20
29,734
ARS-BFGL-NGS-17586
PY
19
61,456
Hapmap32800-BTA133450
PY
20
29,838
BTA-50190-no-rs
PY
20
30,094
ARS-BFGL-NGS-31598
19
61,653
ARS-BFGL-NGS-111401
20
30,129
ARS-BFGL-BAC-27914
PP
19
62,807
ARS-BFGL-NGS-116261
PY
20
30,613
BTB-01328684
PP
19
62,832
Hapmap43271-BTA-46356
FY
PY
20
31,203
ARS-BFGL-BAC-27930
PP
19
63,214
ARS-BFGL-BAC-32334
FY
PY
20
31,886
ARS-BFGL-NGS-16297
PP
19
63,380
ARS-BFGL-NGS-88748
FY
20
32,980
BTA-103550-no-rs
PP
19
63,763
ARS-BFGL-NGS-39527
20
33,014
Hapmap59121rs29022980
PP
19
64,258
BTB-01987097
FY
19
64,283
ARS-BFGL-NGS-101226
FY
20
33,079
Hapmap54258rs29018641
PP
19
64,446
ARS-BFGL-NGS-54958
20
33,122
UA-IFASA-9183
PP
19
64,517
ARS-BFGL-NGS-43321
PY
20
34,037
ARS-BFGL-NGS-118998
19
64,590
ARS-BFGL-NGS-72483
PY
20
34,954
Hapmap39724-BTA122305
PP
19
64,618
ARS-BFGL-NGS-108629
PY
20
34,983
ARS-BFGL-NGS-89478
PP
19
64,648
ARS-BFGL-NGS-32846
19
65,133
ARS-BFGL-NGS-18449
20
35,433
Hapmap39811-BTA122745
PY
FP
MY
FY
PY
MY
FY
MY
FY
MY
PY
FY
PY
PY
FY
FP
MY
MY
PY
MY
FY
MY
PY
PP
PY
PY
Massimo Cellesi
Statistical Tools for Genomic-Wide Studies
Tesi di Dottorato in Scienze dei Sistemi Agrari e Forestali e delle Produzioni Alimentari
Scienze e Tecnologie Zootecniche – Università degli Studi di Sassari
FP
128
20
35,457
BTB-01888575
FP
20
35,552
ARS-BFGL-BAC-2469
FP
20
35,671
ARS-BFGL-NGS-26909
FP
20
36,394
Hapmap54938rs29013720
20
36,956
Hapmap57531rs29013890
20
37,399
BTB-00778154
20
37,443
BTB-00778141
20
37,479
ARS-BFGL-NGS-34049
20
37,708
ARS-BFGL-NGS-38482
20
37,785
20
20
39,698
Hapmap38412-BTA-50496
PY
PP
20
39,728
Hapmap53199rs29014437
PY
PP
20
39,826
Hapmap57276ss46526009
20
39,861
Hapmap42572-BTA-50505
PY
PP
20
39,950
BTA-50515-no-rs
PP
PP
PP
PY
PP
FY
MY
FP
PP
20
40,005
BTB-00781699
FP
PP
20
40,519
ARS-BFGL-NGS-38574
20
40,634
ARS-BFGL-NGS-91540
PP
PP
20
40,923
BTB-01423688
PP
ARS-BFGL-NGS-84088
PP
20
41,064
BTB-01163526
37,866
Hapmap39660-BTA-50453
PP
20
41,189
Hapmap42161-BTA-26363
20
37,946
BTB-00779241
MY
20
41,217
BTA-92644-no-rs
20
38,002
BTB-00780234
MY
20
41,633
ARS-BFGL-NGS-65409
MY
20
38,076
BTB-00780124
MY
20
41,818
BTB-01898603
MY
20
38,201
Hapmap52690ss46526609
PP
20
41,861
ARS-BFGL-BAC-34879
MY
20
41,923
ARS-BFGL-NGS-36606
PP
20
38,296
BTA-50420-no-rs
PP
20
41,947
BTA-102910-no-rs
PP
20
38,381
BTB-01912756
PP
20
38,519
ARS-BFGL-NGS-13317
FY
20
41,976
Hapmap42401-BTA102906
20
38,540
ARS-BFGL-NGS-11884
FY
PP
20
42,197
ARS-BFGL-NGS-73590
PP
20
38,590
ARS-BFGL-NGS-63936
PP
20
42,740
ARS-BFGL-BAC-33668
PP
20
38,741
ARS-BFGL-NGS-2860
PP
20
43,164
BTB-01410122
PP
20
38,900
ARS-BFGL-NGS-22355
PP
20
43,585
Hapmap43599-BTA-50578
20
38,936
Hapmap51600-BTA-50467
20
45,121
Hapmap38112-BTA-50631
20
39,486
BTB-00782435
FY
PY
PP
20
45,288
BTB-01263010
20
39,519
BTA-13793-rs29018751
FY
PY
PP
20
45,582
BTB-01263230
20
39,601
BTB-01842107
FY
PY
PP
20
45,936
BTA-50635-no-rs
PP
20
39,639
Hapmap53888rs29021190
20
46,950
Hapmap50991-BTA-50645
PP
20
48,368
ARS-BFGL-NGS-37203
20
39,667
INRA-620
20
48,464
BTB-00785931
PY
PY
PY
PP
MY
PP
FY
PY
MY
FY
PP
MY
PP
MY
MY
PY
PP
MY
MY
PP
Massimo Cellesi
Statistical Tools for Genomic-Wide Studies
Tesi di Dottorato in Scienze dei Sistemi Agrari e Forestali e delle Produzioni Alimentari
Scienze e Tecnologie Zootecniche – Università degli Studi di Sassari
PP
129
20
48,504
Hapmap43873-BTA-50695
PP
21
4,657
ARS-BFGL-NGS-34864
PY
20
48,572
ARS-BFGL-NGS-57668
21
6,007
Hapmap38507-BTA-52931
PY
20
48,703
BTB-00786292
21
6,464
ARS-BFGL-NGS-46597
20
50,644
BTB-00411452
PP
21
7,947
ARS-BFGL-NGS-118623
20
53,350
UA-IFASA-2994
PP
21
8,284
Hapmap47860-BTA120557
20
53,387
Hapmap54729rs29023630
PY
PP
21
8,336
ARS-BFGL-NGS-21637
PY
20
55,293
BTB-02040655
PP
21
9,707
ARS-BFGL-NGS-8069
PY
20
56,645
Hapmap40003-BTA-50839
PP
21
12,697
ARS-BFGL-NGS-109184
MY
20
60,208
BTA-50852-no-rs
PP
21
13,539
BTB-01258471
MY
20
61,736
BTB-01648514
PY
21
13,564
ARS-BFGL-NGS-86644
20
61,903
ARS-BFGL-NGS-111931
PY
21
14,914
ARS-BFGL-NGS-25378
MY
20
64,019
BTB-01340958
21
15,037
ARS-BFGL-NGS-42615
MY
20
64,066
BTB-01341053
PY
21
15,058
BTA-53495-no-rs
20
64,397
BTB-01580948
PY
21
15,142
ARS-BFGL-NGS-54451
MY
PY
20
64,482
BTB-01456930
PP
21
16,338
ARS-BFGL-NGS-30546
MY
PY
20
64,508
BTB-01899482
PP
21
16,994
ARS-BFGL-NGS-33483
20
65,379
ARS-BFGL-BAC-34915
PP
21
17,382
ARS-BFGL-NGS-79733
20
66,093
BTB-00793280
PY
21
18,331
BTB-00808681
20
66,150
ARS-BFGL-BAC-36223
PY
21
18,843
ARS-BFGL-NGS-41922
20
66,705
ARS-BFGL-NGS-17058
21
19,075
ARS-BFGL-BAC-33343
20
70,190
ARS-BFGL-NGS-41833
MY
21
22,397
ARS-BFGL-NGS-69585
PY
20
70,409
ARS-BFGL-NGS-118449
MY
21
23,030
ARS-BFGL-NGS-28785
PY
20
71,165
ARS-BFGL-NGS-109799
MY
21
24,164
ARS-BFGL-NGS-99587
PY
20
71,407
BTB-01525417
MY
21
24,974
Hapmap53212rs29015272
PY
20
72,558
ARS-BFGL-NGS-34321
MY
21
26,007
ARS-BFGL-BAC-33968
PY
20
72,851
ARS-BFGL-NGS-29478
MY
21
26,070
BTA-51988-no-rs
FY
PY
20
73,497
ARS-BFGL-NGS-117598
20
73,749
BTA-51296-no-rs
MY
21
26,661
Hapmap60593rs29025761
FY
PY
21
4,359
Hapmap50019-BTA-52721
MY
PY
21
26,782
BTA-51981-no-rs
21
4,500
ARS-BFGL-NGS-44523
PY
21
30,629
Hapmap46427-BTA-51697
MY
PY
PP
PP
FY
PY
PP
MY
FY
PY
PY
FY
PY
PY
MY
PY
PY
MY
FY
Massimo Cellesi
Statistical Tools for Genomic-Wide Studies
Tesi di Dottorato in Scienze dei Sistemi Agrari e Forestali e delle Produzioni Alimentari
Scienze e Tecnologie Zootecniche – Università degli Studi di Sassari
PY
MY
PP
130
22
61,419
Hapmap39470-BTA121373
22
61,644
ARS-BFGL-NGS-41433
23
2,821
BTA-55567-no-rs
FY
23
3,017
ARS-BFGL-NGS-15303
FY
MY
23
7,611
Hapmap50393-BTA-57089
MY
MY
23
7,809
ARS-BFGL-NGS-112194
MY
23
8,319
ARS-BFGL-NGS-44219
PP
23
8,838
BTA-57141-no-rs
PP
23
9,244
Hapmap23991-BTA137000
MY
23
14,993
ARS-BFGL-NGS-8960
MY
23
16,666
ARS-BFGL-NGS-34042
MY
23
17,631
ARS-BFGL-NGS-114979
23
22,371
ARS-BFGL-NGS-20819
PY
23
22,681
UA-IFASA-5859
PY
23
24,748
UA-IFASA-8890
23
25,816
Hapmap28130-BTA137222
MY
MY
23
26,060
ARS-BFGL-NGS-117031
MY
MY
23
27,197
Hapmap47328-BTA-56087
MY
23
29,745
ARS-BFGL-NGS-109612
MY
23
38,839
ARS-BFGL-NGS-88425
PP
23
39,049
BTA-56563-no-rs
PP
23
40,052
BTA-01409-rs29012374
PP
23
40,288
Hapmap57401rs29021597
23
42,523
Hapmap59016rs29021748
PP
FP
23
43,007
BTA-56863-no-rs
PP
BTB-00855998
FP
23
43,029
ARS-BFGL-NGS-95117
PP
58,128
BTA-109257-no-rs
FP
23
43,195
UA-IFASA-4209
PP
60,851
ARS-BFGL-NGS-54563
23
43,681
Hapmap42978-BTA-56919
PP
21
32,960
ARS-BFGL-NGS-104404
MY
21
37,998
ARS-BFGL-NGS-119377
21
40,026
BTB-01533089
21
40,230
Hapmap35241BES8_Contig395_800
21
40,877
BTB-00818669
21
49,392
BTA-52470-no-rs
21
65,869
ARS-BFGL-NGS-2582
22
84
22
982
22
1,071
ARS-BFGL-NGS-39898
PY
22
1,159
BTB-01355483
PY
22
1,317
ARS-BFGL-NGS-118681
PY
22
3,945
Hapmap60454rs29020896
PY
22
4,862
Hapmap46936-BTA113993
PY
22
6,126
BTA-08756-no-rs
MY
22
6,168
ARS-BFGL-NGS-66672
MY
22
6,574
BTB-01641930
22
14,514
ARS-BFGL-NGS-74971
22
19,979
ARS-BFGL-NGS-114883
22
38,334
ARS-BFGL-NGS-87577
FY
22
51,758
Hapmap58292rs29023404
FY
22
51,812
ARS-BFGL-NGS-111216
FY
22
51,910
ARS-BFGL-NGS-102411
FY
22
54,992
Hapmap60563ss46526220
FY
22
55,641
Hapmap41094-BTA-83358
22
57,441
22
22
FY
PY
MY
PY
FP
Hapmap46833-BTA-54748
FY
ARS-BFGL-NGS-103852
PP
PY
MY
PY
PY
PY
PY
Massimo Cellesi
Statistical Tools for Genomic-Wide Studies
Tesi di Dottorato in Scienze dei Sistemi Agrari e Forestali e delle Produzioni Alimentari
Scienze e Tecnologie Zootecniche – Università degli Studi di Sassari
PY
PY
FP
PP
FY
131
24
46,427
Hapmap33939BES5_Contig460_1314
24
47,271
Hapmap56316rs29025240
PP
24
47,359
Hapmap44102-BTA-58355
ARS-BFGL-NGS-41732
PP
24
53,329
ARS-BFGL-NGS-19883
46,011
BTA-56731-no-rs
PP
24
60,413
ARS-BFGL-NGS-45332
23
46,217
ARS-BFGL-NGS-104353
PP
24
62,662
ARS-BFGL-NGS-112116
23
49,704
ARS-BFGL-NGS-108142
PY
24
64,042
BTB-00893217
23
50,770
ARS-BFGL-NGS-119306
PY
25
4,361
ARS-BFGL-NGS-16204
MY
PY
23
51,015
Hapmap39230-BTA-56961
PY
25
4,393
Hapmap30941-BTC018717
MY
PY
23
51,536
ARS-BFGL-NGS-11502
PY
23
51,584
ARS-BFGL-NGS-118139
PY
25
4,426
Hapmap23660-BTC018762
MY
PY
23
51,691
ARS-BFGL-NGS-112069
PY
25
16,557
ARS-BFGL-NGS-18399
23
52,506
BTB-01381524
PY
25
17,233
ARS-BFGL-NGS-16007
23
52,611
ARS-BFGL-NGS-17155
PY
25
17,349
ARS-BFGL-NGS-74312
23
53,092
Hapmap57192rs29027634
PY
25
17,784
ARS-BFGL-NGS-102125
25
22,525
ARS-BFGL-NGS-57864
PP
24
2,619
ARS-BFGL-NGS-108020
MY
25
23,954
ARS-BFGL-NGS-117215
PP
24
7,657
BTB-01414130
MY
25
24,531
ARS-BFGL-NGS-15260
24
21,679
Hapmap59517rs29027550
FY
25
26,103
ARS-BFGL-NGS-31959
FP
24
22,361
ARS-BFGL-NGS-1701
FY
25
26,138
ARS-BFGL-NGS-42319
FP
24
25,540
ARS-BFGL-NGS-108732
MY
FY
25
26,240
ARS-BFGL-NGS-1148
FP
24
29,475
ARS-BFGL-NGS-5141
MY
25
28,024
ARS-BFGL-BAC-42500
FY
24
30,667
BTB-00885200
MY
25
30,630
BTB-01701816
FY
24
30,726
BTB-00885058
MY
25
32,150
ARS-BFGL-NGS-103963
24
34,936
ARS-BFGL-NGS-116211
PY
25
33,271
Hapmap31673-BTC065823
PY
24
35,638
BTB-00886759
PY
25
38,858
ARS-BFGL-NGS-76406
PY
24
37,929
BTB-01978737
25
41,134
ARS-BFGL-NGS-42041
PY
24
38,800
ARS-BFGL-NGS-49210
26
8,781
ARS-BFGL-NGS-37164
24
42,553
ARS-BFGL-NGS-73693
26
9,468
BTB-01211987
23
44,801
ARS-BFGL-NGS-105406
PP
23
45,179
Hapmap47993-BTA-56668
PP
23
45,589
BTB-00869928
23
45,686
ARS-BFGL-NGS-84634
23
45,727
23
PY
FY
PY
PP
FY
FP
PP
PY
PP
PY
MY
PY
FP
FY
PY
MY
PP
FY
MY
PY
PP
PY
Massimo Cellesi
Statistical Tools for Genomic-Wide Studies
Tesi di Dottorato in Scienze dei Sistemi Agrari e Forestali e delle Produzioni Alimentari
Scienze e Tecnologie Zootecniche – Università degli Studi di Sassari
MY
PY
132
26
11,300
BTA-62062-no-rs
PP
26
20,477
ARS-BFGL-NGS-111739
PP
26
28,969
Hapmap50547-BTA102741
FY
26
29,484
BTB-01619529
FY
26
29,566
ARS-BFGL-NGS-43819
FY
26
29,590
Hapmap44427-BTA-92700
FY
26
31,529
ARS-BFGL-NGS-91860
FY
26
32,420
ARS-BFGL-NGS-22409
26
32,480
ARS-BFGL-NGS-89840
FY
26
32,708
BTA-61163-no-rs
FY
26
36,834
ARS-BFGL-NGS-36795
PY
26
41,317
ARS-BFGL-NGS-111901
PY
26
41,545
ARS-BFGL-NGS-10498
PY
26
41,950
ARS-BFGL-NGS-33804
PY
26
43,017
INRA-573
26
46,189
ARS-BFGL-NGS-35886
27
990
27
27
36,004
ARS-BFGL-NGS-35260
PP
27
36,527
Hapmap35718SCAFFOLD271203_2920
27
40,301
BTA-121522-no-rs
27
44,368
ARS-BFGL-NGS-64852
PY
27
44,540
Hapmap41400-BTA101218
PY
27
46,730
ARS-BFGL-NGS-112603
FP
27
46,768
ARS-BFGL-NGS-116840
FP
28
608
28
3,488
ARS-BFGL-NGS-114198
MY
28
6,185
ARS-BFGL-NGS-43798
MY
PY
28
6,469
BTB-00974967
MY
PY
28
7,858
Hapmap57617rs29026743
PY
28
10,431
Hapmap55640rs29014036
PY
28
12,845
ARS-BFGL-NGS-42033
PY
28
14,380
Hapmap50823-BTA-92119
28
15,987
ARS-BFGL-NGS-105316
28
16,091
ARS-BFGL-NGS-1363
28
19,213
Hapmap48416-BTA-63708
MY
28
19,697
Hapmap48125-BTA-92753
MY
28
25,440
ARS-BFGL-NGS-109305
FY
28
27,975
Hapmap55318rs29013309
FY
28
37,463
BTB-01640085
PY
28
41,598
BTA-99379-no-rs
PY
28
43,076
ARS-BFGL-NGS-116671
29
2,118
ARS-BFGL-NGS-13527
29
4,211
BTB-01360311
PP
29
4,598
ARS-BFGL-NGS-18177
PP
29
6,275
ARS-BFGL-NGS-86658
PP
PY
PP
FP
BTA-64665-no-rs
PY
FY
PY
MY
FY
ARS-BFGL-NGS-102273
PY
11,888
BTB-01753761
PY
27
12,293
BTB-01581312
FY
27
12,324
BTB-01581416
FY
27
12,829
Hapmap24215-BTA163266
MY
27
13,049
ARS-BFGL-NGS-21780
MY
27
13,929
BTB-00953522
27
19,314
Hapmap42678-BTA-79248
27
21,188
ARS-BFGL-NGS-110610
PY
27
27,098
ARS-BFGL-NGS-102382
PY
27
29,065
ARS-BFGL-NGS-339
FP
27
29,087
ARS-BFGL-NGS-110867
FP
27
30,697
Hapmap42020-BTA-97693
FY
MY
PY
FP
PY
PY
MY
MY
PY
PY
MY
Massimo Cellesi
Statistical Tools for Genomic-Wide Studies
Tesi di Dottorato in Scienze dei Sistemi Agrari e Forestali e delle Produzioni Alimentari
Scienze e Tecnologie Zootecniche – Università degli Studi di Sassari
133
29
6,415
ARS-BFGL-NGS-112954
PP
29
6,750
ARS-BFGL-NGS-35685
PP
29
7,164
BTB-01892890
PP
29
7,693
ARS-BFGL-NGS-35993
PP
29
12,323
BTB-01007059
PY
29
15,449
BTB-00426200
PY
29
23,628
UA-IFASA-7930
PP
29
26,295
ARS-BFGL-NGS-64656
PP
29
29,653
Hapmap54158rs29026721
29
29,797
Hapmap40781-BTA-65234
29
30,945
ARS-BFGL-NGS-119428
PY
29
32,144
ARS-BFGL-NGS-98534
PY
29
32,284
Hapmap50431-BTA-65530
PY
29
33,147
Hapmap42287-BTA-65439
MY
29
33,423
ARS-BFGL-NGS-109714
MY
29
35,829
Hapmap38768-BTA-66476
MY
29
37,061
ARS-BFGL-NGS-101872
29
41,336
UA-IFASA-9622
PY
29
42,982
ARS-BFGL-NGS-85356
PY
29
43,970
Hapmap34333BES2_Contig145_646
PY
29
48,975
Hapmap41328-BTA-66089
29
49,317
Hapmap24835-BTA140780
29
51,788
ARS-BFGL-NGS-14481
PY
MY
FP
MY
FY
MY
PY
Massimo Cellesi
Statistical Tools for Genomic-Wide Studies
Tesi di Dottorato in Scienze dei Sistemi Agrari e Forestali e delle Produzioni Alimentari
Scienze e Tecnologie Zootecniche – Università degli Studi di Sassari
[S2] Python Script for MDA method
'''
Created on 18/apr/2013
@author: Massimo Cellesi [email protected]
'''
# How to use MDA program:
# In the script's folder must be present:
# the files, termed cromo1.txt, cromo2.txt, ...., cromo29.txt, where the data are stored (animal_name SNP1 SNP2, ...
SNPN)
# 1 file (ebv.txt) where EBVs are stored (animal_name trait1 trait2, ... )
# a folder for each trait with the same name of the trait specified into ebv.txt file (trait1, trait2, ....).
#
# file cromoN.txt (all variables have to be separated by a space)
# animal_name snp1 snp2 snp3 snp4
# Plate24-A01 0 1 2 0
# Plate24-A04 0 1 0 0
#
# file ebv.txt (all variables have to be separated by a space)
# animal_name MY FY PY FP PP
# Plate24-A01 -2154.7 -63.12 -74.27 0.1976 -0.0281
# Plate24-A04 -895.2 -10.7 -45.09 0.2543 -0.1603
#
# Results will be stored into sub-folders MY, FY, ... (these names have to be the same of the traits into the ebv.txt file)
# MDA generates files QTL_B1.txt, QTL_B2.txt, ..., QTL_B29.txt, one for each chromosome.
# nSnp gtype diffMean freqB pboot
# 1 0 0.0 0 0.0
# 2 0 1.8 1 0.1
# 3 0 0.0 0 0.0
# where:
# nSnp is the considered SNP
# gtype is the genotype of maximum difference selected by MDA
# diffMean is not used
# freqB specify how many times the SNP is associated to the trait
# pboot is the posterior probability of bootstrap
import sys, os
from operator import itemgetter
import random
import datetime
from math import sqrt
def main(argv):
global _trait_, _ebv_, _nboot_, _nds_, _best_
if len(argv)>=2:
_trait_=argv[0]
_ebv_=argv[1]
if len(argv)>=3:
_nds_=float(argv[2])
Statistical Tools for Genomic-Wide Studies
Tesi di Dottorato in Scienze dei Sistemi Agrari e Forestali e delle Produzioni Alimentari
Scienze e Tecnologie Zootecniche – Università degli Studi di Sassari
Massimo Cellesi
135
if len(argv)>=4:
_nboot_=int(argv[3])
if len(argv)==5:
if (argv[4]=='True') or (argv[4]=='true') or (argv[4]=='T') or (argv[4]=='t'):
_best_=True
else:
_best_=False
else:
_best_=True
else:
_nboot_=5000
_best_=True
else:
_nds_=1.66
_nboot_=5000
_best_=True
else:
print("syntax:")
print ("python MDA.py trait fileEbv [nds=1.66] [nboot=5000] [best=True[True/False]]")
print ("Example python MDA.py milk ebv.txt")
print ("Example python MDA.py FC ebv.txt 1.96")
print ("Example python MDA.py protein ebv.txt 1.96 1000")
sys.exit(2)
def loadSetting(folderIn, folderOut, trait):
global pathIn, pathOut, feno
pathIn=folderIn+'/'
pathOut = folderOut+'/'+trait+'/'
feno=trait
def leggiTrait(fIn):
#legge il file dei trait e restituisce 2 liste: la prima con i nomi degli animali e la seconda con i trait
fp=pathIn+fIn
f = open(fp, 'r')
head = f.readline().split()
for ncol in range(0, len(head)):
if head[ncol] == feno:
nT=ncol
break
nomi=[]
trait={}
for row in f:
nomi.append(row.split()[0])
trait[row.split()[0]]= float(row.split()[nT])
f.close()
return nomi, trait
def leggiBTA(nBTA):
fp=pathIn+'cromo'+repr(nBTA)+'.txt'
f = open(fp, 'r')
f.readline().split() # si legge la prima riga contenente le intestazioni
dati=[]
for row in f:
Massimo Cellesi
Statistical Tools for Genomic-Wide Studies
Tesi di Dottorato in Scienze dei Sistemi Agrari e Forestali e delle Produzioni Alimentari
Scienze e Tecnologie Zootecniche – Università degli Studi di Sassari
136
dati.append(row.split())
f.close()
return dati # snp
def getDiffMda(primo, secondo):
# restituisce una lista di liste. [nSnp, gtype, diff] nSnp parte da 1!!!!
diff=[]
seq=[]
for i in range(1,len(primo[0])-1): # si parte da 1 perche il primo e' il nome e l'ultimo e' il trait
zp=up=dp=zs=us=ds=0
for j in range(0,len(primo)):
if primo[j][i]=='0':
zp+=1
elif primo[j][i]=='1':
up+=1
elif primo[j][i]=='2':
dp+=1
if secondo[j][i]=='0':
zs+=1
elif secondo[j][i]=='1':
us+=1
elif secondo[j][i]=='2':
ds+=1
if (zp>=up):
if (zp>dp):
diff.append([i,0,zp-zs])
seq.append(zp-zs)
else:
diff.append([i, 2, dp-ds])
seq.append(dp-ds)
elif (up>dp):
diff.append([i,1, up-us])
seq.append(up-us)
else:
diff.append([i,2, dp-ds])
return media(seq), devStd(seq), diff
def media(a):
n=float(sum(a))
return n/len(a)
def varianza(sequence):
#Calcola la varianza della sequenza.
med = media(sequence)
return sum([(x-med)**2 for x in sequence]) / len(sequence)
def devStd(sequence):
#Calcola la deviazione standard della sequenza.
return sqrt(varianza(sequence))
def scriviQTL(ris, ncrom, Best):
if Best:
fp=pathOut+'QTL_B'+repr(ncrom)+'.txt'
else:
fp=pathOut+'QTL_W'+repr(ncrom)+'.txt'
Massimo Cellesi
Statistical Tools for Genomic-Wide Studies
Tesi di Dottorato in Scienze dei Sistemi Agrari e Forestali e delle Produzioni Alimentari
Scienze e Tecnologie Zootecniche – Università degli Studi di Sassari
137
f = open(fp, 'w')
f.write("nSnp gtype diffMean freqB pboot\n")
for line in ris:
for x in line:
f.write("%s " % x)
f.write("\n")
f.close()
def getNBW(numC):
if numC < 1000:
return int(numC *0.1)
elif numC < 1500:
return int(numC * 0.09)
elif numC < 2000:
return int(numC * 0.085)
elif numC < 3000:
return int(numC * 0.08)
elif numC < 4000:
return int(numC * 0.07)
elif numC < 5000:
return int(numC * 0.06)
elif numC < 7000:
return int(numC * 0.05)
else:
return int(numC * 0.45)
def getNumCampione(numPop):
if numPop<1000:
return int(numPop * 0.7)
elif numPop<2000:
return int(numPop * 0.66)
elif numPop<5000:
return int(numPop * 0.6)
elif numPop<8000:
return int(numPop * 0.55)
else:
return int(numPop * 0.5)
def bootQtl(nboot, chrIni, chrFin, nds, Best, fileTrain, numC=-1, nBW=-1):
now=datetime.datetime.now()
h=now.hour*100
m=now.minute
seed=h+m
random.seed(seed)
nomiAn, t=leggiTrait(fileTrain)
if numC == -1:
numC=getNumCampione(len(nomiAn))
if nBW == -1:
nBW=getNBW(numC)
for ncrom in range(chrIni,chrFin+1):
print "BTA N.", ncrom, "...", datetime.datetime.now()
d=leggiBTA(nBTA=ncrom)
datiChr=[]
# prendo in esame solo gli animali di training
Massimo Cellesi
Statistical Tools for Genomic-Wide Studies
Tesi di Dottorato in Scienze dei Sistemi Agrari e Forestali e delle Produzioni Alimentari
Scienze e Tecnologie Zootecniche – Università degli Studi di Sassari
138
for i in range(0,len(d)):
if d[i][0] in nomiAn:
d[i].append(t.get(d[i][0])) # nell'ultimo elemento abbiamo ebv
datiChr.append(d[i])
nr=len(datiChr) # nr contiene il numero di animali
for nb in range(0,nboot):
lrnd=random.sample(xrange(nr), numC)
lrnd=sorted(lrnd)
datiRnd=[]
for i in lrnd:
datiRnd.append(datiChr[i])
t_ord= sorted(datiRnd, key=itemgetter(len(datiRnd[0])-1))
chrW = t_ord[:nBW]
chrB = t_ord[-nBW:] # si toglie l'ultimo elemento che e' l'EBV
if Best:
mean, ds, diffBW = getDiffMda(chrB, chrW)
else:
mean, ds, diffBW = getDiffMda(chrW, chrB)
soglia=mean+ds*nds
for i in diffBW:
if i[2]<soglia:
i[2]=0
i.append(0)
else:
i.append(1)
# risMDA e' una lista di liste del tipo [nSnp, gtype, diff, freq]
if nb == 0:
risMDA = diffBW[:]
else:
for i in range(len(risMDA)):
if diffBW[i][2]>0 and (risMDA[i][1]==diffBW[i][1] or risMDA[i][2]==0): # stesso genotipo
risMDA[i][2]+=diffBW[i][2] # si sommano le diff
risMDA[i][3]+=diffBW[i][3] # is incrementa freq
for snp in risMDA:
snp.append(float(snp[3])/nboot)
snp[2]=float(snp[2])/nboot
# si aggiunge la colonna pboot
scriviQTL(risMDA, ncrom, Best)
# ---------------------------- MAIN PROGRAM ----------------------------if __name__ == '__main__':
main(sys.argv[1:])
loadSetting(folderIn=os.getcwd(), folderOut=os.getcwd(), trait=_trait_)
bootQtl(nboot=_nboot_, chrIni=1, chrFin=29, nds=_nds_, Best=_best_, fileTrain=_ebv_)
Massimo Cellesi
Statistical Tools for Genomic-Wide Studies
Tesi di Dottorato in Scienze dei Sistemi Agrari e Forestali e delle Produzioni Alimentari
Scienze e Tecnologie Zootecniche – Università degli Studi di Sassari
Scarica