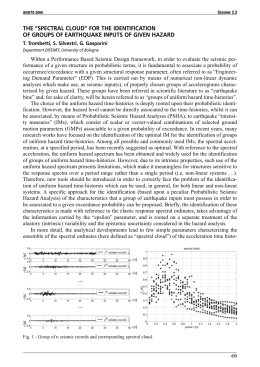
Primopiano SPECIALE: GIAPPONE UN ANNO DOPO Lessons from the To-hoku earthquake It’s been about a year since an earthquake of high intensity, followed by a spectacular tsunami, upset the northeastern coast of Japan. The variation of the terrestrial axis, the increase in the speed of rotation of the earth, with consequent shortening of the duration of the day of 1.6 microseconds, and the movement of some meters of Honshu towards west are some of the exceptional consequences of the event. The resulting tsunami, which caused the highest number of victims and the nuclear accident at the Fukushima Dai-ichi power plant, has made it one of the most important natural disasters in history Lezioni dal terremoto di To-hoku È passato circa un anno da quando un evento sismico di elevatissima intensità, seguito da uno spettacolare tsunami, sconvolgeva la costa nord-orientale del Giappone. Tra gli effetti eccezionali vanno ricordati la variazione dell’asse terrestre, l’aumento della velocità di rotazione terrestre, con conseguente accorciamento della durata del giorno di 1,6 microsecondi, e lo spostamento di alcuni metri dell’isola di Honshu. Il conseguente tsunami, che ha determinato l’elevatissimo numero di vittime e l’incidente nucleare alla Centrale di Fukushima Dai-ichi, ne hanno fatto una delle catastrofi naturali più importanti della storia n Giovanni Bongiovanni, Paolo Clemente, Vladimiro Verrubbi Features and effects of the event The main event of the seismic sequence that affected the northeast coast of Japan began on 11 March 2011 at 14:46 (Japan local time) in an area where the Pacific Plate plunges under a strip of North American plate, which is wedged between the Pacific and the Eurasian ones (Figure 1). From the hypocenter, at about 130 km from the coast and at a depth of about 24 km, the rupture propagated both to the North and to the South, affecting an area over 400 km long and 200 km wide (Figure 2). The moment magnitude was estimated to be 9.0. The earthquake generated a tsunami of significant size, the source of which coincides with the eastern end of the above area. n Giovanni Bongiovanni, Paolo Clemente, Vladimiro Verrubbi ENEA, Technical Unit for Environmental Characterization, Prevention, and Recovery FIGURE 1 Tectonic of the earthquake area EAI Energia, Ambiente e Innovazione 2/2012 43 FIGURE 2 Area affected by the rupture FIGURE 3 Shindo JMA intensity (right), accelerometric recording close to NPP (left) FIGURE 4 The network of buoys of the early warning system and a complete record EAI Energia, Ambiente e Innovazione 2/2012 44 The devastating effects of the earthquake and, mostly, of the tsunami in terms of lives lost and in terms of destruction of the area are well known, here we only report the description of the physical effects measured, with particular reference to nuclear plants. Figure 3 shows, on the right, the seismic intensity measured on the Shindo scale of Japan Meteorological Agency (JMA), and on the left the accelerometric recordings in the vicinity of nuclear installations. It should be pointed out that the Shindo intensity is provided directly from gauges located throughout Japan. The amplitude of the waves of tsunami was measured by a network of buoys (Figure 4) that transmit real-time measurements to a central and constitute part of the early warning system. In general, the first arrival of the waves occurred just minutes after the seismic event, while the maximum height occurred after about one hour. In Figure 4, a complete record of a buoy is also reported, which shows the sequence of tsunami waves that continued for several hours. The maximum height measured by buoys reached about 10 m; it must be said, however, that in many cases the buoys did not work properly, so the waves may have been much higher. The run-up, i.e., the height reached by the wave (relative to sea level) on the mainland, was far greater than the height measured by the buoys. Figure 5 compares the run-up achieved in this earthquake with those of two SanRiku historical earthquakes of FIGURE 5 Comparison of the today run-up to those of the San-Riku earthquakes of 1896 and 1933 FIGURE 6 a) Stone monument seen from the village; b) Effects of tsunami approximately 100 m downstream of the stone monument FIGURE 7 Stone monument FIGURE 8 a) Protective wall in Miyako destroyed by the tsunami; b) Protective wall in Fudai EAI Energia, Ambiente e Innovazione 2/2012 45 Primo Piano 1896 (magnitude 8.5) and 1933 (magnitude 8.4), respectively. It is clear that, in the most severely affected area, events of lower magnitude happened in the past, which led to run-ups comparable with those of the 2011 earthquake. Figure 6 provides a confirmation of occurrence in the past in the same area of tsunami with higher run-ups. In Figure 6a, we see a stele called “stone monument”, near the village of Aneyoshi, indicating the limit reached by previous tsunamis, beyond which it is suggested not to build; the picture in Figure 6b, taken about 100 m above the stele to the coast, shows the effects of the recent tsunami. The run-up in this site was about 40 m. The stele (Figure 7) is one out of hundreds in Japan: obviously someone did not believe in the truthfulness of these historical documents. Figure 8 shows that while Fudai administrators learned from the experiences of the past with the construction of protective walls 15.5 meters high, enough to deal with the tsunami, in Miyako 10 m high walls were completely inadequate. FIGURE 9 Comparison between observed spectrum and the corresponding response of DBGM The Fukushima Daiichi nuclear power plant The nuclear plant in Fukushima Dai-ichi had 53 triaxial seismometers on structures and on the ground. The ground motion was recorded in 29 points and records were stopped between 130 and 150 s from the beginning, due to malfunction (elsewhere records have durations of 300 s). The acceleration measured at the basement reached peak values in the WE direction up to 0.55 g, against the expected response values equal to about 0.45 g, according to the DBGM Ss (Design Basis Ground Motion Seismic standard). Figure 9 shows the comparison between the response spectrum of the observed motion and the response spectra of DBGM Ss. Despite the exceeding acceleration peak values and spectral amplitudes, the structure suffered no damage attributable directly to seismic action. The earthquake, however, had a major impact on the structures of the power supply system causing the loss of power itself, and thereby initiating the sequence of nuclear EAI Energia, Ambiente e Innovazione 2/2012 46 FIGURE 10 Maximum wave arrival at the site of Fukushima Dai-ichi emergency. The Dai-ichi nuclear plant was powered by 6 external lines all damaged by the earthquake. As well known, the damage to the system was due to the tsunami. Figure 10 shows the maximum wave arrival on the plant. Seismic hazard considerations After the Hanshin-Awaji earthquake of January 17, 1995, several initiatives were undertaken in Japan that led the National Institute for Earth Science and Disaster Prevention (NIED) to start the project National Seismic Hazard Mapping Project of Japan under the guidance of the Earthquake Research Committee of Japan (ERCJ), based on the assessment of long-term seismic activity and strong movements (strong motion). The work, started in 2001 and completed in March 2005, led to the production of two types of hazard maps: the Probabilistic Seismic Hazard Map (PSHM), which shows the relationship between seismic intensity value and its probability of exceedance within a certain period, and the Scenario Earthquake Shaking Map (SESM). PSHM is based on the modeling of seismic activity produced by ERCJ, on an empirical strong motion attenuation relationship to evaluate the peak velocity at the engineering bedrock (characterized by S wave velocity VS ≥ 400 m/s) and from these to the surface through a model of the superficial soil layers to account for local site effects amplification factors; the calculations are performed on a national grid of about 1 km spacing. Similarly JMA seismic intensities on the same grid were evaluated with an empirical attenuation relationship. SESM maps have been produced based on simulation modeling of the source for which enough information was available, in order to assess the waveforms on engineering bedrock and peak acceleration and velocity at the surface points of a mesh of 1 km side. Figures 11 and 12 report, respectively, the distribution of the amplification factors of the surface layers of the soil and the distribution of subduction zones and the 98 major faults where ERCJ as- FIGURE 11 Amplification factors of the soil surface layers FIGURE 12 Subduction zones and 98 major faults FIGURE 13 Probability of exceeding (a) the JMA 6-low e (b) the JMA 5-low in 30 years sessed the probability of occurrence of earthquakes. Figure 13 shows the distributions of probability of exceedance in 30 years (from January 2005) of the intensity 6low and 5low. Figure 14 reports scenario maps for areas where detailed information was available. From a comparison between Figure 3 and 13 it appears that Japanese hazard maps, although produced with enormous wealth of resources, failed their purpose. Although outside the scope of this work, it is still worth noting EAI Energia, Ambiente e Innovazione 2/2012 47 Primo Piano that significant discrepancies between maps and reality had been detected in a timely manner (Toda and Awata, 2008). Indeed, they noticed that in recent years as many as 5 destructive earthquakes (JMA ≥ VI) had occurred in areas where the official probability of occurrence was less than 3%, and that the Noto Hanto earthquake of March 25, 2007 (magnitude 6.9), struck an area of hazard even lower (Figure 15). They conclude that the epicentral region of this earthquake could be attributed a significant probability of generating a magnitude 6.3-6.8 if they had used all available data. Another element of discrepancy was already observed: the response spectra of accelerograms recorded at the basement of the nuclear reactors of Dai-ichi are different from those of design both as form and as frequency content. Since the structure, as ascertained, was not damaged, it could be argued however that the security objective has been achieved, but it is also legitimate to raise the doubt that the erroneous definition of the seismic motion can result in an unjustified increase in costs and/or structural damage from seismic events other than this one. With respect to the tsunami, it is observed that at the time of the Dai-ichi nuclear power plant design the reference tsunami was the one originated by the Chile earthquake (1960, magnitude 9.5) with a design height of 3.1 m. In 2002, the design wave height was reevaluated on the basis of the Tsunami Assessment Method for Nuclear Power Plants in Japan (produced by Tsunami Evaluation Subcommittee, Nuclear Civil Engineering Committee, Japan Society of Civil Engineering), based on the earthquake off the Fukushima Prefecture in 1938, a magnitude of 7.9, bringing the wave height between 5.4 and 5.7 m. These values of tsunami wave height, for both the effects on nuclear installations and the effects extended to the whole region, are in stark contrast to the reported historical run-up data (Figure 5) and with the testimonies of stone monument. FIGURE 14 Scenario maps for areas where detailed information was available FIGURE 9 Location of strong Carthquakes in Japan PSHM EAI Energia, Ambiente e Innovazione 2/2012 48 Conclusions If the To-hoku earthquake was not followed by the tsunami, with its spectacular consequences on nuclear facilities, probably the uncertainties and doubts on the estimation of the hazard would remain within the scientific discussions. The lesson of the earthquake in To-hoku, however, may be useful for the Italian situation. With reference to L’Aquila earthquake of 2009, Masi (2009) wrote: “The comparison between the recordings available in the four stations closest to the epicenter of the RAN network (stations code AQA, AQG, AQV and AQK) with the actions envisaged by NTC 2008 shows that, in terms of peak ground acceleration (PGA), the recorded value is always greater than that expected for a return period TR = 475 years, i.e. the reference value for designing ordinary works compared to Preservation of Life Limit State. The PGA values are comparable with Acknowledgements sents more effectively than PGA the destructive potential of a seismic event. The comparison in terms of HI shows that the recorded actions in some cases still exceed those for TR = 475 years, but not those for TR = 2475 years”. Obviously, the effects of an earthquake also depend on the vulnerability of the structures affected, but it is clear that: • the standard methods of seismic hazard assessment showed deficiencies; • although the actual seismic actions far exceeded the design ones of the most recent code, most of the buildings in L’Aquila passed the earthquake with little damage. Consequently, the definition criteria of seismic input should be revised and an extensive campaign of experimentation should be started to evaluate the real behavior of buildings, in order to review the criteria for modeling and analysis. These are proposals that we had already made almost thirty years ago ... Figures 1÷6, 8÷10 are from “Report of the Japanese Government to the IAEA Ministerial Conference on Nuclear Safety” - June 2011 (http://www.iaea.org/newscenter/focus/ fukushima/japan-report/) Figures 11-14 are from Hiroyuki Fujiwara, Shinichi Kawai, Shin Aoi, Nobuyuki Morikawa, Shigeki Senna, Kyoko Kobayashi, Toru Ishii, Toshihiko Okumura e Yuzuru Hayakawa “National Seismic Hazard Maps of Japan”. Bull. Earthq. Res. Inst. Univ. Tokyo Vol. 81 (2006) pp.221-232) http://www.eri.u-tokyo.ac.jp/BERI/pdf/IHO81304.pdf Figure 7 is from http://www.nytimes.com/2011/04/21/world/asia/21stones.html?_r= 1&pagewanted=all References Figure 15 is from Toda e Awata (2008). [1] Bazzurro P., Benedettini F., Clemente P., Martinelli A., Salvatori A. (2009). “Lezioni dal terremoto dell’Abruzzo: il comportamento degli edifici visto dall’angolo prospettico della regola d’arte nel costruire”. Energia, Ambiente e Innovazione, ENEA, Roma, No. 3, 28-45. [2] Bazzurro P., Alexander D., Clemente P., Comerio M., De Sortis A., Filippou F., Goretti A., Jorjani M., Mollaioli F., Mosalam K., Price H.J., Court C.P., Schotanus M., Stewart J. (2009). Learning from Earthquakes. The Mw 6.3 Abruzzo, Italy, Earthquake of April 6, 2009. EERI Special Earthquake Report — June 2009 [3] Bongiovanni G, Clemente P., Verrubbi V. (2011). “Il terremoto di To-hoku dell’’11 marzo 2011”. Energia, Ambiente e Innovazione, No. 1-2, 16-20, ENEA, Roma. [4] Çelebi M., Bazzurro P., Chiaraluce L., Clemente P., Decanini L., De Sortis A., Ellsworth W., Gorini A., Kalkan E., Marcucci S., Milana G., Mollaioli F., Olivieri M., Paolucci R., Rinaldis D., Rovelli A., Sabetta F. and Stephens C., (2010). “Recorded Motions of the Mw6.3 April 6, 2009 L’Aquila (Italy) Earthquake and Implications for Building Structural Damage: A Review”. Earthquake Spectra, Volume 26, No. 3, pages 651–684, August 2010; © 2010, Earthquake Engineering Research Institute. [5] Clemente P. (2011). “To-hoku Earthquake of March 11th, 2011”. Contribution to Italy in Japan 2011. Science, Technology and Innovation. http://www.enea.it/it/internazionali/enea-in-japan2011/ [6] Geller J.R. Shake-up time for japanes seismology NATURE| doi:10.1038/nature10105 - 2011 [7] IAEA (2011) Missione Report The Great East Japan Earthquake Expert Mission 24 may - 2 June 2011, http://www-pub.iaea.org/MTCD/Meetings/PDFplus/2011/cn200/documentation/ cn200_Final-Fukushima-Mission_Report.pdf [8] Japanese Government (2011) “Report of the Japanese Government to the IAEA Ministerial Conference on Nuclear Safety” -June 2011. http://www.iaea.org/newscenter/focus/ fukushima/japan-report/ [9] Masi A. (2009) Prime riflessioni sull’esperienza del terremoto in Abruzzo. Assemblea Nazionale dei Presidenti degli Ordini degli Ingegneri Roma 9 maggio 2009, http://www.tuttoingegnere.it/ITA/In-evidenz/Il-terremo/TERREMOTO-Opuscolo—visualizzazione.pdf [10] Toda S. and Awata Y. (2008) Active Fault Research Center, Geological Survey of Japan, AIST, site 7, 1-1-1 Higashi Tsukuba, Ibaraki 305-8567, Japan: Does the 2007 Noto Hanto earthquake reveal a weakness in the Japanese national seismic hazard map that could be remedied with geological data? Earth Planets Space, 60, 1047–1052. EAI Energia, Ambiente e Innovazione 2/2012 49 Primo Piano those expected for a return period TR = 2475 years (i.e. the maximum value expected for the design of strategic works compared to the limit state of collapse), except for the site AQV where, even for TR = 2475 years, the expected value is lower than that recorded. As an alternative to a parameter such as PGA an integral parameter was also considered such as Housner Intensity HI (area under the pseudovelocity spectrum calculated to 5% of damping in the range of 0.2-2 seconds), which repre-
Scaricare
pdf