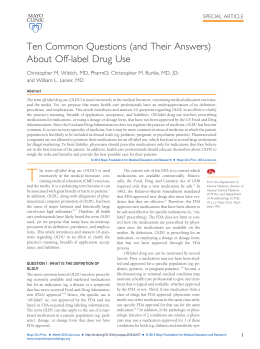
Clin Chem Lab Med 2014; 52(11): 1625–1631 Federica Braga*, Simona Ferraro, Roberta Mozzi and Mauro Panteghini The importance of individual biology in the clinical use of serum biomarkers for ovarian cancer Abstract Background: An increased focus on the biological behaviour of serum biomarkers for ovarian cancer, i.e., carbohydrate antigen 125 (CA-125) and human epididymis protein 4 (HE4), has been advocated to improve their clinical use. Due to the paucity and poor design of available studies evaluating biological variation (BV) of CA-125 and the lack of BV data for HE4, in this study we evaluated BV of both biomarkers. Methods: Monthly we obtained serum samples from 14 pre- (PreM) and 14 post-menopausal (PostM) healthy women for 4 consecutive months. Once all samples were available, they were analysed in a single run in duplicate for CA-125 and HE4 on Roche Modular system. Data were analysed by ANOVA. Results: For both biomarkers no difference in median concentrations was found between PreM and PostM. For CA-125 the intra-individual CV (CVI) was not different between groups (9.1% in both). For HE4 CVI was higher in PreM (12.1%) than in PostM (6.5%) (p < 0.001). Betweensubject CVs were 10.6% for CA-125 and 16.4% for HE4, with no influence by the fertility status. Both biomarkers showed high individuality meaning that the use of population-based reference limits may have limited value for their interpretation. Reference change values were 26% for CA-125 (all), 34% for HE4 PreM and 18% for HE4 PostM. Conclusions: Monitoring longitudinal changes in serum concentrations of ovarian cancer biomarkers over time is probably better than using single threshold rules. According to differences in BV due to the hormonal status, one should differently interpret HE4 changes in PreM and PostM. *Corresponding author: Federica Braga, Clinical Pathology Unit, ‘Luigi Sacco’ University Hospital, Via GB Grassi 74, 20157 Milan, Italy, Phone: +39 02 3904 2743, Fax: +39 02 503 19835, E-mail: [email protected] Federica Braga and Mauro Panteghini: Clinical Pathology Unit, ‘Luigi Sacco’ University Hospital, Milan, Italy; and Centre for Metrological Traceability in Laboratory Medicine (CIRME), University of Milan, Milan, Italy Simona Ferraro and Roberta Mozzi: Clinical Pathology Unit, ‘Luigi Sacco’ University Hospital, Milan, Italy Keywords: biological variation; carbohydrate antigen 125; human epididymis protein 4; reference change value. DOI 10.1515/cclm-2014-0097 Received January 27, 2014; accepted April 17, 2014; previously published online May 15, 2014 Introduction Carbohydrate antigen 125 (CA-125) is a high molecular mass ( > 200 kDa) glycoprotein, recognised by the monoclonal antibody ovarian cancer (OC) 125, mainly expressed by tissues of Müllerian duct origin [e.g., epithelial OC] [1]. CA-125 is the established biomarker for detecting OC recurrence and monitoring therapeutic response [2]. In addition, recent guidelines have recommended its measurement in the primary care setting in women with suggestive symptoms or at high risk for OC [3]. Human epididymis protein 4 (HE4) is a protein characterised as part of the four-disulfide core protein family, containing whey acid protein domains. HE4 has homology with some secreted serine protease inhibitors and was reported to be amplified in some CA-125-deficient OCs, whereas its expression is lower in normal ovarian tissue, ovarian benign disease and low-malignant potential tumours [4]. According to a recent meta-analysis, HE4 measurement has emerged to overcome CA-125 in terms of diagnostic performance for identification of OC in women with suspected gynaecological disease [5]. The replacement of CA-125 with HE4 appears advisable, but more focus has been advocated on the evaluation of assay performance and in the selection of adequate interpretation strategies [6]. In this regard, the knowledge of marker biological variation (BV) is an information important both for deriving analytical goals for measurements and to define unbiased marker interpretation [6]. In agreement with recommendations by Fraser and Harris [7], to correctly derive BV data enrolled subjects should be under strictly controlled conditions to remove pre-analytical sources of variation and ostensibly healthy to ensure that any detected fluctuation of the analyte is not caused by superimposed pathophysiologic variations. Brought to you by | Università degli Studi di Milano Authenticated Download Date | 10/1/14 3:33 PM 1626 Braga et al.: Individual biology of serum biomarkers for ovarian cancer Furthermore, biological samples should be taken at set time intervals, immediately processed and stored frozen. Only when all specimens are available, analysis should be performed in a single run in duplicate. This permits to avoid between-run analytical variation and to directly estimate within-run CV from results of duplicates. The statistical analysis of data, including evaluation of their distribution, identification of outlying observations, data transformation (if any) and approach to derive BV components is another important aspect. Unfortunately, the few available studies evaluating CA-125 BV suffered important limitations, collecting serial samples at a variable time distance, also during menstruation [8–10], blending CA-125 results from subjects in pre- and post-menopausal status [8, 10] or enrolling individuals with potential interfering conditions (e.g., carrying other malignancies) [10]. Furthermore, in only one study [9] all samples were analysed as recommended in the same analytical batch and information on the obtained data normal distribution was never reported. Problems can be encountered with markers showing a biologic behaviour that does not meet assumptions needed to apply statistical parametric models traditionally recommended to investigate the different sources of variability [11]. In particular, the biological CV, a parametric statistics describing the distribution of a set of values, should, by definition, not exceed approximately 33.3%, because negative marker values cannot be assumed [12, 13]. Thus, it is evident that extremely high biological CVs reported in literature for CA-125 may represent an incorrect estimate due to the non-normal data distribution, where the standard deviation (SD) is no longer an appropriate statistical parameter. On the other hand, no BV data are currently available for HE4 [6]. As the current lack of reliable data on BV represents a major shortcoming for the effective application of measurements of serum biomarkers for OC, we planned a study to estimate BV parameters of CA-125 and HE4 and derived indices in the same cohort of women, partitioned according to pre- and post-menopausal status, by adopting an accurately designed experimental protocol paying extra attention to pre-analytical sources of variability and to statistical analysis of data. Materials and methods Subjects and samples We recruited 28 apparently healthy women (14 pre- and 14 post-menopausal, ages 25–68 years) among the ‘Luigi Sacco’ University Hospital health staff (all Caucasian subjects). Ostensibly healthy subjects were studied to ensure that any OC marker fluctuation in serum could truly reflect biology and not modifications due to pathologic processes. All participants were interviewed at time of the study to confirm that they were free of any evident disease, had no history of chronic disease and did not receive any medication. Other criteria for inclusion were that pre-menopausal women have regular menstrual cycles and do not use hormonal contraceptives. The menopausal status was determined according to the criteria reported by the Nurses’ Health Study [14]. Accordingly, women are considered post-menopausal if they have not had a menstrual period for > 12 months due to natural causes. None of the subjects consumed substantial ( > 10 g of ethanol/day) quantities of alcohol or was smoker. The subjects maintained their usual lifestyle throughout the study. In accordance with the Helsinki II Declaration, the design and execution of the experiment were explained thoroughly to the subjects and informed consent was obtained. We collected a total of four venous blood samples from each of 28 study participants. Samples were obtained monthly for 4 consecutive months (February–May). In women in pre-menopausal status the blood was always collected between 12th and 14th day of the menstrual cycle, corresponding to their ovulation period. All blood samples were obtained between 09.00 and 09.30 a.m. from seated subjects, who had overnight fasted and had not exercised that morning, by the same skilled phlebotomist with minimal stasis, using a 20 G straight needle directly into 4-mL vacuum collection tubes with no anticoagulant and polymer gel for serum separation (Becton Dickinson Vacutainer ref. no. 369032). Blood specimens were separated by centrifugation and immediately aliquoted and stored at –80 °C until analysis. Analytical procedures and measurement protocol When all specimens were available, they were thawed, mixed, centrifuged and analysed in a single run in duplicate in random order. To further minimise analytical variation, a single analyst performed all the assays using single lots of reagents. Both CA-125 and HE4 were measured in the same aliquot on the Modular Analytics EVO automated system (Roche Diagnostics) using electrochemiluminescent immunoassay principle (ECLIA). All analyses were performed in strict accordance with the manufacturer’s instructions and by checking the system alignment before the run by PreciControl Tumor Marker materials (Norm and Path) for CA-125 and PreciControl HE4 materials (Norm and Path) for HE4 according to the manufacturer’s established validation range. Statistical analysis Cochran’s test (Ct) was performed for outlier identification among observations and within-subject variances, whereas Reed’s criterion was used for identification of outliers among mean values of subjects [7]. After outlier exclusion, a normality test (Shapiro-Wilk test) was applied separately to the set of results from each individual to check data distribution and validate the normality hypothesis. The same test was used to evaluate the distribution of values for both markers in all subjects and in pre- and post-menopausal groups separately. If this test rejected the hypothesis of normality, the Kolmogorov-Smirnov test was applied. If even this test confirmed a skewed Brought to you by | Università degli Studi di Milano Authenticated Download Date | 10/1/14 3:33 PM Braga et al.: Individual biology of serum biomarkers for ovarian cancer 1627 distribution, a natural logarithmic scale transformation was applied. The Shapiro-Wilk test was then repeated on the log-transformed values and the hypothesis of normality verified. Symbols and formulae used in the study are reported in Table 1. The analytical, within-subject and between-subject components of variation were calculated by nested ANOVA from replicate analyses. SDA2 was estimated from the duplicate results of every specimen, SDI2 from the total within-subject variance (referred to as the variance of the mean of duplicate assays) minus one-half the analytical variance and SDG2 from the total variance of data minus the analytical and intra-individual components. All the components of variance were then transformed to the relevant CV using the overall means. In case of log-transformed data, obtained SDI2, SDG2 and overall mean were converted back via inverse natural logarithmic function before to derive CVs. The index of individuality (II), yielding information about the utility of conventional population-based reference intervals, the reference change value (RCV) and the number of specimens (n) that should be collected to estimate the homeostatic set point of an individual were also estimated. To study the heterogeneity of within-subject variation, we estimated the index of heterogeneity (IH) that is the ratio of the observed CV of the set of individual variances (including analytical variance) (SDS2) to the theoretical CV, which is [2/(k–1)]1/2 where k is the number of specimens collected per subject. The SD of the difference between this ratio and its expected value of unity (under the hypothesis of no heterogeneity of true within-subject variances) is 1/(2k)1/2. A significant heterogeneity is present if the ratio differs from unity by at least twice this SD [7]. In this study, with four data for each subject, an IH < 0.707 indicates that the within-subject data are homogeneous. Optimal, desirable and minimum analytical goals for imprecision, bias and total error were obtained from BV components according to Fraser et al. [15]. Mann-Whitney rank sum test was used to compare marker medians between pre- and post-menopausal groups. F-test was applied to assess statistical difference in intra-individual variances from preand post-menopausal women. Finally, univariate regression models were applied to test the hypothesis of dependence of marker results upon age and menopausal status. Table 1 Symbols and formulae for the variance components and other statistics used in the study. SDT2 SDS2 SDA2 SDI2 SDG2 CVS CVA CVI CVG II RCV n IH Total variance of all measurements (SDA2+SDI2+SDG2) Average within-subject total variance Average within-run analytical variance Average within-subject biological variance (SDS2–1/2SDA2) Between-subject biological variance ([(2kr–1)/2k(r–1)] {SDT2–SDA2–[(2kr–2)/(2kr–1)]SDI2}, where k is the number of specimens per subject and r is the number of subjects) Within-subject total coefficient of variation Analytical coefficient of variation Within-subject biological coefficient of variation Between-subject biological coefficient of variation Index of individuality (SDS2/SDG2) Reference change value [2.77(CVA2+CVI2)1/2] Number of specimens required to ensure that the mean result is within ± 10% of the individual’s homeostatic set point [1.962(CVA2+CVI2)/100] Index of heterogeneity (CVS/[(2/k–1)1/2 × 100], where k is the number of specimens per subject) Results The study involved collection of 112 blood samples, each assayed in duplicate yielding 224 analytical results. All results were well above assay detection limits (0.6 kU/L for CA-125 and 15 pmol/L for HE4, respectively). No observations were removed as statistical outliers (Ct value: 0.08 for CA-125 and 0.13 for HE4; p > 0.10). One within-subject variance was detected as statistical outlier for CA-125 and data from the corresponding individual were eliminated. After removing the outlier subject, Ct was repeated and no further within-subject variance outliers were found (Ct value: 0.19; p > 0.20). Using Reed’s criterion, no mean values of markers were detected as statistical outlier. In summary, the suitable number of subjects for BV estimate were 27 (13 pre-menopausal and 14 post-menopausal women) for CA-125 and 28 (14 pre-menopausal and 14 postmenopausal women) for HE4, respectively. The Shapiro-Wilk test accepted the hypothesis of normality for the distribution of the majority of intraindividual marker values (100% for CA-125 and 89% for HE4, respectively). Figure 1 shows the individual mean and absolute range of values for CA-125 and HE4. The HE4 values in the whole group of women were normally distributed (p = 0.16), while those of CA-125 failed the normality test (p < 0.001). For the latter the Kolmogorov-Smirnov test confirmed the skewed distribution. As a consequence, while HE4 statistics to derive BV components were directly performed on raw data, for CA-125 a natural logscale transformation was applied before calculation. The Shapiro-Wilk test was repeated for the CA-125 individual mean values obtained from log-transformed data and the hypothesis of normality was finally accepted (p = 0.59). Table 2 shows marker median values, estimated average analytical and biological variability components (as CV) and derived indices. For both biomarkers, no differences in concentrations between pre- and postmenopausal women were detected (p = 0.15 for CA-125 and p = 0.46 for HE4, respectively). Furthermore, neither age nor menopausal status (p = 0.37 for CA-125 and p = 0.76 for HE4, respectively) influenced marker concentrations. For CA-125 intra-individual variances were also not different between the two groups (p = 0.48), while the within-subject biological CV (CVI) for HE4 was approximately two times higher in pre- than in post-menopausal women (p < 0.001). II were always < 0.6, meaning that population-based reference limits and/or fixed marker threshold levels may have scarce utility in the interpretation of marker results [16]. Regarding RCV, the value that can be assumed to guide clinical decision making when CA-125 is tested using serial measurements is approximately 25%, with no impact of Brought to you by | Università degli Studi di Milano Authenticated Download Date | 10/1/14 3:33 PM 1 1 2 2 3 3 4 4 Premenopausal women Premenopausal women 1628 Braga et al.: Individual biology of serum biomarkers for ovarian cancer 5 6 7 8 9 10 7 8 9 10 11 12 12 13 13 1 14 1 2 2 3 4 3 4 Postmenopausal women Postmenopausal women 11 5 6 5 6 7 8 9 10 5 6 7 8 9 10 12 11 12 13 13 11 14 14 0 2 4 6 8 10 12 14 16 18 20 22 24 26 28 30 32 34 36 38 40 28 30 32 34 36 38 40 42 44 46 48 50 52 54 56 58 60 62 64 66 68 70 72 74 76 CA125, kU/L HE4, pmol/L Figure 1 Individual mean and absolute range of carbohydrate antigen 125 (CA125) and human epididymis protein 4 (HE4) values in studied subjects. hormonal status. Differently, for HE4 RCV values are markedly dependent from hormonal status of women (34% and 18% for pre- and post-menopausal women, respectively). As RCV figures in this study were derived from a protocol of measurements carried out under strictly controlled analytical conditions, we also estimated RCVs using analytical CVs (CVA) derived from daily routine performance of employed assays. For CA-125, we used the yearly (2012) average CVA obtained in our laboratory (2.9%) [17] that employed together with the 9.1% CVI derived in this study, gives a RCV of 26.5%. As HE4 determination is not yet implemented in our laboratory for clinical application, for this marker we used the average CVA reported by the manufacturer in its package insert (2.9%; range 2.6–3.2) obtained following the Clinical and Laboratory Standards Institute EP5-A2 protocol (two runs in duplicate per day for 21 days on 5 human sera with different HE4 concentrations) [18]. Derived HE4 RCVs were 34.5% for pre- and Table 2 Median values, estimated average analytical and biological variability components (as CV) and derived indices for carbohydrate antigen 125 (CA-125) and human epididymis protein 4 (HE4). Parameter Group (n) Median Range CA-125 All (27) PreM (13) PostM (14) All (28) PreM (14) PostM (14) 12.3 kU/L 13.2 kU/L 10.8 kU/L 48.6 pmol/L 50.6 pmol/L 47.8 pmol/L 2.5–35.8 4.7–35.8 2.5–29.5 31.3–66.1 31.3–61.0 42.4–66.1 HE4 CVA,% CVI,% CVG,% II 0.02a 0.04a 0.01a 0.35 0.59 0.14 1.97 0.98 9.09 9.11 9.07 9.70 12.07 6.52 10.62 10.54 10.76 16.37 15.68 17.43 RCV,% n 3 6 2 25.8 33.5 18.3 CVA, CVI, CVG, II, RCV and n as explained in Table 1. PreM, pre-menopausal women; PostM, post-menopausal women. aBy the ratio SDS2/SDG2 obtained from the natural log-transformed data. Brought to you by | Università degli Studi di Milano Authenticated Download Date | 10/1/14 3:33 PM Braga et al.: Individual biology of serum biomarkers for ovarian cancer 1629 Table 3 Analytical goals for carbohydrate antigen 125 (CA-125) and human epididymis protein 4 (HE4) measurement derived from data on biological variation. Parameter O CA-125 HE4 PreM HE4 PostM ≤ 2.3 ≤ 3.0 ≤ 1.6 Imprecision (CV),% D ≤ 4.5 ≤ 6.0 ≤ 3.2 M ≤ 6.8 ≤ 9.1 ≤ 4.9 O ≤ ± 1.7 ≤ ± 2.5 ≤ ± 2.3 D ≤ ± 3.5 ≤ ± 5.0 ≤ ± 4.7 Bias,% M ≤ ± 5.2 ≤ ± 7.4 ≤ ± 7.0 Total error,% O ≤ ± 5.5 ≤ ± 7.5 ≤ ± 5.0 D ≤ ± 11.0 ≤ ± 14.9 ≤ ± 10.0 M ≤ ± 16.5 ≤ ± 22.4 ≤ ± 15.1 D, desirable quality level; M, minimum quality level; O, optimal quality level; PostM, post-menopausal women; PreM, pre-menopausal women. 19.7% for post-menopausal women, respectively. For both biomarkers RCVs obtained in this more robust way were therefore quite similar to those reported in Table 2. Finally, as RCV is generally applicable to the population only if individuals display the same within-subject variation, we evaluated the possible heterogeneity of intra-individual variation for both markers. The calculated IH (0.955 for CA-125 and 0.881 for HE4) did not fulfil the homogeneity condition (IH < 0.707) and, although RCVs documented in this study may be used as a simple figure to guide clinical decision making, they are not ubiquitously valid. According to the approach suggested by Fraser and Petersen [19], the number of blood specimens that should be collected to ensure that the mean marker result is within ± 10% of the individual’s homeostatic set point was three for CA-125, six for HE4 in pre-menopausal women and two for HE4 in post-menopausal women, respectively. Table 3 reports optimal, desirable and minimum analytical goals for imprecision, bias and total error for CA-125 and HE4 determination, derived from our BV data. Discussion Since the UK National Institute for Health and Clinical Excellence (NICE) spread its guidelines, the diagnostic algorithm recommended to improve the early recognition and initial management of OC has sparked wide debate and discussion [6, 20]. In particular, the role of CA-125 measurement within the algorithm has been criticised, in face of the relevant and well-known limitations of CA-125 diagnostic performance [21]. Preliminary results on HE4 suggested that its co-detection together with CA-125 could improve the early diagnosis of OC in women with suspected gynaecological disease [3]. More recently, a systematic review and meta-analysis has demonstrated that serum HE4 measurement is probably superior to CA-125 in terms of diagnostic performance to rule OC [5]. Accordingly, the replacement of CA-125 with HE4 has been suggested, even in view of cost effectiveness outcomes [6]. We have anticipated, however, that, to definitively introduce HE4 in the clinical setting, a comparison study between the “biological behaviour” of both CA-125 and HE4 is required [6]. By considering available data on CA-125 BV, average intra-individual (24.7% as CVI) and inter-individual variations (54.6% as CVG) are considerable [22]. There are, however, major limitations in published studies supporting the need for revaluating this information [8–10]. First, a lack of attention to pre-analytical and analytical factors may unpredictably affect the estimation of BV: the appropriate study design calls for minimising pre-analytical sources of variability by collecting serial samples at a fixed time distance in all individuals, avoiding conditions that may spuriously increase marker concentrations (e.g., incidence of menstruation); in addition, to minimise analytical variation, samples must be analysed in a single run, in duplicate, to exclude from the total variability calculation the effect of between-run analytical variation, so difficult to be correctly assessed, and directly estimate within-run variation from the results of duplicates [13, 23]. Second, the logarithmic conversion of data is mandatory in case their distribution is not gaussian to avoid obtaining spuriously elevated biological CVs [12, 13]. As Franzini already pointed out 15 years ago [24], the CV (representing a parametric statistics) in describing the distribution of a set of positive laboratory values should not exceed 33.3%. If a higher CV value results from calculation, then either the variable can assume negative values (but this is not the case for laboratory results) or the distribution is not normal: in the latter case, the SD is no longer an appropriate parameter to describe the distribution. With these premises in mind, in this study we have estimated BV for CA-125 and HE4 by adopting an accurately designed experimental protocol. By considering the design, this is the first study that assures the same conditions at baseline for all enrolled subjects and defines strict selection criteria to avoid spurious marker increases Brought to you by | Università degli Studi di Milano Authenticated Download Date | 10/1/14 3:33 PM 1630 Braga et al.: Individual biology of serum biomarkers for ovarian cancer (e.g., by pathological state, smoke, incidence of menstruation, etc.). In women in pre-menopausal status we chose to collect samples between the 12th and 14th day of menstrual cycle to homogenise the possible impact of fertility hormone levels on CA-125 concentrations. Grover et al. [25] showed that in the whole population the effect of the menstrual cycle on serum CA-125 concentrations is not clinically significant, but single-elevated values in an individual may mirror menstrual fluctuation [25]. Furthermore, as the distribution of intra-individual variances for CA-125 was not normal according to Shapiro-Wilk and Kolmogorov-Smirnov tests, a log-scale transformation was applied to the raw data to assure the normality of distribution. Before deriving biological CVs the log-transformed variances (SDI2 and SDG2) and overall mean were then converted back via inverse natural log function. Looking at the results, the first unexpected finding was the lack of difference in HE4 concentrations according to the fertility status of recruited women. For HE4 a wide range of decision thresholds has been reported in literature [5, 6]: actually, a number of these publications reported higher HE4 results in post-menopausal women [26–28]. No consensus is, however, achieved in this framework and there are still net discrepancies between reference intervals recommended by various manufacturers in their package inserts, also for those assays employing the same antibodies. Estimating reference limits for HE4 can be demanding, with many covariates and determinants to be considered [29]. In our cases neither menopausal status nor age influenced HE4 concentrations, but this could be explained by the low number (n = 2) of enrolled subjects > 60 years. According to recent results by Yang et al. [28], this should be the only age group with HE4 concentrations significantly higher. Our results were comparable to those reported in the large study by Park et al. enrolling subjects very similar to ours (female employees of a hospital aged 20–65) [30]. As menopausal status is closely related to the ovarian function, it would be reasonable to expect different biological behaviour of the biomarker in pre- and post-menopausal status. For sure, intra-individual variability of HE4 was different according to menopausal status, the average CVI of pre-menopausal group being approximately double. CA-125 here behaved differently from HE4. The ratio between BV components (SDS2/SDG2) is essential to assess the utility of conventional populationbased reference intervals for biomarker interpretation [16]. Assessing the utility of reference interval is very important, especially in face of the clinical evidence of poor effectiveness for use of a single diagnostic threshold for clinical decision making [6]. On the basis of the results obtained in this study, both biomarkers show high individuality with II < 0.6 in pre- and post-menopausal groups. This means that the population-based reference limits are of very limited value in the detection of unusual results for a particular individual. Monitoring longitudinal changes in individual serum concentrations of OC biomarkers over time is probably better than using single-threshold rules. The clinical use of these biomarkers should, therefore, be based on the RCV evaluation. Importantly, pre- and postmenopausal women who have undergone HE4 detection have to be managed differently by resorting to an appropriate RCV value, according to differences in BV due to the hormonal status. Conversely, the interpretation of CA-125 concentrations should be managed similarly in pre- and post-menopausal status. Although RCVs displayed in Table 2 can be used as a figure to guide clinical decision making, laboratories working with different analytical imprecision should be aware of the need to derive their own RCV values by using CVA information derived from the internal quality control program. In agreement with the utility of longitudinal interpretation of the biomarker course using the RCV approach, Drescher et al. [31] have recently demonstrated that in using CA-125 for OC screening a longitudinal algorithm that incorporates change over time in individual CA-125 concentrations identifies OC earlier than a single-threshold rule in a statistically significant and meaningful proportion of cases. Acknowledgments: We thank Doriana Basco for skilful technical assistance and all women who provided blood specimens for their willing and enthusiastic participation. We also thank Roche Diagnostics for the generous loan of CA125 and HE4 reagents to carry out the study. Conflict of interest statement Authors’ conflict of interest disclosure: The authors stated that there are no conflicts of interest regarding the publication of this article. Research funding: None declared. Employment or leadership: None declared. Honorarium: None declared. References 1. Sokoll LJ, Rai AJ, Chan DW. Tumor markers. In: Burtis CA, Ashwood E, Bruns DE, editors. Tietz textbook of clinical chemistry and molecular diagnostics, 5th ed. Philadelphia, PA: Elsevier Saunders, 2012:617–67. 2. Sturgeon CM, Duffy MJ, Stenman UH, Lilja H, Brünner N, Chan DW, et al. National Academy of Clinical Biochemistry laboratory Brought to you by | Università degli Studi di Milano Authenticated Download Date | 10/1/14 3:33 PM Braga et al.: Individual biology of serum biomarkers for ovarian cancer 1631 medicine practice guidelines for use of tumor markers in testicular, prostate, colorectal, breast, and ovarian cancers. Clin Chem 2008;54:e11–79. 3. National Institute for Health and Clinical Excellence (NICE): Guidance. Ovarian cancer: the recognition and initial management of ovarian cancer. National Collaborating Centre for Cancer (UK). Cardiff, UK: National Collaborating Centre for Cancer, 2011. 4. Rosen DG, Wang L, Atkinson JN, Yu Y, Lu KH, Diamandis EP, et al. Potential markers that complement expression of CA-125 in epithelial ovarian cancer. Gynecol Oncol 2005;99:267–77. 5. Ferraro S, Braga F, Lanzoni M, Boracchi P, Biganzoli EM, Panteghini M. Serum human epididymis protein 4 vs carbohydrate antigen 125 for ovarian cancer diagnosis: a systematic review. J Clin Pathol 2013;66:273–81. 6.Ferraro S, Panteghini M. Is serum human epididymis protein 4 ready for prime time? Ann Clin Biochem 2014;51:128–36. 7. Fraser CG, Harris EK. Generation and application of data on biological variation in clinical chemistry. Crit Rev Clin Lab Sci 1989;27:409–37. 8.Browning MC, McFarlane NP. Objective interpretation of results for tumour marker. J Nucl Med Allied Sci 1990;34(Suppl):89s–91s. 9. Tuxen MK, Sölétormos G, Petersen PH, Schiǿler V, Dombernowsky P. Assessment of biological variation and analytical imprecision of CA 125, CEA, and TPA in relation to monitoring of ovarian cancer. Gynecol Oncol 1999;74:12–22. 10. Trapé J, Pérez de Olaguer J, Buxó J, López L. Biological variation of tumor markers and its application in the detection of disease progression in patients with non-small cell lung cancer. Clin Chem 2005;51:219–22. 11. Braga F, Ferraro S, Lanzoni M, Szoke D, Panteghini M. Estimate of intraindividual variability of C-reactive protein: a challenging issue. Clin Chim Acta 2013;419:85–6. 12. Franzini C. Need for a more correct estimate of biological variation values. Biochim Clin 2011;35:382–5. 13. Braga F, Panteghini M. Biologic variability of C-reactive protein: is the available information reliable? Clin Chim Acta 2012;413:1179–83. 14. Tamimi RM, Hankinson SE, Chen WY, Rosner B, Colditz GA. Combined estrogen and testosterone use and risk of breast cancer in postmenopausal women. Arch Intern Med 2006;166:1483–9. 15. Fraser CG, Hyltoft Peterson P, Libeer JC, Ricos C. Proposal for setting generally applicable quality goals solely based on biology. Ann Clin Biochem 1997;34:8–12. 16. Harris EK. Effects of intra- and inter-individual variation on the appropriate use of normal range. Clin Chem 1974;20:1535–42. 17. Dolci A, Scapellato L, Mozzi R, Panteghini M. Imprecision of tumour biomarker measurements on Roche Modular E170 latform fulfills desirable goals derived from biological variap tion. Ann Clin Biochem 2010;47:171–3. 18. Roche Diagnostics GmbH. HE4 reagent, V6. 2013-03 (Ref. 05950929°190). 19. Fraser CG, Petersen PH. The importance of imprecision. Ann Clin Biochem 1991;28:207–11. 20.Sturgeon CM, Duffy MJ, Walker G. The National Institute for Health and Clinical Excellence (NICE) guidelines for early detection of ovarian cancer: the pivotal role of the clinical laboratory. Ann Clin Biochem 2011;48:295–9. 21. Markowska J, Manys G, Kubaszewska M. Value of CA 125 as a marker of ovarian cancer. Eur J Gynaecol Oncol 1992;13:360–5. 22.Desirable specifications for total error, imprecision, and bias, derived from intra- and inter-individual biologic variation. Available from: http://www.westgard.com/biodatabase1. htm?format = phocapdf. Accessed January 2014. 23.Braga F, Dolci A, Mosca A, Panteghini M. Biological variability of glycated hemoglobin. Clin Chim Acta 2010;411:1606–10. 24.Franzini C. Need for correct estimates of biological variation: the example of C-reactive protein. Clin Chem Lab Med 1998;36: 131–2. 25. Grover S, Koh H, Weideman P, Quinn MA. The effect of the menstrual cycle on serum CA 125 levels: a population study. Am J Obstet Gynecol 1992;167:1379–81. 26.Mokhtar N, Thevarajah M, Ma N, M I. Human epididymis protein 4 reference intervals in a multiethnic Asian women population. Asian Pac J Cancer Prev 2012;13:6391–5. 27. Moore RG, Miller MC, Eklund EE, Lu KH, Bast Jr RC, LambertMesserlian G. Serum levels of the ovarian cancer biomarker HE4 are decreased in pregnancy and increase with age. Am J Obstet Gynecol 2012;206:349.e1–7. 28.Yang J, Sa M, Huang M, Yang J, Xiang Z, Liu B, et al. The reference intervals for HE4, CA125 and ROMA in healthy female with electrochemiluminescence immunoassay. Clin Biochem 2013;46:1705–8. 29. Bolstad N, Øijordsbakken M, Nustad K, Bjerner J. Human epididymis protein 4 reference limits and natural variation in a Nordic reference population. Tumour Biol 2012;33:141–8. 30.Park Y, Kim Y, Lee EY, Lee JH, Kim HS. Reference ranges for HE4 and CA125 in a large Asian population by automated assays and diagnostic performances for ovarian cancer. Int J Cancer 2012;130:1136–44. 31. Drescher CW, Shah C, Thorpe J, O’Briant K, Anderson GL, Berg CD, et al. Longitudinal screening algorithm that incorporates change over time in CA125 levels identifies ovarian cancer earlier than a single-threshold rule. J Clin Oncol 2013;31: 387–92. Brought to you by | Università degli Studi di Milano Authenticated Download Date | 10/1/14 3:33 PM
Scarica