Ministry for
Agricultural and
Forestry Policies
National Institute of Agricultural Economics
MEASURING
SUSTAINABILITY
Indicators for Italian Agriculture
Coordinated by
Antonella Trisorio
Ministry for Agricultural and Forestry Policies
MEASURING
SUSTAINABILITY
Indicators for Italian Agriculture
Coordinated by
Antonella Trisorio
National Institute of Agricultural Economics
This project was funded by the Ministry for Agricultural and Forestry Policies, within the precincts
of Law 449 of 23 December 1999 containing “Rationalisation of Operations in the Agriculture,
Agri-food and Forestry Sectors” - Ministerial Decree 52454 of 29 December 2000.
Research coordination and text supervision by Antonella Trisorio.
The following authors contributed:
Introduction: objectives and methods of study: Antonella Trisorio
Indicator charts:
Indicator charts:
Indicators were elaborated by the following authors:
Social dimension
Indicators 1-5: Nadia Gargano, Antonella Trisorio
Economic dimension
Indicators 6-11: Nadia Gargano, Antonella Trisorio
Environmental dimension
Indicators 12-15, 22-27, 29-34, 36-38: Nadia Gargano, Antonella Trisorio
Indicators 16-18, 20, 21: Giuseppe Palladino
Indicator 19: Mauro Santangelo
Indicator 28: Antonella Pontrandolfi, Raffaella Zucaro
Indicator 35: Raoul Romano
Appendix 1 - Tables: Antonella Trisorio, Nadia Gargano, Raoul Romano
Appendix 2 - Methodology: ind. 1-15, 22-27, 29-34, 36-38: Nadia Gargano, Antonella Trisorio;
ind. 19: Mauro Santangelo; ind. 16-18, 20, 21: Giuseppe Palladino; ind. 28:
Antonella Pontrandolfi, Raffaella Zucaro; ind. 35: Raoul Romano
Appendix 3 - European Union documents: Antonella Trisorio
Appendix 4 - Useful websites: Nadia Gargano, Antonella Trisorio
Computing: Stefano Tomassini
Photocomposition: Sofia Mannozzi
Work group secretaries: Elisabetta Alteri, Claudia Pasiani
Thanks:
Beneficial comments were received from participants of the 8th IWG.AGRI Seminar
“Perspectives for Agriculture and Rural Indicators and Sustainability” organised jointly by OECD
and EUROSTAT, Paris, 21-22 November 2002; and from participants of the “ECE/EUROSTAT/FAO/OECD Meeting on Food and Agricultural Statistics in Europe”, organised at the United
Nations, Geneva, 2-3 July 2003.
II
Presentation
Sustainable development is the world wide priority objective as defined in the “Declaration of Rio”
at the conclusion of the 1992 United Nations Conference on the Environment and Development.
Pursuing this objective implies preserving the productive potential of the economy and thus
seeing to it that capital stock (natural, human and man-made) does not decrease over time. Only
under these conditions will it be possible to “meet the needs of the present without compromising
the ability of future generations to meet their own needs”.
Integrating the principles of sustainable development within sector policies is one of the main
strategic objectives of the European Union. In this framework, establishing sustainable agriculture takes on central importance, given the close interdependence between agricultural activity and
natural capital.
Monitoring and assessing agriculture’s impact on the economic, social and environmental system
makes it possible to verify progress towards the objective of sustainability. Among the tools at
hand, indicators are some of the most appropriate to the task. As confirmed by the European
Commission, ”indicators provide the basis for assessing progress towards the long-term objective
of sustainable development”. Indicators as support tools in decision-making are being used more
and more by public administrations, because of their efficacy and flexibility, and the possibilities
they offer for making the space-and-time comparisons necessary for designing and correcting
policy measures in a timely manner. Good examples are the complex system of indicators developed by the European Commission for monitoring and assessing Rural Development Programmes, and the widespread use internationally of periodic reports on agricultural sustainability
based on analysis of indicators.
Specifically, the indicators of agri-sustainability offered here, by making reference to social, economic and environmental aspects and their interactions, make possible a wide-spectrum analysis
and an overall view of Italian agriculture’s contribution to sustainable development. Indeed, integrated analysis of the three dimensions helps overcome problems arising from a partial approach
by individual dimension, which is not consistent with the principles of sustainable development.
The proposed indicators can be used as support by regional administrative bodies: a) in identifying potential weak points of an economic, social and/or environmental nature that distract regional agriculture from the objectives of sustainability; b) in suggesting possible actions to improve
the efficacy of regional policies, and their implementation, with regard to the objectives of sustainability; c) in verifying progress achieved over time in various dimensions (social, economic and
environmental); d) in increasing awareness about sustainability among economic, institutional
and social stakeholders.
This project is intended to provide regional administrative bodies with a tool that will help reduce
the gap between objectives of agricultural sustainability and their enactment.
To verify the sustainability of Italian agriculture over time, this report will be updated periodically.
Prof. Simone Vieri
(INEA President)
Rome, July 2004
III
INDEX
Introduction: objectives and methods of study
1. Measuring sustainability
2. How indicators were chosen
3. The three dimensions: economic, social, environmental
4. How indicators were classified
5. How indicators are implemented and represented
6. Final considerations and future developments
References
Sustainability indicators
SOCIAL DIMENSION
1
2
3
4
5
Agricultural employment
Ageing index for farmers
Educational level of farmers
Breakdown of workers in agriculture
Resident population in rural municipalities
6
7
8
9
10
11
12
13
Profitability of labour
Profitability of land
Productivity of labour
Productivity of land
Marginalisation
Diversification in farm holders’ activities
Share of agricultural value added in total value added
Fixed investments in agriculture
14
15
16
17
18
19
20
21
22
23
24
25
26
27
28
29
30
31
32
33
Herd density
Livestock
Phosphorus balance
Use of plant protection products
Methane emissions (CH4)
Ammonia emissions (NH3)
Carbon dioxide emissions (CO2)
Direct use of energy
Nitrogen balance
Potential leaching of nitrates
Fertiliser use
Application of a fertilising plan
Irrigation systems
Irrigated land
Type of catchment
Protected areas
Condition of plant species
Wooded land affected by fire
Organic farming
Agri-environmental measures
ECONOMIC DIMENSION
ENVIRONMENTAL DIMENSION
V
34
35
36
37
38
Utilised Agricultural Area
Afforestation index
Intensification
Concentration
Man-made and natural elements
82
84
88
Appendix 1
Tables
Appendix 2
Methodology
Appendix 3
European Union Documents
Appendix 4
Useful Websites
VI
Introduction: objectives and methods of study
1. Measuring sustainability
The earliest studies on sustainability were made by the United Nations immediately following the
Conference on Environment and Development held in Rio de Janeiro, Brazil, in 1992. During the
1990s, work continued by the OECD, which adopted the Pressure-State-Response (PSR) analytical framework to show the relationships between agriculture and the environment. Together with
the work of EUROSTAT’s Joint Research Centre, the European Commission later developed a
series of indicators to assess the progress of the Fifth Framework Programme. This activity received further input from major theoretical and practical contributions deriving from national, European and extra-European experience1.
From this body of studies, one thing became clear: the lack of a universally agreed-upon definition of the concept of sustainability; and, as an obvious consequence, the lack of a common
approach for measuring it, because the parameters of reference adopted (quantitative and qualitative) were not homogeneous and varied from country to country: this resulted in a lack of uniformity both generally (as regards sustainability objectives) and specifically (as regards the quality of data used for measuring them).
One crucial aspect for establishing sustainability indicators is the adoption of a specific concept of
sustainability (worked up from scratch or chosen from the many available in the literature). Of the
many, often divergent existing definitions of sustainability, we have adopted the one contained in
the Bruntland Report (Our Common Future) of the United Nations World Commission on Environment and Development, which due to its breadth is definitely the most widely used and generally accepted, especially on an international level. According to this definition, “sustainable development is development that meets the needs of the present without compromising the ability of
future generations to meet their own needs” (WCED, 1987, p. 43). This approach towards sustainability is based on the principle of preserving opportunities for “production”, or productive capacity in terms of the availability of production factors. The concept of sustainability is thus seen as
the duty of each generation of individuals towards its successors, to ensure that the availability of
capital stock2 will not decline over time (the rule of “constant capital”).
Expressed in this way, the concept of sustainability implies the possibility of substitution among
the various components of capital: thus, what we owe our successors is a generalised productive
capacity (Solow, 1992), rather than some specific component of capital stock. This interpretation,
which assumes the possibility of substitution among the components of capital, answers to a rule
of “weak” sustainability: development is sustainable even if some component of capital (such as
natural) is declining, provided the total capital stock is not falling.
Much of the ecological literature, however, rejects substitutability between natural capital and
other forms of capital: at least across some categories of natural capital. By this more restrictive
approach, a second variant on the rule of “constant capital” becomes valid: the rule of “strong”
sustainability, by which natural capital must be held constant (or increasing) within the more
general constraint that total capital stock be constant (or increasing). This position is based on the
consideration that natural capital includes some resources that are technically irreversible, and
1
2
See for example the experience of Australia (Commonwealth of Australia, 1998), Finland (Aakkula, 2000), the United
Kingdom (MAFF, 2000) and Canada (McRae T. et al, 2000).
Capital assets take three forms: 1) man-made capital (reproducible capital); 2) human capital (stock of knowledge and
skills); 3) natural capital (any natural asset yielding a flow of ecological services with economic value over time) (Pearce, Atkinson, 1995).
1
others that are effectively irreversible. Awareness of natural capital is furthermore characterised
by conditions of uncertainty. Consequently, assuming there is a widespread aversion to risk on
the public level, there are good reasons for not employing natural resources beyond levels held to
be critical for their existence or reproducibility. The irreversible nature of a significant part of natural capital, and the uncertain knowledge thereof, are determining factors in the definition of strong
sustainability.
A modified version of the rule of “strong” sustainability comes from placing special importance on
certain components of natural capital, defined as “critical”, or those providing non-substitutable
environmental services: the “life support” functions of ecosystems. According to this version of
“strong” sustainability rule, it is “critical” natural capital that must not decline over time, whereas
the use of other components of natural capital may be analysed according to the “weak” sustainability approach (Atkinson and Pearce, 1993; Pearce and Atkinson, 1995).
From the contrast between these positions, as indicated in Agenda 213, a multidimensional
sustainability concept emerges that includes environmental, economic and social objectives.
Many complex relationships exist among these components. Attempts to achieve differing objectives can lead to synergies, but may also generate conflicts. These can be solved, obviously, by
making wise policy decisions that will lead to practical and operational equilibrium.
Once a definition of sustainability has been adopted, the problem becomes how to translate it
into concrete action and practice. Major obstacles arise: a) the existing interrelationships among
different economic sectors and dimensions; b) the implicit absence of territorial borders in the
concept of sustainability. In no case, indeed, is it conceivable to limit application of the principle of
sustainability to one economic sector, or to a specific territory considered in isolation. The enactment of policies whose goal is sustainability within a single sector or territory is also destined to
produce effects on other economic sectors or territories. Analytically (in assessing activities that
will lead to sustainability) and practically (in making concrete applications of such policies), this
implies a complex activity of studying and forecasting the potential effects of actions taken in a
single sector or territory on other sectors and territories. The goal of implementing indicators for
sectors and territories is to provide a fundamental contribution to such studies and forecasts.
The object of this study is an analysis of sustainability – economic, social and environmental –
within the specific sector of Italian agriculture, considering both its relationships with the other
sectors of the economy, and the complex articulation (and differentiation) at the territorial level
with special attention to rural areas. Our aim is to provide a set of sustainability indicators that will
be a tool for making wise decisions in agricultural policy-making: in line with the need, as stated
by the European Union, to make sustainable development the core concern of all sectors and all
policies, especially in agriculture (Commission of the European Community, 2001a). In this context, the need is clear for policy makers to have cognitive, informative tools that will allow them to
adapt public policy to the objectives of sustainability, and encourage their adoption within sector
policies.
2. How indicators were chosen
On a general level, sustainability indicators are a tool for monitoring and assessing the sustainability of economic actions and policies. They are generally considered a “vehicle for summarising,
or otherwise simplifying and communicating, information about phenomena that are of importance to decision-makers” (Moxey et al, 1998). “Indicators provide the basis for assessing progress
towards the long-term objective of sustainable development. Long-term targets only have meaning as policy goals if progress towards them can be assessed objectively” (Commission of Euro3
Agenda 21 is a comprehensive plan of action to be taken globally, nationally and locally by organisations of the United
Nations System, Governments, and Major Groups in every area in which human activity impacts on the environment
(http://www.un.org/esa/sustdev/documents/agenda21/index.htm).
2
pean Communities, 2001b), by highlighting the potential trade-offs among the three dimensions
of sustainability – economic, social and environmental – and among sectors of the economy. Indicators thus provide support for policy-makers in designing and adapting policy, and also make it
possible to identify potential priorities for allocation of available resources.
In selecting indicators, we have referred mainly to documents of the European Commission; in
particular: 1) “A Framework for Indicators for the Economic and Social Dimensions of Sustainable
Agriculture and Rural Development” (European Commission, 2001) for indicators relating to the
socio-economic dimension; 2) “Indicators for the Integration of Environmental Concerns into the
Common Agricultural Policy” (Commission of European Communities, 2000) and the experience
of OECD (Organisation for Economic Co-operation and Development), EEA (European Environment Agency) and ECNC (European Centre for Nature Conservation) for indicators relative to the
environmental dimension.
The decision to use mainly those indicators proposed by the European Commission and other
international institutions and organisations was made: a) to verify the possibility of enacting proposals based on the current information system in Italy; b) to make international comparisons
(based on a set of shared indicators). This choice implies that the criteria used in selecting indicators are those adopted by the institutions referred to4, with the further restriction of availability of
data on a national/regional level. Where possible, preference has also been given to simpler indicators (from the point of view of processing and the number of parameters they consist of), generally ensuring greater transparency and immediacy of information.
3. The three dimensions: economic, social and environmental
In this report, as stated above, sustainability in agriculture is presented by distinguishing between
economic, social and environmental dimensions.
The economic dimension mainly refers to: a) efficient use of resources; b) competitiveness and
viability in the agriculture sector; c) profitability of the agriculture sector; d) agriculture’s contribution to the development and/or conservation of rural areas; e) the diversification of sources of
income within farming families.
The social dimension refers to equity meant as “equal opportunity”, both territorially (between
rural and non-rural areas) and sector-wise (between agriculture and other economic sectors), between social groups and between men and women in the sector. The issues considered under
this heading are opportunities for use and farmers’ access to resources and social services. Most
importantly, the indicators refer to human capital and its characteristics.
The environmental dimension concerns management and conservation of natural resources. The
environmental system is analysed on the basis of a list of environmental objectives of political
relevance5: protection of the landscape and biodiversity; and protection of water resources, soil
and air. The indicators are based on the DPSIR framework (Driving force, Pressure, State,
Impact, Response), which makes it possible to structure and organise environmental information
in an appropriate manner.
4
5
For example, the criteria adopted by the European Commission for choosing agri-environmental indicators are as follows: 1) policy relevance: they must be pivotal to key issues; 2) reactivity: their value must change sufficiently quickly
in response to action; 3) analytical soundness: they must be based on sound science; 4) measurability: they must be
feasible in terms of current or future availability of data; 5) ease of interpretation: they must communicate essential
information in a way that is unambiguous and easy-to-understand; 6) cost-effectiveness: their cost must be proportionate to the value of the information they provide (Commission of European Communities, 2001c).
For example, in the Sixth Environmental Action Programme, soil protection, air quality and the sustainable use and
management of natural resources were considered by the European Union to be matters of central importance.
3
For each of the three dimensions, a set of priority objectives has been established from the outset. Using these as a reference, indicators were then selected based on currently available data.
The constraints of data availability make it possible to verify the present possibilities for “sustainability analysis”.
With regard to the time element, the indicators are derived from the longest time series possible –
in most cases at least five years. The most opportune length for time series depends on the type
of indicator.
In some cases the available time series were shorter than ideal. This was especially true for environmental indicators involving matters only recently deemed of importance to the public. In such
cases we have included these indicators on the list, to establish an initial reference level that will
allow future assessment of progress.
The geographical unit we adopted is the smallest administrative level possible (administrative
region, municipality). By imposing territorial limits, though this creates a distortion in assessing
sustainability nationally, we have made this project a tool that will be more easily usable for regional administrative bodies.
Each indicator is shown in two graphic layouts that show trends by area (North-East, North-West,
Centre, South and Islands) and by region. There is also a simplified representation (Chernoff
icon) of the indicator’s performance in terms of sustainability, by area and against the national
average. This summary assessment refers to each indicator, considered independently of the
others. Thus, interactions between different indicators are not considered, so as not to introduce
elements of subjectivity into the analysis.
There are 38 indicators overall, 13 of which deal with the socio-economic dimension, and 25 of
which deal with the environment.
The former are geared toward analysing the efficiency of production in the agriculture sector, its
capacity to create employment and its contribution to conservation of rural areas.
Specifically, the social dimension is analysed in two aspects: 1) human capital, with reference to
farmers and the number of people employed in agriculture within the economy; 2) equal opportunity, with special emphasis on gender among farm workers and on rural populations.
The economic dimension is developed around three points: 1) efficiency, associated mainly with
the use of inputs; 2) viability, related to the potential for farms to survive in the market; 3) competitiveness, especially as regards the sector’s contribution to the nation’s wealth, and the process
of capital accumulation within it.
Many of the indicators included in the social and economic dimensions are imported from other
disciplines, and are used for assessing sustainability by assigning them different valences. This
does not exclude the need to delve further into these areas, so as to arrive at indicators specifically designed for the analysis of agricultural sustainability.
The 25 indicators dealing with the environment provide information about the impact of agriculture on the five components6 on which analysis of the environment is structured, based on politically relevant environmental objectives defined in the preliminary phase.
Soil is considered a dynamic element and a non-renewable natural resource. Agricultural development has contributed to the degradation of the soil’s chemical, physical and biological characteristics. The selected indicators are intended to assess the relationships between agriculture and soil,
using measurements that show the pressure brought to bear by the agricultural activities of livestock raising, the use of fertilisers and plant protection products, and other polluting substances.
Assessing the impact of farming on air quality is quite complex. Though agriculture is not the
main source of atmospheric emissions, it nonetheless has an effect in reducing the ozone layer
6
Environmental components considered are: 1. soil; 2. atmosphere; 3. water resources; 4. biodiversity; 5. landscape.
4
through gaseous emissions (methane, carbon dioxide and ammonia). The indicators for this environmental component therefore are geared toward assessing the quantity of these emissions and
energy consumption (which is responsible for part of emissions).
The relationships between agriculture and water resources are also rather complex, owing to the
difficulties of isolating the impact of farming from that of other activities. Assessing sustainability in
the use of water in agriculture takes into consideration: 1) the quantitative aspect, with special
emphasis on the use of water resources and management (the type of technology used for irrigation, types of supply sources, etc.); 2) the qualitative aspect, relating to possible pollution of
water resources (balance of nutrients, leaching, etc.).
According to the definition stated by the Convention on Biological Diversity7, “biological diversity
means the variability among living organisms from all sources, including inter alia, terrestrial,
marine and other aquatic ecosystems and the ecological complexes of which they are part: this
includes diversity within species, between species and of ecosystems”. Biodiversity may be
analysed in terms of: a) genetic diversity (within species), which has to do with diversity of genes
within “domestic” species (vegetable or animal); b) diversity of species (among species), that is,
the number of species and population of wild species (flora and fauna) affected by agriculture,
including soil biota, and the effects of non-native species on agriculture; c) diversity of ecosystems related to diversity of species, ecological processes and functions that can be observed in
various ecosystems “formed by populations of species relevant to agriculture or species communities dependent on agricultural habitats” (OECD, 2001). The selected indicators mainly address
the last two points; the first has not been considered for the moment, partly because of insufficient available data, and also because of its excessive depth with regard to the objectives of our
analysis.
Landscape is an issue similar to biodiversity in the complexity of articulating the elements that
make it up, and is linked to biodiversity in the similar nature of its relationships to agriculture. In
this study, landscape is assessed mainly by using “indirect” or proxy indicators that show agriculture’s impact through changes in form and structure of the landscape (concentration and intensification of farming, for example).
For an analysis of the issues of biodiversity and landscape, some indicators of forested land were
also considered, as a basic component for assessing the degree of naturalness of the agriecosystem.
4. How indicators were classified
As stated above, for each dimension (economic, social and environmental) a group of priority
objectives was established, with indicators selected accordingly. The whole process of selecting
and classifying indicators was done in full awareness that only by simultaneously pursuing all
objectives (wholly or in part) can the more general objective of sustainability be achieved.
In order to facilitate international comparisons of results, indicators have been classified using
the DPSIR framework (Driving force, Pressure, State, Impact, Response)8 that make up the causal chain in the relationships between agriculture and the three dimensions of sustainability under
7
8
The Convention was ratified at the United Nations Conference on Environment and Development held in Rio de
Janeiro, Brazil, in 1992.
According to the AEA definition, driving forces (D) are the underlying causes of environmental impact. Pressures (P)
relate directly to the causes of problems, and refer to actions that produce environmental impact. State (S) describes
environmental conditions by referring to quantity and quality of environmental resources. Impact (I) refers to variations
in the state and the effects of driving forces. Response (R) concerns measures adopted to solve various problems
that have been identified (agri-environmental measures or more restrictive environmental regulations, for example), or
rather actions adopted by society in response to environmental changes. These actions can be for: a) preventing
and/or reducing negative impact; b) repairing environmental damage; c) preserving or restoring conditions of environmental resources.
5
consideration. This model has been extended from the environmental to the social and economic
dimensions. The indicators classified according to the scheme described are listed in Table 1.
Table 1 - List of indicators of sustainability
DIMENSIONE SOCIALE
1
2
3
4
5
6
7
Human Capital
Equal opportunity
Efficiency
8
9
DPSIR
SOCIAL DIMENSION
DPSIR
Ageing index for farmers
D
Agricultural employment
Educational level of farmers
Breakdown of workers in agriculture
Resident population in rural municipalities
DIMENSIONE ECONOMICA
D
D
D
D
Profitability of labour
D
Productivity of labour
D
Profitability of land
Productivity of land
D
D
10 Viability
Marginalisation
D
12 Competitiveness
Share of agricultural value added
in total value added
D
11
13
14 Soil
Diversification in farm holders’ activities
Fixed investments in agriculture
ENVIRONMENTAL DIMENSION
P
Phosphorus balance
P
Methane emissions (CH4)
P
Livestock
17
Use of plant protection products
18 Atmosphere
19
D
Herd density
15
16
D
S
P
Ammonia emissions (NH3)
P
21
Direct use of energy
P
23
Potential leaching of nitrates
P
25
Application of a fertilising plan
R
Irrigated land
D
Protected areas
R
Woodded land affected by fire
P
20
Carbon dioxide emissions (CO2)
22 Water resources (quality) Nitrogen balance
Fertiliser use
24
26 Water resources
27
28
29
30
(quantity)
Biodiversity
31
32
33
34 Landscape
Irrigation systems
Type of catchment
Condition of plant species
Organic farming
Agri-environmental measures
Utilised Agricultural Area
6
P
P
P
P
S
S
P
R
R
35
36
37
38
Afforestation index
Intensification
Concentration
Man-made and natural elements
S
P
P
P
The inclusion of indicators within the context of a specific issue and/or dimension is a matter of
interpretation and perspective. The classification adopted here therefore is not rigid, and some
indicators may fit into other categories based on the questions they are called upon to address.
The balance among the number of economic, social and environmental indicators is in fact not
necessarily required, given: a) the different level of aggregation of parameters (and therefore of
information) of each indicator; b) the possibly incorrect categorisation of the indicators; c) uncertainty about the most appropriate measures to be used (U.S. Interagency Working Group on
Sustainable Development Indicators, 1998). Furthermore, since the validity of a set of indicators is
generally limited time-wise because of their marked dependence on policy priorities and level of
knowledge, there should be enough margin of flexibility in the analysis scheme to allow for opportune variations, if policy priorities shift or our base of knowledge expands.
5. Implementazione e rappresentazione degli indicatori
Analysis of the indicators was made both by geographical area and by administrative region9.
The length of the time series is not uniform for all indicators, but varies according to availability of
data and type of indicator.
The data used come exclusively from official sources10. Though this poses a limit to the analysis
on one hand, on the other it provides a realistic picture of the current possibilities for implementing internationally proposed indicators. Some of the indicators chosen are in fact subject to limitations owing to lack of available data, which in some cases means insufficient geographical
coverage and in others incomplete time series.
The indicators are mainly the result of simple mathematical calculations between parameters.
Some indicators included in the environmental dimension, especially “nitrogen balance”, “phosphorus balance”, “methane emissions” and “ammonia emissions”, use the ELBA economic-ecological model designed by the University of Bologna and taken from the European CAPRI model.
The indicators are organised in a two-part format. The first part contains general information
about the issue under examination; the second describes the trend of the time series in various
areas and regions. The aim of this study is to provide a key for reading and a tool for interpreting
the progress of Italian agriculture towards sustainability, not to “read” the data. Therefore, a basic
comment is made about the trend of each indicator, in order to allow the data to speak for themselves, and leaving interpretation to sector experts and policy decision makers.
Comparisons among the regions are shown using graphics, to provide an immediate view of progress. Finally, a summary assessment is made of the progress towards sustainability of the indicators in question, generally based on the path of the time series and using a schematic representation (Chernoff icon).
9
10
Areas and the regions they include are: North-West (Piemonte, Valle d’Aosta, Lombardy, Liguria); North-East (Trentino Alto Adige, Veneto, Friuli Venezia Giulia, Emilia Romagna); Centre (Tuscany, Umbria, Marche, Lazio); and South
and Islands (Abruzzo, Molise, Campania, Basilicata, Puglia, Calabria, Sicily and Sardinia).
Most of the indicators were obtained with data from ISTAT, with the exception of the indicators of “direct use of
energy”, which come from the FADN database; “type of catchment”, taken from INEA data; “areas used for organic
farming”, with data from the Biobank database; and “conditions of species”, which use WWF data (Italian Botanical
Society).
7
Figure 1 - Schematic representation of the progress of agriculture towards sustainbility
☺
K
L
= positive
= costant
= negative
Four appendices close the report. The first provides tables for each indicator, with the time series
of data shown by area and region. In some cases, in addition to the time series of the indicator
shown in the format, data will be shown relative to alternative indicators of the issue under analysis. In the second, illustration is made of the method of calculation used for elaborating each indicator, with information about data (source, length of time series). The third presents a survey of
political documents of the European Union having to do with sustainable agriculture and rural
development. Also highlighted are references to the ecological, economic and social dimensions
of sustainable agriculture and rural development. The fourth offers a list of websites that deal with
sustainable development, with emphasis on agriculture and rural development. The sites are divided into three categories. 1) international institutions and organisations; 2) national agencies and
ministries; 3) non-governmental organisations.
6. Final remarks and future developments
This study report offers a first attempt at assessing the sustainability of Italian agriculture, using a
set of indicators that allow for simultaneous assessment of social, economic and environmental
aspects. This set of indicators is put together in such a way as to be flexible and modifiable as
changes occur in society’s values and policy priorities, and as knowledge expands.
The indicators are a tool for monitoring and assessing sustainable development, making it possible to: a) verify whether patterns of economic activity are likely to satisfy sustainability objectives;
b) point out trade-offs among economic, social and environmental dimensions, and among sectors of the economy.
Efficient use of this tool in the decision-making process requires however that the value of each
indicator be compared with predefined values, like thresholds, standards and targets. Such comparison, indeed, allows interpretation in the light of predefined objectives. As regards the problem
of interpretation and adoption of the indicators in specific cases, it is crucial to identify the conditions necessary and sufficient for sustainability, beginning with a definition of sustainability criteria
for each of the three dimensions, economic, social and environmental. Simultaneous assessment
of progress in all three dimensions provides a view of the full picture.
Table 2 shows an initial schematic assessment of the indicators, based primarily on their progress.
8
Table 2 - Schematic assessment of indicators by geographical area
1
2
3
4
5
6
7
8
8
9
9
10
10
11
11
12
12
13
13
14
14
15
15
16
16
17
17
18
18
19
19
20
20
21
21
22
22
23
23
24
24
25
25
26
26
27
27
28
28
29
29
30
30
31
31
32
32
33
33
34
34
35
35
36
36
37
38
SOCIAL DIMENSION
Agricultural
employment
Occupazione
agricola
Ageing
index
for farmers dei conduttori agricoli
Indice di invecchiamento
Educational
level ofdei
farmers
Livello di istruzioe
conduttori agricoli
Breakdown
of
workers
in agriculture
Composizione degli occupati
in agricoltura
Resident
population
in
ruralcomuni
municipalities
Popolazione residente nei
rurali
ECONOMIC DIMENSION
Profitability
of labour
Redditività del
lavoro
Profitability
of land
Redditività della
terra
Productivity
of labour
Produttività del
lavoro
Productivity della
of land
Produttività
terra
Marginalisation
Marginalizzazione
Diversification indell’attività
farm holders’
activities
Diversificazione
lavorativa
del conduttore
Share
of
agricultural
value
added
in total value added
Incidenza del valore aggiunto dell’agricoltura
Fixed
investments
agriculture
Investimenti
fissi ininagricoltura
ENVIRONMENTAL DIMENSION
Herd density
Carico di bestiame
Livestock
Patrimonio zootecnico
Phosphorus balance
Bilancio di fosforo
Use of plant protection products
Consumo di prodotti fitosanitari
Methane emissions (CH )
Emissioni di metano (CH44)
Ammonia emissions (NH3)
Emissioni di ammoniaca (NH3)
Carbon dioxide emissions (CO2)
Emissioni di anidride carbonica (CO2)
Direct use of energy
Uso diretto di energia
Nitrogendibalance
Bilancio
azoto
Potential leaching
of nitrates
Lisciviazione
potenziale
dei nitrati
Fertiliser
use
Consumo di fertilizzanti
Application ofdia un
fertilising
plan
Applicazione
piano di
concimazione
Irrigation
systems
Sistemi di irrigazione
Irrigated land
Superficie
irrigata
catchment
Type
Fonti of
di approvvigionamento
idrico
Protected
areas
Aree
protette
Condition
plantspecie
species
Condizioneofdelle
Wooded
land
affected
by fire dal fuoco
Superficie forestale percorsa
Organic
farming
Agricoltura biologica
Agri-environmental
measures
Misure
agroambientali
Area
Agricultural
Utilised
Superficie agricola utilizzata
Afforestation
index
Indice di boscosità
Intensification
Intensificazione
Concentration
Concentrazione
Man-madeedand
naturaldielements
Manufatti
elementi
naturalità
North-West
North-East
Centre
South & Islands
Italy
L
☺
L
☺
K
L
L
☺
☺
K
L
L
☺
K
K
L
L
L
K
K
L
L
☺
☺
K
North-West
North-East
Centre
South & Islands
Italy
☺
☺
☺
☺
L
☺
L
☺
☺
☺
☺
☺
L
☺
L
☺
☺
☺
☺
☺
L
☺
L
K
☺
☺
☺
☺
L
☺
L
K
☺
☺
☺
☺
L
☺
L
☺
North-West
North-East
Centre
South & Islands
Italy
L
L
L
L
L
☺
L
☺
L
L
☺
☺
☺
L
n.d.
☺
–
L
☺
☺
L
☺
☺
L
☺
L
L
L
L
☺
☺
L
n.d.
L
L
☺
☺
☺
L
n.d.
☺
–
K
☺
☺
L
☺
☺
L
☺
K
L
L
L
L
☺
L
L
☺
L
L
☺
☺
L
n.d.
☺
–
L
☺
☺
L
☺
☺
L
☺
L
K
L
L
L
☺
L
☺
L
L
L
☺
☺
L
L
☺
–
L
☺
☺
L
☺
☺
☺
L
L
L
L
L
L
☺
L
☺
L
L
K
☺
☺
L
n.d.
☺
–
L
☺
☺
L
☺
☺
L
☺
The selection of indicators, as is often the case, was affected by the availability of data.
Nonetheless, in our case it was possible to cover all dimensions equally, ensuring a complete
overall view. This does not exclude the advisability of making further investigation of some issues
particularly inherent to the social (equal opportunity, for example) and environmental dimensions
9
(landscape, biodiversity).
The aggregation of indicators to reach a summary representation of sustainability is a complex
task, but it is necessary for encouraging inclusion of the objective of sustainability within the
process of forming and enacting public policy. Aggregation is a way of simplifying information to
make it easy to use in policy decision-making, which normally requires support tools that are concise and easy to understand.
In this study we have pursued this purpose. Still, it should be pointed out that in the case of the
indicators we propose, the search for synthesis should be pursued with caution. Indeed, with indicators of sustainability, using compensatory methods of aggregation (e.g. weighting means) may
generate biases in information.
Therefore a possible solution could be to adopt a tool for reading and summarising indicators,
which would retain information potential intact. The “dashboard” method11, which uses the
metaphor of a vehicle’s instrument panel in terms of sustainability, seems to meet this requisite.
Indeed, it allows for managing and controlling the set of indicators, and overcomes the problem
of calculations on indicators that would introduce further subjectivity into the assessment
process. The dashboard also provides an efficient representation of the complexity of the issue
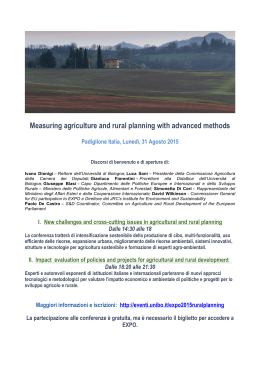
of sustainability (see Figure 2) and the impossibility of providing a univocal assessment.
The dashboard gives a simultaneous view of “degree of sustainability” for: a) all the dimensions;
b) each dimension; c) each theme within the dimensions; d) each indicator, making it possible to
analyse sustainability according to different levels of aggregation. It is also possible to develop
an analysis in different geographical categories (e.g. administrative region, municipality, etc.).
It is important to emphasise that the dashboard approach also requires identifying: 1) priority
objectives for the economy, the environment and social issues, based on values and objectives
of the public; 2) thresholds and target values for each indicator. The former, mainly associated
with policy decisions, are useful for setting the relative importance (and possibly the weight) of
the various issues of sustainability and related indicators. The latter are generally suggested by
the world of science; they are useful for interpreting the direction of certain developments and
trends, according to the distance-to-target method. This is especially true when referring to the
environment; its irreversibility, and our uncertainty and widespread ignorance of its characteristics, require precautionary behaviour in defining and interpreting indicators.
11
This approach, proposed by the IISD/Consultative Group on Sustainable Development Indicators, “using the metaphor of a vehicle’s instrument panel, (…) displays country-specific assessments of economic, environmental, social
and institutional performance toward (or away from) sustainability” (http://www.iisd.org/cgsdi/dashboard.htm). See
also U.S. Interagency Working Group on Sustainable Development Indicators, 1998.
10
n
E SS
)
2)
(CO
H3
s (N
s(
e
e
Potenti
Nitro
al leac
h
gen b
Fertiliser us
alanc
ing of n
it
f en
se o
Dire
ct u
dio
bon
Car
Application of a fertilising plan
ergy
issi
em
xide
nia
mo
Am
rates
ons
ion
em
iss
nt
ne
tha
RE
AT
MO
SP
HE
ts
uc
rod
4)
CH
np
tio
tec
ion
pro
em
iss
pla
of
Me
ers
farm
for
ex
ind
ng
v
er
rm
f fa
ers
EQUAL
OPPORTUNITY
LA
N
DS
CA
P
E
Resid
e
in rur nt populati
al mu
nicipa on
lities
Uti
lise
dA
Aff
gric
ore
ultu
sta
ral
Int
tio
Are
a
Co ensi n ind
fic
e
nc
x
ati
en
on
tra
tio
n
nts
me
ele
al
tur s
a
na
ies
nd d are
pec
ea
re
ad ecte ant s
y fi
n-m rot f pl
db
o
P
cte
Ma
tion
affe
g
n
ndi
i
as
Co st are
es
farm
asur
e
anic
l me
For
Org
enta
Note:
l le
na
o
el
work
n of re
kdow
ltu
Brea agricu
in
onm
envir
s
ITY
Agriystem
RS
tion s
VE
Irriga
DI
BIO
nd
Irrigated la
WATER
RCES
RESOU TITY)
t
Type of catchmen
(QUAN
k
e
toc
nc
es
ala
Liv
b
rus
ho
sp
o
Ph
Us
e
ENVIRONMENTAL
DIMENSION
IL
SO
ty
nsi
SOCIAL
DIMENSION
WAT
RESOU ER
R
(QUALITCES
Y)
e
e
ECONOMIC
DIMENSION
TITIVEN
COMPE
ultur
agric
rd d
CY
EN
VIA
BIL
ITY
o
ati
uc
Ed
HU
CA MAN
PIT
AL
I
FIC
EF
He
Age
i
d
ts in
tmen
r
lan
tio
Share of value added in
agriculture in total value added
inves
f land
bou
of la
of
lisa
Dive
rsific
holde ation in
far
rs’ ac
tivitie m
s
d
Fixe
bility o
ity
ctiv
ity
ina
Profitability of labour
Profita
du
Pro
ctiv
du
Pro
Ma
rg
Agricultura
l employm
ent
Figure 2 - The dashboard of sustainability
Indicators highlighted in red show a situation of “alert”. This warns of the need to make opportune verifications of sustainability within the areas indicated.
11
References
Aakkula J., (2000), Sustainable Development in Agriculture: Indicators, Agri-environmental Programmes
and Demonstrations, Final Report of the SUSAGRI-project, Agricultural Research Centre of Finland,
Helsinki, Finland.
Atkinson, G. e Pearce D.W., (1993), “Measuring sustainable development”, The Globe, No. 13, June, UK
GER Office, Swindon.
Commission of European Communities, (2000), Communication from the Commission to the Council and
the European Parliament. Indicators for the Integration of Environmental Concerns into the Common
Agricultural Policy, COM(2000)20 final, Brussels.
Commission of European Communities, (2001a), Communication from the Commission. A Sustainable
Europe for a Better World: A European Union Strategy for Sustainable Development, COM(2001) 264
final, Brussels.
Commission of European Communities, (2001b), Commission staff working paper. Consultation paper for
the preparation of a European Union strategy for Sustainable Development, SEC(2001) 517,
Brussels.
Commission of European Communities, (2001c), Communication from the Commission to the Council and
the European Parliament. Statistical Information needed for Indicators to monitor the Integration of
Environmental Concerns into the Common Agricultural Policy, COM(2001) 144 final, Brussels.
Commission of European Communities, (2003), Communication from the Commission to the Council and
the European Parliament. 2003 Environmental Policy Review. Consolidating the environmental pillar
of sustainable development, COM(2003) 745 final, Brussels.
Commonwealth of Australia, (1998), Sustainable Agriculture - Assessing Australia’s Recent Performance, A
Report to the Standing Committe on Agriculture and Resource Managment (SCARM) of the National
Collaborative Project on Indicators for Sustainable Agriculture, SCARM Technical Report No. 70,
CSIRO Publishing, Victoria, Australia.
ECNC, European Centre for Nature Conservation, (2000), Agri-Environmental Indicators for Sustainable
Agriculture in Europe, Wascher D. W. (ed.).
European Commission, (1999), Agriculture, environment, rural development. Facts and Figures. A challange for Agriculture, Luxembourg, Belgium,.
European Commission, (2001), A Framework for Indicators for the Economic and Social Dimension of
Sustainable Agriculture and Rural Development, Brussels.
European Environment Agency, (1998), EU State of the Environment Report, 1998. Guidelines for data
Collecting and Processing, Copenhagen.
Eurostat, (2001), Measuring progress towards a more sustainable Europe, Proposed indicators for sustainable development, Data 1980-99, European Communities.
MAFF, Ministry of Agriculture Fisheries and Food, (2000), Towards Sustainable Agriculture, A pilot set of
indicators, London (UK), http://www.maff.gov.uk
McRae T., Smith C.A.S., Gregorich L. J. (eds), (2000), Environmental Sustainability of Canadian Agriculture:
Report of the Agri-Environment Indicator Project. Agriculture and Agri-Food Canada, Ottawa, Ont.
Moxey, A., Whitby M. and P. Lowe, (1998), “Agri-environmental indicators: issues and choices”, Land Use
Policy, Vol.15, N0. 4.
OECD, (1999), Environmental Indicators for Agriculture. Vol. 2. Issues and Design, The York Workshop, Paris.
OECD, (2000), Frameworks to Measure Sustainable Development, Paris.
OECD, (2001), Environmental Indicators for Agriculture. Vol. 3. Methods and Results, Paris.
Pearce, D.W. and G. Atkinson, (1995), “Measuring Sustainable development” in (Bromley D.W. ed.) The
Handbook of Environmental Economics, Oxford UK and Cambridge USA.
Solow, R. (1992) An Almost Practical Step Toward Sustainibility, Resources for the Future, Washington, DC.
U.S. Interagency Working Group on Sustainable Development Indicators, (1998), Sustainable development
in the United States. An Experimental set of Indicators, Washington D.C.
WCED (World Commission on Environment and Development), (1987), Our Common Future. Oxford
University Press, Oxford, and United Nations, New York.
12
INDICATORS
OF SUSTAINABILITY
HUMAN CAPITAL
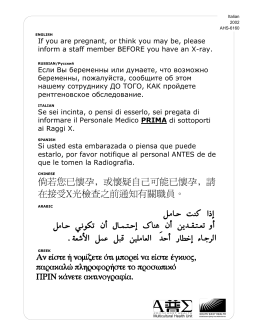
1. Agricultural employment
The number of people employed in agriculture contributes to preserving the viability of rural
areas, as well as of the sector itself. Economic interpretation of the progress of this indicator must
be made in consideration of its relationship to the indicator for work productivity. A decline in
labour may in fact be related to an increase in productivity.
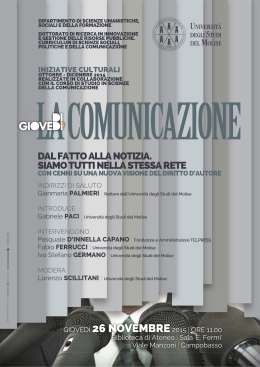
In the industrialised countries generally, a negative trend can be observed in the number of people employed in agriculture, both in totals and compared to other sectors. In Italy, the agriculture
sector occupies a total of approximately 1,120,000 persons, with 14% in the Centre, 37% in the
North and 50% in the South & Islands. Between 1991 and 2000, the number of people employed
in agriculture decreased by 4.5%, dropping on average from around 8% to 5% of total labourers.
The development in this variable is similar in all geographical areas, though in the South &
Islands farm labourers account for 9.3%, nearly twice those in the North (5.7%), and more than
three times those in the North-West (2.7%). On the regional level, the greatest decline was in
Marche (-8.2%), Abruzzo (-7.3%) and Umbria (-6.5%).
Agricultural employment (1991 = 100)
Occupazione agricola (1991 = 100)
110
100
90
80
70
60
50
1991
1992
Italy
1993
1994
North-West
1995
1996
North-East
14
1997
Centre
1998
1999
2000
South&Islands
HUMAN CAPITAL
Agricultural employment
Occupazione agricola
Piemonte
Piemonte
Valle d'Aosta
d’Aosta
Valle
Lombardia
Lombardy
Trentino
- Alto Adige
Trentino-Alto
Adige
Veneto
Veneto
Friuli
- Venezia Giulia
Friuli-Venezia
Giulia
Liguria
Liguria
Emilia
- Romagna
Emilia-Romagna
Toscana
Tuscany
Umbria
Umbria
1991
2000
Marche
Marche
Lazio
Lazio
Abruzzo
Abruzzo
Molise
Molise
Campania
Campania
Puglia
Puglia
Basilicata
Basilicata
Calabria
Calabria
Sicilia
Sicily
Sardegna
Sardinia
0%
L
North-West
5%
L
North-East
10%
L
Centre
15
15%
20%
L
South & Islands
25%
L
Italy
HUMAN CAPITAL
2. Ageing index for farmers
Young farmers are an essential element for development and viability in rural areas. Compared to
older farmers, they show a greater tendency toward introducing technological innovation, and
adapt more quickly to regulatory, economic and environmental changes. Young people also contribute to the viability of rural areas and consequently to the protection and stewardship of land
and natural space. This contributes to a better balance within the economy-environment-society
system. On a regulatory level, a legislative frame of reference exists which is geared toward providing incentives for young farmers to take the place of their older counterparts (EC Reg.
1783/2003; EC Reg. 1257/99).
Between 1993 and 2000, the ageing index increased on average nationwide from 34 to 38%. The
greatest increase occurred in the central regions (from 34% to 40%) and those of the North-East
(from 35% to 38%). Liguria, Sicily and Valle d’Aosta showed the greatest rates of increase, whereas the percentage of older farmers declined in Sardinia and Lombardy. Regions in the Centre
averaged a relatively higher number of farms run by older farmers.
Ageing index (1993 = 100)
Indice di invecchiamento (1993 = 100)
130
120
110
100
90
1993
1995
Italy
1996
North-West
1997
North-East
16
1998
Centre
1999
2000
South&Islands
HUMAN CAPITAL
Ageing index
Indice di invecchiamento
Piemonte
Piemonte
d’Aosta
Valle d'Aosta
Valle
Lombardia
Lombardy
Trentino-Alto Adige
Trentino-Alto
Adige
Veneto
Veneto
Friuli-Venezia
Giulia
Friuli-Venezia Giulia
Liguria
Liguria
Emilia-Romagna
Emilia-Romagna
Tuscany
Toscana
Umbria
Umbria
Marche
Marche
1993
2000
Lazio
Lazio
Abruzzo
Abruzzo
Molise
Molise
Campania
Campania
Puglia
Puglia
Basilicata
Basilicata
Calabria
Calabria
Sicily
Sicilia
Sardinia
Sardegna
0%
North-West
☺
10%
North-East
L
20%
Centre
L
17
30%
40%
South & Islands
L
50%
Italy
L
HUMAN CAPITAL
3. Educational level of farmers
A higher level of education can generally be associated with a greater tendency among farmers
to adopt technological innovations that may contribute to improving farms’ environmental performance, improve working conditions and product quality, and increase productivity.
As far as the trend in educational level is concerned, between 1995 and 1999 this indicator showed a slight improvement: in fact, there was an increase in farm holders with high school diplomas and those with middle school certificates; there was a decline, however, among farmers with
no formal education certificate and those with an elementary school education. The number of
university graduates remained practically the same (3% in 1999). There was also an improvement in educational level among farm holders by individual geographical area and region. In
general, more farmers in the South and Islands had elementary school certificates, while more in
the North held secondary school certification.
Educational level of farmers in Italy
100%
90%
80%
70%
60%
50%
40%
30%
20%
10%
0%
1990
university
high school
1995
middle school
18
elementary school
1999
no certificate
HUMAN CAPITAL
Livello
di istruzione
deifarmers
conduttori
agricoli (1999)
Educational
level of
(1999)
Piemonte
Piemonte
Valle d'Aosta
Valle d’Aosta
Lombardia
Lombardy
Trentino-Alto Adige
Trentino-Alto Adige
Veneto
Veneto
Friuli-Venezia Giulia
Friuli-Venezia Giulia
Liguria
Liguria
Emilia-Romagna
Emilia-Romagna
Toscana
Tuscany
Umbria
Umbria
Marche
Marche
Lazio
Lazio
Abruzzo
Abruzzo
Molise
Molise
Campania
Campania
Puglia
Puglia
Basilicata
Basilicata
Calabria
Calabria
Sicilia
Sicily
Sardinia
Sardegna
0%
North-West
L
university
20%
high school
North-East
☺
40%
middle school
Centre
☺
19
60%
80%
elementary school
South & Islands
L
100%
no certificate
Italy
☺
EQUAL OPPORTUNITY
UGUALI OPPORTUNITÀ
4. Breakdown of workers in agriculture
This indicator, together with the ageing index, provides a description of the characteristics and
potential of human resources employed in agriculture over the medium to long period. The reduced gap between the sexes in labour helps to ensure more equal opportunity within the sector.
Between 1991 and 2000, females in agriculture increased nationwide, and the difference between the number of males and females decreased. This phenomenon was more marked in the
North, especially the North-
West, where the difference dropped from 3% to 2%. But the divergence between males and
females remained stable in the Centre and South and Islands. This last area also registered a
higher percentage of male workers.
120
Difference between male and female workers in agriculture
Differenza tra tasso di occupazione maschile e femminile (1991=100)
(1991=100)
110
100
90
80
70
60
1991
1992
Italy
1993
1994
North-West
1995
1996
North-East
20
1997
Centre
1998
1999
2000
South&Islands
Differenza tra tasso di occupazione maschile e femminile
EQUAL OPPORTUNITY
Difference between male and female workers in agriculture
Piemonte
Piemonte
Valle
Valle d’Aosta
d'Aosta
Lombardia
Lombardy
Trentino
- Alto Adige
Adige
Trentino-Alto
Veneto
Friuli-Venezia
Friuli
- Venezia Giulia
Giulia
Liguria
Liguria
Emilia
- Romagna
Emilia-Romagna
Tuscany
Toscana
Umbria
Umbria
1991
2000
Marche
Marche
Lazio
Lazio
Abruzzo
Abruzzo
Molise
Molise
Campania
Campania
Puglia
Puglia
Basilicata
Basilicata
Calabria
Calabria
Sicilia
Sicily
Sardegna
Sardinia
-2%
North-West
☺
0%
North-East
☺
2%
4%
Centre
K
21
6%
8%
South & Islands
K
10%
Italy
☺
12%
EQUAL OPPORTUNITY
UGUALI OPPORTUNITÀ
5. Resident population in rural municipalities
Maintaining population in rural areas is a social objective; meeting it depends largely on living
conditions (work opportunity, availability of services). The abandonment of these areas may cause problems of degradation, both economically and environmentally.
Between 1991 and 2000, the resident population in rural areas nationwide remained substantially
the same, with a slight tendency toward growth. But rural municipalities of the South and Islands,
and to a lesser degree in the Centre, showed a tendency toward decline. Increases in population
in rural municipalities are partly attributable to recent phenomena of counter-urbanisation prevalent near large urban centres.
Resident population in rural municipalities in Italy (1991=100)
Popolazione residente nei comuni rurali in Italia (1991=100)
107
106
105
104
103
102
101
100
99
1991
1992
Italy
1993
1994
North-West
1995
1996
North-East
22
1997
1998
Centre
1999
2000
South&Islands
2001
EQUAL OPPORTUNITY
Resident population in rural municipalities
Popolazione residente nei comuni rurali
Piemonte
Piemonte
Valle
Valle d’Aosta
d'Aosta
Lombardy
Lombardia
Trentino-Alto
Trentino - Alto Adige
Adige
Veneto
Veneto
Friuli-Venezia
Friuli
- Venezia Giulia
Giulia
Liguria
Liguria
Emilia-Romagna
Emilia
- Romagna
Tuscany
Toscana
Umbria
Umbria
1991
2001
Marche
Marche
Lazio
Abruzzo
Abruzzo
Molise
Molise
Campania
Campania
Puglia
Puglia
Basilicata
Basilicata
Calabria
Calabria
Sicilia
Sicily
Sardegna
Sardinia
0%
North-West
K
10%
20%
North-East
K
30%
40%
Centre
K
23
50%
60%
South & Islands
K
70%
80%
Italy
K
EFFICIENCY
EFFICIENZA
6. Profitability of labour
This indicator, along with that for value added per hectare of UAA, measures the profitability of
the agriculture sector, or its capacity to remunerate input factors employed. Only if the sector is
competitive, and inputs used are adequately remunerated, can potential production be sustained
in the long term.
Between 1995 and 2000, value added per work unit grew annually by 4.47%. Increases above
the national average were seen in the regions of the North-West and the South and Islands,
especially Molise, Basilicata and Campania. There was a lesser increase in central regions. In
absolute terms, the highest values occurred in Liguria, Lombardy, Friuli Venezia Giulia, Emilia
Romagna and Marche.
Profitability of labour (1995 = 100)
Redditività
del lavoro
= 100)
Popolazione
residente
nei(1995
comuni
rurali in Italia (1991=100)
140
107
106
130
105
104
120
103
102
101
110
100
99
100
1991
1995 1992
Italia
Italy
1993
1996
1994
1995
1997
Nord-ovest
North-West
1996
Nord-est
North-East
24
1997
1998
1998 1999
1999
Centro
Centre
2000 2000
2001
Sud e isole
South&Islands
EFFICIENCY
Profitability of labour (‘000 eurolira 1995)
Redditività del lavoro (000 di eurolire 1995)
Piemonte
Piemonte
Valle
Valle d’Aosta
d'Aosta
Lombardy
Lombardia
Trentino
- Alto Adige
Trentino-Alto
Veneto
Veneto
Friuli-Venezia
Giulia
Friuli
- Venezia Giulia
Liguria
Liguria
Emilia-Romagna
Emilia
- Romagna
Tuscany
Toscana
Umbria
Umbria
1995
2000
Marche
Marche
Lazio
Lazio
Abruzzo
Abruzzo
Molise
Molise
Campania
Campania
Puglia
Puglia
Basilicata
Basilicata
Calabria
Calabria
Sicily
Sicilia
Sardinia
Sardegna
0
North-West
☺
5
10
North-East
☺
15
20
Centre
☺
25
25
30
South & Islands
☺
35
40
Italy
☺
EFFICIENCY
EFFICIENZA
7. Profitability of land
As with profitability of labour, here too the value added per hectare of UAA fits into the group of
indicators for measuring productive efficiency. On a par with UAA, an increase in the value of this
indicator in fact signals higher profitability of land.
Between 1998 and 2000, agricultural value added per hectare of UAA increased regularly, both in
Italy as a whole and in all individual geographical areas. The increase in 2000 is due mainly to the
reduction in UAA registered in the census. The highest growth occurred in the North-West (3%)
and the South and Islands (2.7%). On a regional level, note should be made of the good performance of Liguria (6.7%), with the highest value added per hectare (10.5%), and Valle d’Aosta
(5.4%) in the North (5.3%); and of Calabria (5.3%), Sardinia (4.7%) and Basilicata (4.5%) in the
South and Islands.
Redditività della terra (1988 = 100)
Profitability of land (1988 = 100)
150
140
130
120
110
100
90
80
1988
1989
1990
1993
1991
1995 1998
1996
1994 1992
1995 199319961994 1997
1997
1999
1998
2000 1999
2001 2000
Italy Italia North-West
Nord-ovest North-East
Nord-est CentreCentro South&Islands
Sud e isole
26
EFFICIENZA
EFFICIENCY
Profitability of land (‘000 di eurolira 1995)
Piemonte
Piemonte
Valled’Aosta
d'Aosta
Valle
Lombardia
Lombardy
Trentino
- Alto Adige
Adige
Trentino-Alto
Veneto
Veneto
Friuli
- Venezia Giulia
Giulia
Friuli-Venezia
Liguria
Liguria
Emilia
- Romagna
Emilia-Romagna
Toscana
Tuscany
Umbria
Umbria
1988
2000
Marche
Marche
Lazio
Lazio
Abruzzo
Abruzzo
Molise
Molise
Campania
Campania
Puglia
Puglia
Basilicata
Basilicata
Calabria
Calabria
Sicilia
Sicily
Sardegna
Sardinia
0
North-West
☺
2
North-East
☺
4
6
Centre
☺
27
8
10
South & Islands
☺
12
Italy
☺
EFFICIENCY
8. Productivity of labour
Productivity indicators provide a measurement of the efficiency with which agriculture converts
inputs into outputs. Increased productivity shows that greater production can be obtained with
the same quantity of inputs. Productivity of labour is one of the elements that provide information
about economic prosperity. In general, if productivity of labour increases, potential production
may be sustained over the long term, and/or future generations can produce more goods and
services with a given amount of labour.
In the last twenty years, productivity of labour has grown steadily. From 1980 to 2000, there was
an average annual growth of 3.7%. The greatest increase occurred in the regions of the Centre
(Abruzzo and Basilicata in particular) and those of the North-East (especially Piemonte and Liguria).
Productivity of labour (1980=100)
275
Produttività del lavoro (1980=100)
250
225
200
175
150
125
100
75
1999
2000
2001
1980 1981 1982 1983 1993
1984 1985 1994
1986 19871995
1988 19891996
1990 19911997
1992 19931998
1994 1995
1996 1997
1998 1999
2000 2001
Italy Italia North-West
Nord-ovest North-East
Nord-est CentreCentro
28
South&Islands
Sud e isole
EFFICIENCY
Productivity of labour (‘000 eurolira 1995)
Produttività del lavoro (000 di eurolire 1995)
Piemonte
Piemonte
Valle d’Aosta
d'Aosta
Valle
Lombardia
Lombardy
Trentino-Alto Adige
Adige
Trentino-Alto
Veneto
Veneto
Friuli-Venezia
Friuli-Venezia Giulia
Giulia
Liguria
Liguria
Emilia-Romagna
Emilia-Romagna
Tuscany
Toscana
Umbria
Umbria
1980
2001
Marche
Marche
Lazio
Lazio
Abruzzo
Abruzzo
Molise
Molise
Campania
Campania
Puglia
Puglia
Basilicata
Basilicata
Calabria
Calabria
Sicily
Sicilia
Sardinia
Sardegna
0
North-West
☺
10
North-East
☺
20
30
Centre
☺
29
40
50
South & Islands
☺
60
Italy
☺
EFFICIENCY
9. Productivity of land
Productivity indicators provide a measurement of the efficiency with which agriculture converts
inputs into outputs. Increased productivity shows that greater production can be obtained with
the same amount of inputs.
Between 1982 and 2000, productivity of land increased annually by 1.3%, attributable both to an
increase in gross saleable product and a significant decrease in utilised agricultural area registered in the last decade. The regions of the North-West, Liguria in particular, and the South and
Islands, especially Sardinia and Calabria, showed the greatest increases.
Productivity of land (1982=100)
Produttività della terra (1982=100)
130
120
110
100
90
80
1993
1982
Italia
Italy
1994
1995
Nord-ovest
North-West
1996
1990 1997
Nord-est
North-East
30
1998
Centro
Centre
1999
2000
2000
Sud e isole
South&Islands
2001
Piemonte
Piemonte
EFFICIENCY
Productivity of land (’000 eurolira 1995))
Produttività della terra (000 di eurolire 1995)
d’Aosta
Valle d'Aosta
Valle
Lombardy
Lombardia
Adige
Trentino-AltoAdige
Trentino-Alto
Veneto
Veneto
Friuli-VeneziaGiulia
Giulia
Friuli-Venezia
Liguria
Liguria
Emilia-Romagna
Emilia-Romagna
Tuscany
Toscana
Umbria
Umbria
Marche
Marche
1982
2000
Lazio
Lazio
Abruzzo
Abruzzo
Molise
Molise
Campania
Campania
Puglia
Puglia
Basilicata
Basilicata
Calabria
Calabria
Sicily
Sicilia
Sardinia
Sardegna
0
North-West
☺
2
4
North-East
☺
6
Centre
☺
31
8
10
South & Islands
☺
12
14
Italy
☺
VIABILITY
10. Marginalisation
This indicator has to do with the growing incapacity of a farm to produce an acceptable income
because of deterioration in its economic and/or physical environment. The direct consequence is
an increased risk of closing down, which in turn leads to less protection of the land, potential loss
of biodiversity and less landscape stewardship. This can produce negative effects overall, socially
and environmentally. Still, from a merely economic point of view, the disappearance of small
farms (economically and/or physically) is not a negative element in itself.
The reduction in numbers of small farms is a common phenomenon in many industrialised countries. In Italy, between 1995 and 1999, the number of small farms declined in absolute terms by
approximately 500,000 units. In percentage terms, they dropped by six points, from 65% to 59%,
with the most marked reductions in the North. The phenomenon is widespread in all regions
except Valle d’Aosta, Abruzzo, Puglia, Campania and Sicily.
Marginalisation (1995= 100)
Marginalizzazione (1995= 100)
110
100
90
80
1995
1993
Italy
Italia
1994
1995
1997
1996
1997 1998
1998
North-West
Nord-ovest North-EastNord-estCentre
32
1999
2000 1999
2001
South&Islands
Centro
Sud e isole
VIABILITY
Marginalisation
Marginalizzazione
Piemonte
Piemonte
Valle d’Aosta
d'Aosta
Valle
Lombardia
Lombardy
Trentino-Alto Adige
Adige
Trentino-Alto
Veneto
Veneto
Friuli-Venezia Giulia
Friuli-Venezia
Liguria
Emilia-Romagna
Emilia-Romagna
Tuscany
Toscana
Umbria
Umbria
Marche
Marche
1995
1999
Lazio
Abruzzo
Abruzzo
Molise
Molise
Campania
Campania
Puglia
Basilicata
Basilicata
Calabria
Calabria
Sicily
Sicilia
Sardinia
Sardegna
0%
20%
North-West
North-East
L
L
40%
Centre
L
33
60%
South & Islands
L
80%
Italy
L
VIABILITY
11. Diversification in farm holders’ activities
The percentage of farms classified by farm holders’ activities provides a measurement of a farm’s
economic diversification: the higher the percentage of farms run by farm holders who diversify
their activity, the greater the farms’ economic viability. Diversification of activity is a medium-term
strategy of risk management that may, however, reduce economic efficiency.
From 1993 to 1999, there was a general tendency among farm holders to increase the degree of
diversification in their activities by taking on other work. The percentage of farm holders who worked “exclusively on the farm” dropped from 73.6% to 71.3%, whereas those who worked “mainly
on the farm” rose from 3.6% to 5%, and those with activities “off the farm” increased from 22.8%
to 23.6%. This national trend was reflected in all geographical areas with the exception of the
North-West, where there was a particular increase in farm holders mainly employed on their
farms. In all other areas, the trend followed the national average. Among the regions, Piemonte,
Valle d’Aosta, Emilia Romagna and Tuscany showed the highest percentages of farms run by
holders in the “exclusively on-farm” category.
Diversification in farm holders’ activities in Italy
100%
Diversificazione dell'attività del conduttore agricolo in Italia
90%
80%
70%
60%
50%
40%
30%
20%
10%
0%
1993
Exclusively on the farm
1996
Mainly on the farm
34
1999
Mainly off the farm
Piemonte
Piemonte
Valle d'Aosta
d’Aosta
Valle
Lombardy
Lombardia
Trentino-Alto
Adige
Trentino-Alto Adige
Veneto
Veneto
Friuli-Venezia Giulia
Giulia
Friuli-Venezia
Liguria
Liguria
Emilia-Romagna
Emilia-Romagna
100%
90%
80%
70%
60%
Toscana
Tuscany
Umbria
Umbria
Diversificazione dell'attività del conduttore agricolo in Italia
Marche
Marche
Lazio
Lazio
Abruzzo
Abruzzo
Molise
Molise
50% Campania
Campania
40%
Puglia
Puglia
30%
Basilicata
Basilicata
10%
Sicilia
Sicily
20%
0%
Calabria
Calabria
Sardegna
Sardinia
0%
10%
1993
20%
Esclusiv.
presso
Exclusively
onl'azienda
the farm
North-West
☺
North-East
☺
30%
40%
50%
1996
60%
Preval.
presso
l'azienda
Mainly
on the
farm
Centre
☺
35
70%
80%
90%
1999
Preval.
extraziendale
Mainly
off the farm
South & Islands
☺
Italy
☺
VIABILITY
Diversificazione
dell'attività
delactivities
conduttore
agricolo (1999)
Diversification
in farm
holders’
(1999)
COMPETITIVENESS
12. Share of agricultural value added in total value added
The contribution of the agriculture sector to national wealth provides indications about the sector’s weight within the economic sector, and thus about its competitiveness with regard to other
sectors. Nevertheless, an inverse relationship exists between this indicator and the level of maturity of the economy, so that in the more advanced economies the indicator’s value is lower.
In recent years the share of value added of agriculture in total value added has continually declined, to an annual rate of 2.5%, reaching values comparable to those for central and southern
Europe. The lowest impact is in regions of the North-West and the Centre, whereas especially in
the South and Islands agriculture’s contribution to total value added has remained above 4%,
though it has declined to 2.7% above the national average. The regions with the highest share of
agricultural value added in total value added (> 5%) are Basilicata, Calabria and Puglia.
Incidenza
del
valore aggiunto
agricolo
sul valore
aggiunto
Share of
agricultural
value added
in total
value added
totale
6%
5%
4%
2%
1%
0%
1995
1996
1993
1994
ItalyItalia
1997
1995
1998
1996
1997
1999
1998
1999
2000
2000
2001
2001
Nord-ovest North-East
Nord-est Centre Centro South&Islands
Sud e isole
North-West
36
COMPETITIVENESS
Share of agricultural value added in total value added
Piemonte
Piemonte
Valle d’Aosta
d'Aosta
Valle
Lombardia
Lombardy
Trentino
- Alto Adige
Adige
Trentino-Alto
Veneto
Veneto
Friuli
- Venezia Giulia
Giulia
Friuli-Venezia
Liguria
Liguria
Emilia
- Romagna
Emilia-Romagna
Toscana
Tuscany
Umbria
Umbria
1995
2001
Marche
Marche
Lazio
Lazio
Abruzzo
Abruzzo
Molise
Molise
Campania
Campania
Puglia
Puglia
Basilicata
Basilicata
Calabria
Calabria
Sicilia
Sicily
Sardegna
Sardinia
0%
North-West
L
1%
2%
North-East
L
3%
Centre
L
37
4%
5%
6%
South & Islands
L
7%
Italy
L
8%
COMPETITIVENESS
13. Gross fixed investments in agriculture
Gross fixed investments in agriculture help to increase the competitiveness and efficiency of the
sector. The share of investments in agricultural value added is around 30%, with an annual rate of
growth of 1.5% from 1995 to 2001.
The regions with the greatest investments are Lombardy, Emilia Romagna and Puglia. Between
1995 and 2001, the rate of capital accumulation grew overall, with a 2.4% average annual rate of
variation. Geographically speaking, there was strong performance in the North (3.1% in the
North-East and 2.9% in the North-West), followed by the South and Islands (2.1%, attributable
mainly to Sardinia and Sicily) and the Centre with a more modest dynamic (1.2%, attributable
mainly to Umbria, Abruzzo and Lazio).
Expenditures for fixed investments in agriculture (1995=100)
150
140
130
120
110
100
90
1995
1996
1993
ItalyItalia
1994
1997
1995
1998
1996
1997
1999
1998
1999
2000
2000
2001
2001
Nord-ovest North-East
Nord-est CentreCentro South&Islands
Sud e isole
North-West
38
COMPETITIVENESS
Expenditures for fixed investments in agriculture
(million eurolira 1995)
Piemonte
Piemonte
Valle d’Aosta
d'Aosta
Lombardia
Lombardy
Trentino
- Alto Adige
Adige
Trentino-Alto
Veneto
Veneto
Friuli
- Venezia Giulia
Friuli-Venezia
Giulia
Liguria
Liguria
Emilia
- Romagna
Emilia-Romagna
Toscana
Tuscany
Umbria
Umbria
1995
2001
Marche
Marche
Lazio
Lazio
Abruzzo
Abruzzo
Molise
Molise
Campania
Campania
Puglia
Puglia
Basilicata
Basilicata
Calabria
Calabria
Sicilia
Sicily
Sardegna
Sardinia
0
North-West
☺
200
400
North-East
☺
600
800
Centre
K
39
1000
1200
South & Islands
K
1400
1600
Italy
☺
SOIL
14. Herd density
This indicator provides information about potential environmental pressure, especially on the soil,
brought about by raising livestock. Such pressure comes mainly from animal-produced effluents,
but also from excessive trampling, and may cause soil degradation and water pollution.
From 1970 to 2000, the indicator’s value rose from 0.49 to 0.82, signalling growing pressure of
raising livestock on the environment. The phenomenon affected all geographical areas, though to
varying degrees. The greatest increases occurred in the regions of the North, especially Valle
d’Aosta, Trentino Alto Adige and Liguria; the increase in the Centre and the South and Islands
was slightly lower than the national average. Exceptions were Sardinia, Molise and Marche. The
highest absolute values for the indicator were recorded in Lombardy, Veneto and Emilia Romagna.
Carico
di di
bestiame
Carico
bestiame(1970
(1970== 100)
100)
220
200
180
160
140
120
100
80
1970 1993
Italy
Italia
1994
1995
1982
North-West
Nord-ovest
1996
1997 1990
1998
North-East
Nord-est
40
Centre
Centro
1999
2000
2000 2001
South&Islands
Sud e isole
Herd density (LU/UAA)
SOIL
Piemonte
Piemonte
Valle
Valle d’Aosta
d'Aosta
Lombardy
Lombardia
Trentino-Alto
Trentino
- Alto Adige
Adige
Veneto
Veneto
Friuli-Venezia
Friuli
- Venezia Giulia
Giulia
Liguria
Liguria
Emilia-Romagna
Emilia
- Romagna
Tuscany
Toscana
Umbria
Umbria
1970
2000
Marche
Marche
Lazio
Abruzzo
Abruzzo
Molise
Molise
Campania
Campania
Puglia
Puglia
Basilicata
Basilicata
Calabria
Calabria
Sicilia
Sicily
Sardegna
Sardinia
0.0
North-West
L
0.5
North-East
L
1.0
1.5
Centre
K
41
2.0
South & Islands
L
2.5
3.0
Italy
L
SOIL
15. Livestock
The environmental pressure from raising livestock, besides herd density, varies according to type
of livestock. For example, water eutrophication owing to high levels of nitrogen and phosphorus
tends to be more frequent in areas with higher concentration of pigs, while soil degradation is
more common in areas where sheep and goats are raised. By dividing livestock by type, environmental pressure associated with different species can be shown.
In the period under examination, the breakdown of livestock raising changed. More pigs and
poultry were raised, compared with cattle. This trend was stronger in regions of the North-West
and North-East: the reduced number of cattle was compensated in the first case by a marked
increase in pigs; in the second, by an increase in poultry. In the Centre, increases were recorded
in the number sheep, goats and poultry, whereas the breakdown of stock remained more stable
in the South and Islands.
Patrimonio zootecnico
Livestock
100%
90%
80%
70%
60%
50%
40%
30%
20%
10%
0%
1970
1982
Cattle and buffalo
Horses
42
Pigs
1990
Sheep-goats
Poultry
2000
Livestock 2000
SOIL
Piemonte
Piemonte
Patrimonio zootecnico (2000)
Valle d’Aosta
d'Aosta
Valle
Lombardia
Lombardy
Trentino
- Alto Adige
Adige
Trentino-Alto
Veneto
Veneto
Friuli
- Venezia Giulia
Friuli-Venezia
Giulia
Liguria
Liguria
Patrimonio zootecnico
Emilia
- Romagna
Emilia-Romagna
100%
Toscana
Tuscany
Umbria
90%
Marche
Marche
70%
Abruzzo
Abruzzo
80%
60%
50%
40%
30%
20%
10%
0%
Lazio
Lazio
Molise
Molise
Campania
Campania
Puglia
Puglia
Basilicata
Basilicata
Calabria
Calabria
Sicilia
Sicily
Sardegna
Sardinia
0%
1970
North-West
L
20%
1982
Cattle
buffalo
Boviniand
e bufalini
North-East
L
40%
Horses
Equini
Centre
L
43
60%
80%
100%
1990
2000
Pigs
Sheep-goats Avicoli
Poultry
Suini Ovi-caprini
South & Islands
K
Italy
L
SOIL
16. Phosphorus balance
This indicator shows the input/output balance of phosphorus per hectare of land, thus providing
data about quantitative surplus. Excess phosphorus released onto the land by organic fertilisers
(manure, sewage) and mineral fertilisers (synthetic) is considered one of the agricultural sources
of pollution and alteration of the biological and structural balance of the soil. An excess of phosphorus in the soil may in fact reduce species diversity, thus altering competitive equilibrium. Phosphorus is also the main cause of freshwater eutrophication. Reducing levels of phosphorus in
soil may take decades, since available phosphorus has to be replaced by reserves of unavailable
phosphorus in the soil. It is therefore unreasonable to expect a reversal of this trend in the short
term, even with potential reduction in input levels.
Regions with the highest surplus per hectare are those in the North, especially Lombardy and
Veneto (more than 60 kg/ha) and Emilia Romagna (36 kg/ha). But those very regions have achieved the greatest reductions in the last six years, whereas despite relatively lower figures the
regions of the Centre and South showed the highest increases, especially Umbria, Puglia and
Sicily.
Phosphorus balance (1994= 100)
Surplus di fosforo (1994= 100)
240
220
200
180
160
140
120
100
80
60
1993
1994
Italy
Italia
1994
1995
1996
1997
1998
1998
1999
2000
2000
2001
North-West
North-East
Centre
South&Islands
Nord-ovest
Nord-est
Centro
Sud e isole
44
Phosphorus surplus (kg/UAA)
Piemonte
Piemonte
SOIL
Surplus di fosforo (kg/SAU)
Valled’Aosta
d'Aosta
Valle
Liguria
Lombardy
Lombardia
Trentino-Alto
Adige
Trentino - Alto
Adige
Veneto
Friuli-VeneziaVeneto
Giulia
Friuli - VeneziaLiguria
Giulia
Emilia Romagna
Emilia-Romagna
Toscana
Tuscany
Umbria
Umbria
Marche
Marche
1994
2000
Lazio
Lazio
Abruzzo
Abruzzo
Molise
Molise
Campania
Campania
Puglia
Puglia
Basilicata
Basilicata
Calabria
Calabria
Sicilia
Sicily
Sardegna
Sardinia
0
North-West
L
10
20
North-East
L
30
40
50
Centre
L
45
60
70
80
South & Islands
L
90
Italy
L
100
SOIL
17. Use of plant protection products
This indicator takes into consideration the amount of plant protection products (classed according to toxicity and content of active ingredients) marketed annually, by hectare of “treatable”
area. Plant protection products are used to protect harvests against parasites, pathogens and
infestants, and to ensure high quality of production. These substances may remain in the environment for long periods of time in some cases. Their main impact is on the soil (which undergoes changes in chemical, physical and biological properties), on both surface and groundwater,
on biological equilibrium (micro-fauna, flora and fauna), and on human health as well.
In fifteen years, the quantity of plant protection products distributed for agricultural use in Italy
has decreased by almost 18%, with a marked drop of 10% in the last five years in the use of products that are highly toxic, toxic, or toxic and noxious. There has not, however, been a similar
reduction in active ingredients, and their use has remained substantially unchanged. An analysis
by unit of “treatable” area confirms on the one hand the marked reduction of the most highly toxic
products (especially in the Centre and the North), and on the other it shows a 3% increase in the
total amount of plant protection products and a 5% increase in active ingredients. These figures
derive mainly from the significant reduction in UAA registered in 2000.
Plant protection products distributed for agricultural use (1997=100)
Prodotti fitosanitari distribuiti per uso agricolo (1997=100)
105
100
95
90
85
80
1997
1993
Italy
Italia
1994
1995
1998
North-West
Nord-ovest
1996
North-East
Nord-est
46
199719991998
Centre
Centro
1999
2000
2000 2001
South&Islands
Sud e isole
SOIL
Plant protection products distributed for agricultural use,
classified by toxicity (kg/ha, 2000)
Piemonte
Piemonte
Valle d’Aosta
d'Aosta
Valle
Lombardia
Lombardy
Trentino Alto-Adige
Trentino-Alto
Adige
Veneto
Friuli Venezia Giulia
Friuli-Venezia
Liguria
Emilia Romagna
Emilia-Romagna
Toscana
Tuscany
Umbria
Umbria
Marche
Marche
Lazio
Abruzzo
Abruzzo
Molise
Molise
Campania
Campania
Puglia
Puglia
Basilicata
Basilicata
Calabria
Calabria
SiciIia
Sicily
Sardegna
Sardinia
0
North-West
L
20
40
Highly toxic or toxic
North-East
L
Noxious
Centre
L
47
60
80
100
Not classifiable
South & Islands
L
Italy
L
ATMOSPHERE
18. Methane emissions (CH4)
One of the greatest environmental challenges for the international community is the reduction of
greenhouse gases (GHGs). Indeed, the agreements reached in the Kyoto Protocol call for a
reduction in GHGs by 6.5% compared to 1990 levels, to be achieved between 2008 and 2012.
Methane is one of the gases responsible for the greenhouse effect and climate change, resulting
in a rise in the temperature of the earth’s surface and the lower atmosphere, and causing disturbing repercussions for animal and plant life. Over 30% of methane emissions come from agriculture, especially livestock farming (mainly the raising of ruminants) and rice cultivation.
From 1994 to 2000, methane emissions dropped by 1.6%, from 720,000 to nearly 708,000 tonnes. This reduction occurred almost entirely in the North-East, as against increases in the NorthWest and the Centre. The greatest quantity of CH4 emissions was produced in the South and
Islands (especially Sardinia) and the North-West (especially Lombardy).
Methane emissions (1994=100)
Emissioni di metano (1994=100)
120
110
100
90
80
1994
Italy
1993
1994
1995
1997
1996
1997 1998
1998
Italia North-West
Nord-ovest North-East
Nord-est
48
Centro
Centre
1999
200020002001
Sud e isole
South&Islands
ATMOSPHERE
Methane emissions (tonnes)
Emissioni di metano (tonnellate)
Piemonte
Piemonte
Valle
Valle d’Aosta
d'Aosta
Lombardia
Lombardy
Trentino-Alto Adige
Adige
Trentino-Alto
Veneto
Friuli-Venezia
Friuli-Venezia Giulia
Giulia
Liguria
Emilia-Romagna
Emilia-Romagna
Tuscany
Toscana
1994
Umbria
Umbria
2000
Marche
Marche
Lazio
Abruzzo
Abruzzo
Molise
Molise
Campania
Campania
Puglia
Basilicata
Basilicata
Calabria
Calabria
Sicily
Sicilia
Sardinia
Sardegna
0
North-West
L
20.000
40.000
North-East
☺
60.000
Centre
L
49
80.000
100.000
120.000
South & Islands
L
140.000
Italy
L
ATMOSPHERE
19. Ammonia emissions (NH3)
Agricultural practices cause nitrogen loss by volatisation, in the form of ammonia, which increases acid rainfall and eutrophication of soil and water systems. Around 90% of ammonia emissions in Europe come from agriculture. The main sources are: a) livestock effluents (based on
breakdown, management and use); b) nitrogenous mineral fertilisers (according to fertiliser quality, pedo-climatic characteristics and the vegetative phase of the plant when fertiliser is applied).
The Geneva Convention on trans-border atmospheric pollution (1999) introduced target reduction
levels, differentiated by country, that together would lower NH3 by 17% compared with 1990
levels.
Between 1994 and 2000, there was a gradual decrease in atmospheric ammonia emissions both
nationally and regionally. The greatest reductions were achieved in Friuli Venezia Giulia and
Campania.
Ammonia emissions (1994=100)
Emissioni di ammoniaca (1994=100)
120
110
100
90
80
70
1994
1993
Italia
Italy
1994
1997
1995
Nord-ovest
North-West
1996
1997
Nord-est
North-East
50
1998
1998
Centre
1999
Centro
2000
2000
2001
Sud e isole
South&Islands
ATMOSPHERE
Ammonia emissions (tonnes)
Emissioni di anidride carbonica (000 di tonnellate)
Piemonte
Piemonte
Valle d’Aosta
d'Aosta
Valle
Liguria
Lombardy
Lombardia
Trentino-Alto
Adige
Trentino AltoVeneto
Adige
Friuli-VeneziaVeneto
Giulia
Friuli VeneziaLiguria
Giulia
Emilia Romagna
Emilia-Romagna
Toscana
Tuscany
Umbria
Umbria
1994
1998
Marche
Marche
Lazio
Lazio
Abruzzo
Abruzzo
Molise
Molise
Campania
Campania
Puglia
Puglia
Basilicata
Basilicata
Calabria
Calabria
Sicilia
Sicily
Sardegna
Sardinia
0
North-West
☺
200
400
North-East
☺
600
800
Centre
☺
51
1000
1200
South & Islands
☺
1400
1600
Italy
☺
ATMOSPHERE
20. Carbon dioxide emissions (CO2)
This indicator monitors emissions of CO2 in agriculture. In particular, it assesses emissions from
tractor fuel combustion, which are the main source of CO2. The accumulation of CO2 in the atmosphere, by altering its degree of radioactivity, may cause important changes in climate balance.
Reducing CO2 emissions is one of the obligations established by the United Nations Framework
Convention on Climate Change and the Kyoto Protocol, which bind Italy to reducing its GHG
emissions by 6.5% compared with 1990 levels between 2008 and 2012.
From 1994 to 1998, CO2 emissions increased on average by 2.6%. The highest emissions were
in the North, especially Lombardy, Emilia Romagna (with over 1,000,000 tonnes per year) and
Veneto (964,000 tonnes).
Carbon dioxide emissions (1998)
Emissioni di anidride carbonica (1998)
North-West
North-East
52
Centre
South&islands
ATMOSPHERE
Carbon dioxide emissions (‘000 tonnes)
Emissioni di anidride carbonica (000 di tonnellate)
Piemonte
Piemonte
Valle d’Aosta
d'Aosta
Valle
Liguria
Lombardy
Lombardia
Trentino-Alto
Adige
Trentino AltoVeneto
Adige
Friuli-VeneziaVeneto
Giulia
Friuli VeneziaLiguria
Giulia
Emilia Romagna
Emilia-Romagna
Toscana
Tuscany
Umbria
Umbria
1994
Marche
Marche
1998
Lazio
Lazio
Abruzzo
Abruzzo
Molise
Molise
Campania
Campania
Puglia
Puglia
Basilicata
Basilicata
Calabria
Calabria
Sicilia
Sicily
Sardegna
Sardinia
0
North-West
L
200
400
North-East
L
600
800
Centre
L
53
1000
1200
South & Islands
L
1400
1600
Italy
L
ATMOSPHERE
21. Direct use of energy
This indicator provides an estimate of energy consumption based on the use of various direct
inputs used in agriculture (fuels and lubricants). The amount of energy consumed depends not
only on external factors like atmospheric conditions, but also on technologies used, the introduction of new agricultural practices, and policies that regulate input use.
By rationalising direct energy consumption, benefits may be gained both economically (greater
efficiency) and environmentally, through better conservation of non-renewable resources, lower
emissions of gases into the atmosphere, reduced risk to human health and less water pollution.
In 2000, direct consumption of energy was 363,713 GJ. Between 1998 and 2000, this was reduced by 6%, from 5.3 to 5 GJ per hectare. This trend was influenced by reductions in the South
and Islands, and to a lesser extent in the North-West, as against an increase in energy use in the
central regions.
Direct consumption
of energy
(GJ/UAA)
Consumo diretto
di energia
(GJ/SAU)
8
7
6
5
1998
2000
4
3
2
1
0
Italy
Centre
North-West
54
South&islands
Consumo diretto di energia (GJ/SAU)
ATMOSPHERE
Direct consumption of energy (GJ/farm)
Consumo diretto di energia (GJ/azienda)
8
7
180
160
6
140
5
120
1998
2000
4
100
1998
2000
80
3
60
2
40
1
20
00
Italy
Italia
North-West
☺
Centre
Centro
North-West
Nord-ovest
North-East
n.g.
Centre
L
55
South&islands
Sud e isole
South & Islands
☺
Italy
☺
WATER RESOURCES (QUALITY)
22. Nitrogen balance
Nitrogen is one of the indispensable inputs in both plant and animal production, essential for
growth and production. Nitrogen requirements vary according to type of crop and/or livestock,
and their productive performance. For plant production, supplies of nitrogen can be both inorganic and organic (manure and refluents); for animals, it comes from plants and sub-products used
as feed. In terms of nutritive content, the output of plant production is the input for animal production, and vice versa.
An excess of nitrogen may compromise the quality of surface and groundwater (through percolation and leaching) and air (through ammonia emissions that increase acid rainfall), as well affecting the equilibrium of aquatic ecosystems. Nitrogen loss also implies a loss of economic resources for farmers.
After an initial reduction in the surplus of nitrogen, an average increase was observed in 2000,
due partly to less UAA registered in the census. Only the Centre showed a reduction compared to
1994 (-17.22%). Increases in the North did not exceed 10%, whereas the South and Islands registered increases of more than 50%. Regionally the situation varied considerably, with increases
of over 230% in Puglia and decreases of up to 90% (Trentino Alto Adige).
Bilancio di azoto (1994=100)
Bilancio di azoto (1994=100)
160
140
120
100
80
60
40
1994
1993
ItalyItalia
1994
1997
1995
1996
1998
1997
1998
Nord-ovest North-East
Nord-est
North-West
56
Centro
Centre
1999
2000
2000
Sud e isole
South&Islands
2001
WATER RESOURCES (QUALITY)
Bilancio di azoto (kg/SAU)
Nitrogen balance (kg/UAA)
Piemonte
Piemonte
Valle
Valled’Aosta
d'Aosta
Lombardia
Lombardy
Trentino-AltoAdige
Adige
Trentino-Alto
Veneto
Veneto
Friuli-Venezia Giulia
Giulia
Friuli-Venezia
Liguria
Liguria
Emilia-Romagna
Emilia-Romagna
Toscana
Tuscany
Umbria
Umbria
1994
2000
Marche
Marche
Lazio
Lazio
Abruzzo
Abruzzo
Molise
Molise
Campania
Campania
Puglia
Puglia
Basilicata
Basilicata
Calabria
Calabria
Sicilia
Sicily
Sardegna
Sardinia
0
North-West
L
20
40
North-East
L
60
Centre
☺
57
80
100
120
South & Islands
L
140
Italy
L
WATER RESOURCES (QUALITY)
23. Potential leaching of nitrates
This indicator measures the potential environmental pressure of agriculture (crops and livestock)
on aquifers.
When available nitrogen exceeds the amount needed, the surplus is dispersed into the environment by leaching and volatisation processes. Leaching of nitrogen causes water pollution, and
together with large amounts of phosphorus causes water eutrophication. The amount of leached
nitrogen, and the resulting water pollution from nitrates, depends not only on the quantity of nitrogen applied, but also on features of the agri-environmental system (e.g. type of soil), the process
of de-nitrification, climate conditions and seasons of the year (most losses occur in autumn and
winter when plants need less nitrogen and the mineralization of organic matter increases the
nitrate content of water in the soil), crop lay-out (nitrogen absorption depends of the type of crop)
and cultivation practices (quantity and timing of fertiliser distribution). High surpluses of nitrogen
can therefore present low risks of leaching and resulting pollution, and vice versa, based on
pedo-climatic conditions and techniques.
In 2000, leached nitrogen (11.37 kg/ha) was approximately one fourth of that in excess (see indicator 22). In analysing the amount of leached nitrogen, the pronounced differences between surplus levels in the geographical areas are considerably minimised, meaning the risks of pollution
are fairly uniform throughout the country. Nonetheless, the South and Islands showed the lowest
levels (<10 kg/ha).
Liscivazione
potenziale
nitrati (kg/ha,
anno2000)
2000)
Potential
leaching
of dei
nitrates
(kg/ha,
90
80
70
60
50
40
30
20
10
0
Italy
North-West
North-East
potential leaching of nitrates
58
Centre
nitrogen surplus
South&Islands
WATER RESOURCES (QUALITY)
Potential leaching of nitrates (kg/ha, 2000)
Liscivazione potenziale dei nitrati (kg/ha, anno 2000)
Piemonte
Piemonte
Valle d’Aosta
d'Aosta
Valle
Liguria
Lombardy
Lombardia
Trentino-Alto
Adige
Trentino AltoVeneto
Adige
Friuli-VeneziaVeneto
Giulia
Friuli VeneziaLiguria
Giulia
Emilia Romagna
Emilia-Romagna
90
80
70
Liscivazione potenziale dei nitrati (kg/ha, anno 2000)
Toscana
Tuscany
Umbria
Umbria
Marche
Marche
Lazio
Lazio
Abruzzo
60 Abruzzo
Molise
Molise
50Campania
Campania
40
Puglia
Puglia
Basilicata
30 Basilicata
Calabria
20 Calabria
Sicilia
Sicily
10 Sardegna
0
Sardinia
0
Italy
North-West
L
20
40
North-West
60
80
North-East
lisciviazione potenziale dei nitrati
potential leaching of nitrates
North-East
L
Centre
L
59
100
120
Centre
surplus di azoto
nitrogen surplus
South & Islands
L
140
South&Islands
Italy
L
WATER RESOURCES (QUALITY)
24. Fertiliser use
Mineral fertilisers useful for plant nutrition may cause soil degradation, pollution of water resources and problems of instability in aquatic ecosystems (eutrophication and loss of biodiversity).
Use per area unit gives an indication of potential environmental pressure from fertilisation.
The use of mineral fertilisers is regulated by Legislative Decree 152/99, which acknowledges the
European Directive 91/676/EEC, and Law 748/84 and subsequent changes. The Ministry for Agricultural Policies Decree of 19/04/99 “Approval of the Code of Good Agricultural Practice” also
defines usage procedure.
After peaking in 1993, distribution of fertilisers per hectare of fertilisable area steadily declined
(except for a slight increase in 1997), and then rose again in 2000 when the census revealed a
significant decrease in UAA. Overall, since 1990, there has been an increase in the Centre and
the South and Islands, and a decrease in the North-West. There has been an annual decline in
the regions of Valle d’Aosta, Piemonte, Lombardy, Emilia Romagna, Tuscany, Abruzzo, Molise
and Puglia.
Fertiliser use (1990=100)
Consumo di fertilizzanti (1990=100)
150
140
130
120
110
100
90
80
1990
1993
1993
Italia
Italy
1995
1994
199519961996
Nord-ovest
North-West
1997
1997
Nord-est
North-East
60
1998 1999 1999
1998
2000
2000
2001
Sud e isole
Centre Centro South&Islands
WATER RESOURCES (QUALITY)
(kg/unit of fertilisable land)
Piemonte
Piemonte
Consumo di fertilizzanti (kg/superficie concimabile)
Valle
d’Aosta
Valle d'Aosta
Lombardia
Lombardy
Trentino
- Alto Adige
Adige
Trentino-Alto
Veneto
Veneto
Friuli
- Venezia Giulia
Friuli-Venezia
Giulia
Liguria
Liguria
Emilia - Romagna
Emilia-Romagna
Toscana
Tuscany
Umbria
1990
2000
Umbria
Marche
Marche
Lazio
Lazio
Abruzzo
Abruzzo
Molise
Molise
Campania
Campania
Puglia
Puglia
Basilicata
Basilicata
Calabria
Calabria
Sicilia
Sicily
Sardegna
Sardinia0
North-West
☺
100
North-East
☺
200
300
Centre
L
61
400
500
South & Islands
L
600
Italy
K
WATER RESOURCES (QUALITY)
25. Application of a fertilising plan
The application of a fertilising plan, by controlling methods, timing and doses of fertiliser, reduces
excess nutrients in the soil and inhibits them from being dispersed in water. This practice is a
possible answer to environmental pollution due to fertilisers, and contributes to sustainability in
agriculture.
The percentage of farms that adopt a fertilising plan is rising rapidly. Since 1998, it has increased
by more than 40%, from 20% to 30% of farms. The greatest increases have been in the South
and Islands (especially Abruzzo, Campania and Calabria), which have now reached a percentage
comparable with the other areas of the country. The percentage of farms in the Centre that use a
fertilising plan remains lower than the national average, despite a marked increase in Umbria.
Application of a fertilising plan (1998=100)
Applicazione di un piano di concimazione (1998=100)
180
160
140
1998
2000
120
100
80
Italy
North-West
North-East
62
Centre
South&Islands
WATER RESOURCES (QUALITY)
Application of a fertilising plan
Applicazione di un piano di concimazione
Piemonte
Piemonte
Valled’Aosta
d'Aosta
Valle
Lombardia
Lombardy
Trentino-Alto Adige
Adige
Trentino-Alto
Veneto
Veneto
Friuli-Venezia Giulia
Giulia
Friuli-Venezia
Liguria
Liguria
Emilia-Romagna
Emilia-Romagna
Toscana
Tuscany
1998
2000
Umbria
Umbria
Marche
Marche
Lazio
Lazio
Abruzzo
Abruzzo
Molise
Molise
Campania
Campania
Puglia
Puglia
Basilicata
Basilicata
Calabria
Calabria
Sicilia
Sicily
Sardegna
Sardinia
0%
North-West
☺
10%
North-East
☺
20%
30%
Centre
☺
63
40%
50%
South & Islands
☺
60%
Italy
☺
WATER RESOURCES (QUANTITY)
26. Irrigation systems
This indicator tracks the use of various irrigation methods. Irrigation systems can be divided into
two categories: those that use more water (flooding, furrowing and lateral seepage); and those
that use less (sprinklers and drippers). Irrigation systems of the first type exert greater environmental pressure that those of the second. Indeed, besides using more water, they can disperse
substances that may pollute the water table, and runoffs that cause water erosion.
The most widely used irrigation systems are sprinklers (around 46% of irrigated farms) and furrowing and lateral seepage (44%), which has declined in use over the last decade and is no longer
the preferred system. In the North-West furrowing remains prevalent (67% of farms), whereas in
the North-East sprinkling is the method most widely used (68%). From 1980 to 2000, fewer farms
used furrowing and flooding, and more used sprinkling and drip irrigation, systems that are more
efficient and have less environmental impact.
Irrigation systems in Italy
Sistemi d'irrigazione in Italia
100%
90%
80%
70%
60%
50%
40%
30%
20%
10%
0%
sprinkling
1982
flooding
1990
furrowing and lateral seepage
64
drip
2000
other
WATER RESOURCES (QUANTITY)
Irrigation systems (2000)
Sistemi di irrigazione (2000)
Piemonte
Piemonte
Valle d’Aosta
d'Aosta
Valle
Lombardia
Lombardy
Trentino
- Alto Adige
Adige
Trentino-Alto
Veneto
Veneto
Friuli
- Venezia Giulia
Giulia
Friuli-Venezia
Liguria
Liguria
Emilia
- Romagna
Emilia-Romagna
100%
90%
80%
70%
60%
50%
40%
30%
20%
10%
0%
Toscana
Tuscany
Sistemi d'irrigazione in Italia
Umbria
Umbria
Marche
Marche
Lazio
Lazio
Abruzzo
Abruzzo
Molise
Molise
Campania
Campania
Puglia
Puglia
Basilicata
Basilicata
Calabria
Calabria
Sicilia
Sicily
Sardegna
Sardinia
0%
sprinkling
1982
10%
20%
30%
40%
1990
50%
60%
aspersione
flooding
furrowing and lateral seepage
scorrimento superficiale e infiltrazione laterale
altro sistema
North-West
☺
North-East
☺
Centre
☺
65
80%
2000
sommersione
drip
other
90%
localizzata sottochioma
South & Islands
☺
70%
Italy
☺
WATER RESOURCES (QUANTITY)
27. Irrigated land
This indicator is offered as a proxy for the quantity of water effectively used in agriculture. The
figures are influenced by such factors as pedo-climatic conditions and type of crop. There is more
irrigated land in the South and in areas with more fruits and vegetables and crops with high value
added.
Besides indicating more use of water resources, a higher percentage of irrigated UAA where the
soil is unsuitable for planting certain crops may signal problems of soil degradation (water erosion, contamination from the transport of chemical substances) and loss of biodiversity as a
result.
In 2000, Italy had 2,468,000 hectares of irrigated land, or 18% of UAA. Compared to 1982, it
increased slightly in absolute terms and quite considerably in terms of UAA, from 10% to 18%.
This trend may be largely attributed to the significant reduction in UAA registered in the 2000 census. The North showed the highest irrigated UAA and the greatest annual rate of increase. Irrigated UAA in the Centre and South did not exceed 11%, though the annual rate of increase was
around 3%. As for the regions, the greatest increases occurred in Piemonte and Valle d’Aosta.
Quota
di SAU irrigata
(1982=100)
Share
of irrigated
UAA (1982=100)
220
200
180
160
140
120
100
1993
1982
Italia
Italy
1994
1995
Nord-ovest
North-West
1996
1990
1997
Nord-est
North-East
66
1998
Centro
Centre
1999 2000
2000
2001
Sud e isole
South&Islands
WATER RESOURCES (QUANTITY)
Share of irrigated UAA
Quota di SAU irrigata
Piemonte
Piemonte
Valle
Valle d’Aosta
d'Aosta
Lombardia
Lombardy
Trentino-Alto Adige
Adige
Trentino-Alto
Veneto
Veneto
Friuli-Venezia
Friuli-Venezia Giulia
Giulia
Liguria
Liguria
Emilia-Romagna
Emilia-Romagna
Toscana
Tuscany
Umbria
Umbria
Marche
Marche
1982
2000
Lazio
Lazio
Abruzzo
Abruzzo
Molise
Molise
Campania
Campania
Puglia
Puglia
Basilicata
Basilicata
Calabria
Calabria
Sicilia
Sicily
Sardegna
Sardinia
0%
North-West
L
10%
North-East
L
20%
30%
Centre
L
67
40%
50%
South & Islands
L
60%
Italy
L
WATER RESOURCES (QUANTITY)
28. Type of catchment
Of the water abstracted from the 741 sources used by regional water authorities in the South and
Islands, 53% comes from catchment of groundwater (mostly from wells in Puglia). Catchment
from surface wells makes up 5% (mainly in Campania and Basilicata); water abstracted from
springs - whose flow are often scant - are used mainly for irrigation purposes, and accounted for
8%. Water abstracted from natural lakes and/or reservoirs and artificial lakes accounted for nearly
10% and also includes large storage beneath dams. Finally, there are 119 (16%) river weir intakes and 30 (4%) canal intakes.
The abstracting of groundwater (almost 60% of registered sources) causes the greatest environmental pressure, since in cases where bodies of water are exploited faster than they can be
replenished the water table may drop, and in areas close to the sea, saltwater can seep in and
damage water quality. The situation is actually even worse, as the indicator does not include private catching structures that do not fall under planning and control measures, and which are
often linked to illegal pumping.
The case in Puglia is especially significant: 92% of supply comes from groundwater, a fact aggravated by a poorly developed surface-water network and widespread use of irrigation farming.
Percentage breakdown of types of catchment by region
Fonti di approvvigionamento
Abruzzo
Abruzzo
Molise
Campania
Campania
Basilicata
Puglia
Puglia
Calabria
Calabria
Sicilia
Sicily
Sardegna
Sardinia
0%
10%
20%
30%
68
40%
50%
60%
WATER RESOURCES (QUANTITY)
Type of water catchment
Tipologia di fonte di approvviggionamento
Abruzzo
Abruzzo
Molise
Molise
Campania
Campania
Basilicata
Basilicata
Puglia
Puglia
Calabria
Calabria
Sicily
Sicilia
Sardegna
Sardinia
0%
Canal catchment
Catchment from shallow
River intakes
20%
40%
Spring catchment
Artificial lake intakes
Other
60%
69
100%
Catchment from deep groundwater table
Natural lake intakes
South & Islands
L
80%
BIODIVERSITY
29. Protected areas
Protected areas have significant natural and environmental value protected by specific safeguards, including bans on activities that may damage the landscape, natural environments and
protected flora and fauna.
The increase in numbers or dimensions of these areas therefore indicates improvements to the
landscape and greater protection of biodiversity.
In 2000, there were 669 protected areas in Italy, covering a total of 2,752,952 hectares, which
included 21 national parks, 143 state nature reserves, 15 state marine reserves, 110 regional
nature parks, 252 regional nature reserves and 128 other protected natural areas. In the last fifteen years, protected areas increased by 8.5% (from 445 to 669); there was a particular increase
in parks (from 75 to 110) and regional nature reserves (from 172 to 252). The greatest percentage of national nature areas is concentrated in the South and Islands (around 50%), corresponding to 11.2% of total area. The three regions with the greatest number of protected areas are, in
order: Campania, Abruzzo and Trentino Alto Adige; Molise and Liguria have the fewest.
Protected areas (number)
Aree protette (numero)
700
600
500
400
1993
2000
300
200
100
0
National parks
State nature and
marine reserves
Regional parks and
nature reserves
70
Other protected
natural areas
Total protected
areas
BIODIVERSITY
Protected areas (share of national territory), 2000
Aree protette (quota di superficie territoriale), 2000
Applicazione di un piano di concimazione (1998=100)
12%
180
10%
160
8%
140
6%
1998
2000
120
4%
100
2%
0%
80
Italia
Italy
North-West
☺
Nord-ovest
North-West
North-East
☺
Nord-est
North-East
Centre
☺
71
Centro
Centre
South & Islands
☺
Sud e isole
South&Islands
Italy
☺
Specie estinte ed in pericolo (1995)
Piemonte
Valle d'Aosta
BIODIVERSITY
Lombardia
Trentino - Alto Adige
30. Condition
of plant species
Veneto
Friuli - Venezia Giulia
This indicator monitors the presence and condition of some endangered plant species (included
Liguria
in the “Red List”), relevant to the objective of preserving species diversity. In this case, measureEmilia - Romagna
ment of biodiversity is associated with the concept of richness of species, or their
Toscana
presence/absence.
Umbria
Though a reduction in number of species generally indicates diminished biodiversity, caution
must beMarche
used in interpreting this indicator, since it should be considered in connection with expecLazio
ted richness
of species in habitats and the ecological areas under consideration, that is to say,
Abruzzo
with characteristic
species in various habitats.
Molise
The regions
with the most endangered plant species are Sicily (589), Lazio (563) and Abruzzo
(518).Campania
In Sicily 6 species are already extinct, and 29 are extinct in the wild. The highest percentage of threatened
and severely threatened species is in Sardinia, Marche, Puglia and Liguria.
Puglia
Basilicata
Analysis
has not been made by area and nationally, since the aggregation of regional data does
not correspond
Calabria to the number of endangered species by area or nationally, as each species may
be endangered
Sicilia in more than one region.
Sardegna
0%
10%
20%
30%
40%
Estinte
50%
60%
70%
Specie in pericolo
80%
90%
100%
Extinct and endangered species (1995)
Specie estinte ed in pericolo (1995)
Piemonte
Valle d’Aosta
d'Aosta
Lombardia
Lombardy
Trentino
- Alto Adige
Adige
Trentino-Alto
Veneto
Veneto
Friuli
- Venezia Giulia
Giulia
Friuli-Venezia
Liguria
Liguria
Emilia
- Romagna
Emilia-Romagna
Toscana
Tuscany
Umbria
Extinct
Estinte
Marche
Lazio
Threatened
Specie in
pericolo
Abruzzo
Abruzzo
Molise
Molise
Campania
Campania
Puglia
Basilicata
Calabria
Calabria
Sicilia
Sicily
Sardinia
Sardegna
0%
10%
20%
30%
40%
50%
72
60%
70%
80%
90% 100%
BIODIVERSITY
Extinct and endangered species (1995)
Specie estinte ed in pericolo (1995)
Piemonte
Piemonte
Valle
Valle d’Aosta
d'Aosta
Lombardy
Lombardia
Trentino
- Alto Adige
Trentino-Alto
Adige
Veneto
Veneto
Friuli-Venezia
Giulia
Friuli
- Venezia Giulia
Liguria
Liguria
Emilia-Romagna
Emilia
- Romagna
Tuscany
Toscana
Umbria
Umbria
Marche
Marche
Lazio
Lazio
Abruzzo
Abruzzo
Molise
Molise
Campania
Campania
Puglia
Puglia
Basilicata
Basilicata
Calabria
Calabria
Sicilia
Sicily
Sardegna
Sardinia
0%
10%
Extinct
Threatened
20%
30%
40%
50%
Extinct in the wild
At minor risk
73
60%
70%
80%
90%
Severely threatened
Vulnerable
100%
BIODIVERSITY
31. Wooded land affected by fire
Forest fires are one of the main causes of degradation and destruction of Italy’s forest heritage.
Damage caused by fires is both direct and indirect. The first type concerns damage with immediate economic effects; the second regards environmental damage (changes in plant population,
reduction in hydro-geological defence, a drain on landscape and tourist-recreation areas etc.).
The indicator may be used as a proxy for loss of biodiversity, though it should be used in connection with information about the fragility of the ecosystems involved. It also gives information about
the “response” to the phenomenon of fires, in terms of prevention and control.
From 1985 to 2000, almost 0.7% of Italy’s wooded lands were affected by fire annually on average. Following a drop in 1995 and 1996 (2.2%), the figures for the indicator again began to rise,
reaching levels that hovered between 0.7% and 0.9%. In 2000, the regions of the South and
Islands recorded much higher figures (2.2% on average) compared to the Italian average of
0.87%. The worst-hit regions in 2000 were Puglia, Sicily and Calabria, with affected areas approximately 10 times those in most other regions of Italy. The area least affected was the North-East,
with an average of 0.03% of wooded land affected by fire.
Wooded land affected by fire (1985=100)
Superficie forestale percorsa dal fuoco (1985=100)
500
450
400
350
300
250
200
150
100
50
0
1985
1993
Italia
Italy
1994
1990
1995
Nord-ovest
North-West
1996
Nord-est
North-East
74
1995
1997
1998
Centro
Centre
1999
2000
2000
Sud e isole
South&Islands
2001
BIODIVERSITY
Wooded land affected by fire (1985=100)
Superficie forestale percorsa dal fuoco (1985=100)
Piemonte
Piemonte
Valle d'Aosta
Valle d’Aosta
Lombardia
Lombardy
Trentino - Alto Adige
Trentino-Alto Adige
Veneto
Veneto
Friuli - Venezia Giulia
Friuli-Venezia Giulia
Liguria
Liguria
Emilia - Romagna
Emilia-Romagna
Toscana
Tuscany
Umbria
Umbria
Marche
1985
Marche
Lazio
2000
Lazio
Abruzzo
Abruzzo
Molise
Campania
Molise
Puglia
Campania
Basilicata
Puglia
Calabria
Basilicata
Sicilia
Calabria
Sardegna
Sicily
Sardinia
0
North-West
L
1
North-East
K
2
Centre
L
75
3
4
South & Islands
L
5
Italy
L
BIODIVERSITY
32. Organic farming
Organic farming is based on production methods that exclude the use of synthetic fertilisers, plant
protection products, herbicides and genetically modified organisms, thus generating positive
effects on biodiversity.
Since 1990, the increase in organically farmed land has been encouraged by several European
Community regulations (EEC Reg. 866/90, EEC Reg. 2328/91, EEC Reg. 2078/92, EEC Reg.
2081/93 and EEC Reg. 2088/93). Reg. 1804/99 also extended the previous regulation (Reg.
2092/91) to livestock products for recognition of organic production.
Between 1993 and 2000, there was continuous growth in organic farming, in terms of both utilised area and number of farms. UAA for organic farming went from 0.6% to 8%, with an average
annual increase of 38%. The greatest increases were in the South and Islands, especially Sardinia and Calabria. There were reductions in Friuli Venezia Giulia. Along with increases in land,
there was a parallel increase, especially in the South and Islands, in the number of organic farms
(from 4,700 in 1993 to 54,000 in 2000).
Organic farming share of UAA (1993=100)
Quota di SAU ad agricoltura biologica (1993=100)
2500
2300
2100
1900
1700
1500
1300
1100
900
700
500
300
100
1993
1994
1993
Italy
Italia
1995
1994
1995
Nord-ovest
North-West
1996
1996
1997
Nord-est
North-East
76
1997
1998
1998
Centro
Centre
1999
1999
2000
2000
Sud e isole
South&Islands
2001
Quota di SAU ad agricoltura biologica
BIODIVERSITY
Organic farming share of UAA
Piemonte
Piemonte
Valle
Valle d'Aosta
d’Aosta
Lombardia
Lombardy
Trentino-Alto
Trentino-AltoAdige
Adige
Veneto
Veneto
Friuli-Venezia
Friuli-VeneziaGiulia
Giulia
Liguria
Liguria
Emilia-Romagna
Emilia-Romagna
Toscana
Tuscany
Umbria
Umbria
1993
2000
Marche
Marche
Lazio
Lazio
Abruzzo
Abruzzo
Molise
Molise
Campania
Campania
Puglia
Puglia
Basilicata
Basilicata
Calabria
Calabria
Sicilia
Sicily
Sardegna
Sardinia
0%
North-West
☺
5%
10%
North-East
☺
15%
Centre
☺
77
20%
25%
30%
South & Islands
☺
35%
Italy
☺
BIODIVERSITY
33. Agri-environmental measures
Agri-environmental measures are one possible response for improving the impact of agriculture
on the environment. They increase environmental value of agricultural areas, with positive effects
for conservation of biodiversity.
The regulation governing agri-environmental measures (EEC Reg. 2078/92), replaced by measure F in the Rural Development Programmes (EEC Reg. 1257/99), aims on the one hand to limit
the risks of pollution from agriculture by encouraging less intensive production; on the other hand,
it seeks to provide incentives for creating positive external effects, like protecting biodiversity and
improving landscape.
The adoption of agri-environmental measures has increased considerably. In 2000, the areas
affected had reached 2,748,914 hectares, or 21% of national UAA. At the same time, the number
of recipients rose over the period of analysis from 14,000 to 194,000. The greatest increases in
UAA affected by agri-environmental measures occurred in the South and Islands, with an annual
rate of variation above the national average, equal to 91%; next came the regions of the NorthWest (80%), the Centre (77%) and the North-East (36%). Regionally speaking, the greatest average annual increases occurred in Campania, Liguria and Sardinia, whereas Valle d’Aosta and
Trentino Alto Adige had the greatest amount of UAA.
Share of UAA affected by agri-environmental measures (1994=100)
10000
Quota di SAU interessata da misure agroambientali (1994=100)
9100
8200
7300
6400
5500
4600
3700
2800
1900
1000
100
1994
Italy
1993
1994
1995
1995
1996
North-West
Italia
Nord-ovest
1996
1997
1997
North-East
Nord-est
78
1998
1998
Centre
Centro
1999
2000
1999
2000
South&Islands
Sud e isole
2001
Quota di SAU interessata da misure agroambientali
BIODIVERSITY
Share of UAA affected by agri-environmental measures
Piemonte
Piemonte
Valle d'Aosta
d’Aosta
Lombardia
Lombardy
Trentino
- Alto Adige
Trentino-Alto
Adige
Veneto
Veneto
Friuli
- Venezia Giulia
Friuli-Venezia
Giulia
Liguria
Liguria
Emilia
- Romagna
Emilia-Romagna
Toscana
Tuscany
1994
2000
Umbria
Umbria
Marche
Marche
Lazio
Lazio
Abruzzo
Abruzzo
Molise
Molise
Campania
Campania
Puglia
Puglia
Basilicata
Basilicata
Calabria
Calabria
Sicilia
Sicily
Sardegna
Sardinia
0%
North-West
☺
10%
North-East
☺
20%
30%
Centre
☺
79
40%
50%
South & Islands
☺
60%
Italy
☺
70%
LANDSCAPE
34. Utilised Agricultural Area
Variations on the impact of UAA on Italian territory involve changes to the landscape, agriculture
being the main user of land. This indicator refers to the structure of landscape and concerns the
portion of land utilised for agriculture.
Between 1982 and 2000, the amount of UAA in Italy dropped by 16.6%, from 53% to 44% of
national territory. By geographical area, the smallest decrease was in the North-East (-8.7%),
whereas the greatest drop was in the regions of the South and Islands (-21.5%), though these
regions retain the largest amount of land occupied by UAA. The regions with the highest percentages of UAA per total area are Puglia (65%), Basilicata (54%), Marche (52%) and Emilia Romagna (50%), while the lowest percentages were in the North: Liguria (12%) and Valle d’Aosta
(22%).
Superficie Agricola Utilizzata (1982=100)
Utilised Agricultural Area (1982=100)
100
95
90
85
80
75
1993
1982
ItalyItalia
1994
1995
1996
1990 1997
North-West
Nord-ovest North-East
Nord-est
80
1998
Centre
Centro
1999
2000
2000
2001
South&Islands
Sud e isole
LANDSCAPE
Superficie
Agricola
Utilizzata
Utilised
Agricultural
Area
Piemonte
Piemonte
Valle
Valle d'Aosta
d’Aosta
Lombardia
Lombardy
Trentino-Alto
Trentino-Alto Adige
Adige
Veneto
Veneto
Friuli-Venezia
Friuli-Venezia Giulia
Giulia
Liguria
Liguria
Emilia-Romagna
Emilia-Romagna
Toscana
Tuscany
1982
2000
Umbria
Umbria
Marche
Marche
Lazio
Lazio
Abruzzo
Abruzzo
Molise
Molise
Campania
Campania
Puglia
Puglia
Basilicata
Basilicata
Calabria
Calabria
Sicilia
Sicily
Sardegna
Sardinia
0%
North-West
L
10%
20%
North-East
L
30%
40%
Centre
L
81
50%
60%
South & Islands
L
70%
80%
Italy
L
LANDSCAPE
35. Afforestation index
Forests play a major role in biodiversity conservation and hydro-geological protection, and thus in
defining certain environmental conditions that contribute to the makeup of the landscape. They
are therefore one of the basic elements of landscape structure, and important for the development of economic, tourist-recreational and residential activities.
Wooded land in Italy amounts to 6,853,808 hectares, located mainly in the regions of the North,
especially Tuscany, Piemonte and Trentino Alto Adige. The afforestation index is 22.7%, a lower
figure than the European average, despite the fact that Italy is made up mostly of mountains and
hills. The highest values are for Liguria, Trentino Alto Adige and Tuscany. From 1960 to 2000,
wooded land increased by over a million hectares, thanks to replanting, and also to the natural
afforestation of abandoned agricultural land. The greatest increases were in the South and
Islands (30%), especially Sicily, Sardinia and Puglia, with an annual variation of 0.87%. The
breakdown by type of timber shows a prevalence of coppice (52.8% of total wooded land), followed by high timber (43.3%) and Mediterranean scrub (3.9%).
Afforestation index (1960=100)
Indice di boscosità (1960=100)
140
130
120
110
100
90
1960
1993
Italia
Italy
1970
1994
1995
Nord-ovest
North-West
1980 1997
1996
Nord-est
North-East
82
199819901999
Centre
Centro
2000 2000
2001
Sud e isole
South&Islands
LANDSCAPE
Afforestation index
Indice di boscosità
Piemonte
Piemonte
Valled’Aosta
d'Aosta
Valle
Lombardia
Lombardy
Trentino
- AltoAdige
Adige
Trentino-Alto
Veneto
Veneto
Friuli
- Venezia Giulia
Giulia
Friuli-Venezia
Liguria
Liguria
Emilia
- Romagna
Emilia-Romagna
Toscana
Tuscany
Umbria
Umbria
1960
Marche
Marche
2000
Lazio
Lazio
Abruzzo
Abruzzo
Molise
Molise
Campania
Campania
Puglia
Puglia
Basilicata
Basilicata
Calabria
Calabria
Sicily
Sicilia
Sardinia
Sardegna
0
North-West
☺
10
North-East
☺
20
30
Centre
☺
83
40
South & Islands
☺
50
60
Italy
☺
BIODIVERSITY
36. Intensification
Management methods in agriculture influence the characteristics of agri-ecosystems, and thus
of the agrarian landscape. This indicator can be used to monitor the evolution of the agrarian
landscape in connection with forms of intensive agriculture, a farm management method that
involves high inputs per land unit and farming practices that may cause negative environmental
effects. The indicator may also be used to gather information on the extent of soil exploitation.
From 1982 to 2000, the process of intensification slowed, with a reduction of 14% in UAA devoted
to intensive crops. Figures higher than the national average (12.5%) were recorded in the NorthEast and the South and Islands. For the regions, the greatest yearly rates of reduction occurred in
Liguria, Tuscany and Sardinia, whereas the largest areas of intensive farming were in Campania
and Sicily.
Intensification (1982=100)
Intensificazione (1982=100)
100
90
80
70
1982
1993
ItalyItalia
1994
1995
1990 1997
1996
1998
1999 2000
2000
2001
Nord-ovest North-East
Nord-est CentreCentro South&Islands
Sud e isole
North-West
84
LANDSCAPE
Intensificazione
Intensification
Piemonte
Piemonte
Valle d’Aosta
d'Aosta
Valle
Lombardia
Lombardy
Trentino-Alto Adige
Adige
Trentino-Alto
Veneto
Veneto
Friuli-Venezia Giulia
Friuli-Venezia
Liguria
Emilia-Romagna
Emilia-Romagna
Toscana
Tuscany
Umbria
Umbria
1982
2000
Marche
Marche
Lazio
Abruzzo
Abruzzo
Molise
Molise
Campania
Campania
Puglia
Basilicata
Basilicata
Calabria
Calabria
Sicily
Sicilia
Sardinia
Sardegna
0
North-West
☺
10
North-East
☺
20
Centre
☺
85
South & Islands
☺
30
Italy
☺
LANDSCAPE
37. Concentration
The various setups of agricultural structure affect the shape of the landscape. Concentration of
production refers to the decline in number of farms, a phenomenon often accompanied on the
one hand by an increase in average size, and on the other by a decline in the number of small
farms, resulting in the abandonment of the countryside and loss of agrarian landscape.
The number of farms dropped between 1982 and 2000 by nearly 700,000, or more than 20%.
This decline mainly affected smaller farms (< 5 ha), which dropped at an average annual rate of
10% compared to larger farms (> 50 ha). The phenomenon especially affected the North-West
and North-East; in the Centre, the value of the indicator was reduced at a much more modest
rate; contrarily, in the South and Islands it increased, with the highest percentages in Sardinia,
Puglia and Basilicata.
Concentration (1982=100)
Concentrazione (1982=100)
120
90
60
30
1982
1993
Italia
Italy
1994
1995
Nord-ovest
North-West
1990
1996
Nord-est
North-East
86
1997
1998
Centro
Centre
2000
1999
2000
Sud e isole
South&Islands
2001
Concentrazione
BIODIVERSITY
Concentration
Piemonte
Piemonte
Valled’Aosta
d'Aosta
Valle
Lombardia
Lombardy
Trentino-AltoAdige
Adige
Trentino-Alto
Veneto
Veneto
Friuli-VeneziaGiulia
Giulia
Friuli-Venezia
Liguria
Liguria
Emilia-Romagna
Emilia-Romagna
Toscana
Tuscany
Umbria
Umbria
1982
2000
Marche
Marche
Lazio
Lazio
Abruzzo
Abruzzo
Molise
Molise
Campania
Campania
Puglia
Puglia
Basilicata
Basilicata
Calabria
Calabria
Sicilia
Sicily
Sardegna
Sardinia
0
North-West
L
100
200
North-East
L
300
400
Centre
L
87
500
600
700
South & Islands
☺
800
Italy
900
L
BIODIVERSITY
38. Man-made and natural elements
Natural elements, like rows of trees, hedgerows, groves and thickets, and man-made elements
like ditches and turning spaces, contribute to the diversity of the landscape, and in some cases to
its cultural identity. Little wooded formations (groves, thickets), rows of trees and hedgerows also
play a role in conserving biodiversity.
In 1998, there were approximately 28 metres of ditches and turning spaces per surface unit, and
8 metres of rows of trees and hedgerows. Rows of trees and hedgerows were denser than average in the North-West (approximately 15 m/ha) and North-East (10 m/ha), especially in Lombardy, Veneto and Friuli Venezia Giulia; ditches and turning spaces were prevalent in the NorthEast. Small wooded areas were found mainly in the North-East (17 sq.m./ha) and Centre (16
sq.m./ha), with the largest expanses in Veneto, Marche and Tuscany.
Man-made and natural elements
Manufatti ed elementi di naturalità
80
70
60
50
40
30
20
10
0
Italy
North-West
Rows of trees,
hedgerows (m/ha)
North-East
Groves, thickets
(sq.m./ha)
88
Centre
South&Islands
Ditches, turning
spaces (m/ha)
BIODIVERSITY
Man-made and natural elements
Manufatti ed elementi di naturalità
Piemonte
Piemonte
Valle
Valle d’Aosta
d'Aosta
Lombardy
Lombardia
Trentino-Alto Adige
Trentino-Alto
Veneto
Veneto
Friuli-Venezia
Friuli-Venezia Giulia
Giulia
Liguria
Liguria
Emilia-Romagna
Emilia-Romagna
Toscana
Tuscany
Umbria
Umbria
Marche
Marche
Lazio
Lazio
Abruzzo
Abruzzo
Molise
Molise
Campania
Campania
Puglia
Puglia
Basilicata
Basilicata
Calabria
Calabria
Sicilia
Sicily
Sardegna
Sardinia
0
10
Rows of trees,
hedgerows (m/ha)
North-West
☺
20
North-East
☺
30
40
Groves, thickets
(sq.m./ha)
Centre
☺
89
50
60
70
80
Ditches, turning spaces
(m/ha)
South & Islands
L
Italy
☺
90
APPENDIX 1
TABLES
92
1991
6,70
9,43
3,11
10,54
7,29
5,46
4,43
8,77
5,31
8,81
9,73
4,56
11,63
19,66
11,98
16,34
20,21
19,09
14,14
14,31
8,44
4,31
7,96
5,84
14,57
1992
6,44
9,43
3,00
9,79
6,47
4,89
3,72
8,54
4,58
8,04
8,98
4,58
10,17
21,49
11,34
15,92
18,13
20,44
14,68
13,52
8,15
4,10
7,41
5,44
14,41
1993
6,58
9,62
2,61
8,42
6,07
4,19
3,19
7,62
4,15
7,54
8,85
4,09
9,28
20,35
10,48
14,67
17,03
17,06
13,52
12,25
7,39
3,85
6,69
5,03
13,11
1994
6,16
7,84
3,05
8,53
6,50
4,63
3,87
8,68
4,84
7,43
8,45
4,82
9,91
20,56
11,44
15,36
17,98
17,14
13,50
12,70
7,81
4,05
7,33
5,52
13,60
87
Source: INEA calculations using ISTAT figures, Forze di lavoro, various Year.
Source: INEA calculations using ISTAT figures, Forze di lavoro, various years.
Piemonte
Valle d'Aosta
Lombardy
Trentino-Alto Adige
Veneto
Friuli-Venezia Giulia
Liguria
Emilia-Romagna
Tuscany
Umbria
Marche
Lazio
Abruzzo
Molise
Campania
Puglia
Basilicata
Calabria
Sicily
Sardinia
Italy
- North-West
- North-East
- Centre
- South & Islands
Region
1995
5,23
7,84
3,28
9,35
5,88
5,19
4,18
8,49
4,48
7,07
7,65
4,50
8,37
16,98
11,30
14,04
16,76
16,79
13,14
12,91
7,44
3,95
7,13
5,12
12,98
Year
Tab.
Tab.1 1- Agricultural
- Occupazioneemployment
agricola
Percentage
share oftrapeople
employed
in agriculture
in total
employed
Rapporto percentuale
gli occupati
in agricoltura
e il totale degli
occupati
1996
4,99
9,80
2,94
10,13
5,42
4,48
4,32
7,46
3,82
6,71
7,18
4,46
8,67
17,14
10,72
13,28
15,70
15,88
12,31
12,27
6,97
3,71
6,53
4,80
12,32
1997
5,14
7,69
2,78
9,80
5,41
4,93
3,99
7,14
4,21
6,67
6,91
4,40
8,07
16,04
10,58
12,87
15,20
14,78
12,14
12,40
6,83
3,60
6,42
4,86
11,98
1998
4,09
5,77
2,20
9,23
4,63
4,48
3,25
6,81
3,82
6,27
5,30
3,17
7,00
13,21
8,91
12,37
15,34
12,57
10,32
9,65
5,88
2,86
5,87
3,91
10,45
1999
3,77
5,77
2,09
8,85
4,61
4,01
3,41
6,71
3,16
5,10
4,81
3,08
6,65
12,26
7,81
11,41
13,97
12,24
9,73
8,75
5,48
2,71
5,74
3,50
9,65
2000
3,84
6,16
2,07
8,81
4,52
2,83
3,26
5,90
3,77
4,51
4,12
3,19
5,44
11,46
6,98
11,54
11,27
11,89
9,98
9,16
5,31
2,71
5,26
3,61
9,34
R of I
1991-2000
-5,43
-4,18
-3,98
-1,78
-4,68
-6,38
-3,02
-3,89
-3,36
-6,46
-8,24
-3,52
-7,31
-5,25
-5,26
-3,42
-5,67
-4,63
-3,43
-4,36
-4,53
-4,53
-4,05
-4,68
-4,36
88
93
1993
36,90
26,45
34,17
26,65
34,89
31,97
31,77
39,56
37,51
41,39
36,30
30,64
38,97
33,34
36,18
32,09
35,00
32,56
31,84
37,41
34,36
35,08
35,10
34,75
33,85
1995
33,51
34,95
31,11
24,93
35,13
34,52
35,14
37,94
37,65
40,46
38,41
35,40
36,80
37,39
38,21
35,79
38,41
33,54
44,51
36,95
36,93
32,92
34,80
37,13
38,43
1996
35,55
31,43
27,70
28,32
39,14
21,35
47,80
35,22
38,04
43,05
40,39
38,90
40,01
32,20
41,29
33,44
43,57
32,19
39,56
49,02
37,39
34,31
34,82
39,39
38,28
1997
37,16
35,78
37,10
27,21
39,09
33,22
21,42
41,00
38,19
46,15
44,68
41,27
40,67
44,65
37,42
33,80
40,84
41,36
43,43
32,09
38,69
35,01
37,57
41,73
38,88
Year
1998
36,77
26,14
36,55
22,94
41,56
40,43
33,34
40,84
43,21
43,85
44,20
41,96
43,52
40,59
39,19
37,55
42,43
43,29
46,89
34,66
40,69
35,94
39,01
42,89
41,54
1999
35,32
33,64
34,59
27,04
41,25
31,69
31,39
40,83
40,64
47,81
42,62
42,50
42,85
37,86
38,71
39,02
41,06
43,05
45,06
35,21
40,18
34,46
38,29
42,71
41,15
2000
38,07
34,13
32,63
29,07
39,57
39,03
42,47
42,16
42,46
43,08
45,02
36,60
39,69
37,32
36,99
35,12
38,14
38,58
41,12
36,60
38,41
37,12
38,62
40,25
37,98
R of I
1993-2000
0,45
3,71
-0,65
1,25
1,81
2,89
4,23
0,91
1,79
0,57
3,13
2,57
0,26
1,63
0,31
1,29
1,24
2,46
3,72
-0,31
1,60
0,81
1,37
2,12
1,66
Fonte: elaborazioni INEA su dati ISTAT, Struttura e produzioni delle aziende agricole, Year vari; Censimento generale dell’agricoltura, 2003
Source: INEA calculations using ISTAT figures, Struttura e produzioni delle aziende agricole, various years; Censimento generale dell'agricoltura, 2003.
Piemonte
Valle d'Aosta
Lombardy
Trentino-Alto Adige
Veneto
Friuli-Venezia Giulia
Liguria
Emilia-Romagna
Tuscany
Umbria
Marche
Lazio
Abruzzo
Molise
Campania
Puglia
Basilicata
Calabria
Sicily
Sardinia
Italy
- North-West
- North-East
- Centre
- South & Islands
Region
Tab.22- -Ageing
Indice index
di inv ecchiamento
Tab.
for farmers
Rapporto
tra i conduttori
con in
etàtotal
> 65farmers
Year e il totale degli conduttori agricoli
Percentagepercentuale
share of farmers
aged 65agricoli
and over
94
3,87
3,93
3,00
2,05
1,36
1,64
1,69
2,88
1,62
2,18
3,52
1,67
2,33
Tuscany
Umbria
Marche
Lazio
Abruzzo
Molise
Campania
Puglia
Basilicata
Calabria
Sicily
Sardinia
Italy
5,87
8,22
6,11
7,08
6,48
5,01
7,15
5,38
5,05
6,52
4,75
4,55
5,03
7,55
7,02
10,03
9,27
7,99
8,03
5,38
4,98
6,36
7,35
5,90
6,60
High School
16,05
16,34
15,33
16,15
15,99
17,65
16,03
16,03
11,33
16,97
17,05
12,29
13,93
18,55
12,55
16,52
14,76
14,68
16,77
15,79
14,09
20,92
16,17
16,69
15,88
Middle School
49,84
58,59
67,54
70,56
57,04
52,74
48,59
43,54
48,62
51,80
49,73
53,75
57,29
56,74
61,84
55,28
61,15
60,92
66,92
71,22
70,12
70,68
70,80
73,44
71,61
Elementary
School
25,79
13,93
9,29
4,37
18,15
22,92
24,71
32,87
33,38
21,82
26,77
27,76
22,39
15,11
15,59
14,24
10,95
13,51
6,22
6,72
9,55
0,65
3,64
3,33
4,22
No certificate
2,77
3,08
1,71
1,18
2,45
1,02
4,12
2,21
1,15
3,76
1,66
2,31
1,80
2,34
2,50
4,47
4,02
3,14
1,27
1,19
1,13
0,60
1,78
0,07
0,81
University
6,71
9,21
7,62
8,09
7,45
5,54
7,81
7,58
5,23
7,38
4,78
4,32
7,31
9,11
8,20
10,31
9,52
10,59
7,47
3,76
5,77
10,83
8,41
8,45
8,01
High School
21,10
21,08
23,38
24,53
21,90
22,04
24,02
20,97
23,24
20,26
20,08
13,59
16,38
23,12
17,75
20,51
20,14
19,32
22,43
26,49
23,23
32,26
24,71
35,06
24,43
Middle School
1995
Year
89
Source: INEA calculations using ISTAT figures, Struttura e produzioni delle aziende agricole, various years.
2,45
2,89
Emilia-Romagna
- South & Islands
2,06
Liguria
2,91
0,89
Friuli-Venezia Giulia
- Centre
1,27
Veneto
1,73
1,39
Trentino-Alto Adige
- North-East
2,04
Lombardy
1,85
0,63
- North-West
1,69
Valle d'Aosta
University
Piemonte
Region
1990
Tab. 33 -- Educational
Livello di istruzione
conduttori agricoli
Tab.
level ofdei
farmers
Ripartizione
percentuale
dei
conduttori
secondo
il livelloofdi education
istruzione
Percentage breakdown of agricoli
farmers
by level
50,70
56,51
62,32
64,12
55,30
56,67
42,95
47,98
46,36
52,79
56,01
60,08
56,54
53,83
64,71
49,56
58,67
62,02
66,86
64,64
63,51
55,85
63,01
56,14
64,57
Elementary
School
18,72
10,12
4,97
2,08
12,91
14,73
21,10
21,27
24,01
15,81
17,46
19,69
17,96
11,60
6,83
15,15
7,64
4,93
1,97
3,91
6,36
0,46
2,08
0,28
2,18
No certificate
2,59
3,39
2,39
3,34
2,78
1,77
3,32
2,38
1,70
3,32
1,63
1,54
1,90
2,40
4,70
5,29
3,37
4,06
0,90
2,09
1,39
2,26
5,35
1,42
2,49
University
8,16
10,86
8,92
11,49
9,13
9,38
8,18
6,93
5,65
8,82
8,34
7,55
8,61
8,56
10,79
13,28
14,17
10,53
19,70
3,42
8,11
13,74
11,65
8,46
9,19
High School
1997
21,28
21,99
22,87
23,10
21,88
24,40
25,11
15,68
16,29
21,35
20,86
14,38
21,10
24,43
14,03
22,77
23,02
21,15
25,72
24,48
21,89
29,49
21,12
22,03
24,05
Middle School
51,55
56,06
62,66
58,75
55,03
50,50
47,63
53,38
55,22
53,11
51,80
61,46
51,24
57,50
61,59
48,53
52,67
60,19
52,95
69,15
64,88
53,46
60,99
67,97
58,02
Elementary
School
(continued)
16,41
7,71
3,17
1,78
11,01
13,94
15,75
21,63
21,14
13,40
17,37
15,07
17,15
7,11
8,89
10,13
6,76
4,07
0,72
0,87
3,74
1,06
0,89
0,12
2,91
No certificate
95
1,70
2,46
4,32
2,12
2,76
Basilicata
Calabria
Sicily
Sardinia
Italy
8,38
12,99
10,11
10,29
8,87
9,52
6,10
6,82
9,44
9,51
8,10
7,57
8,27
4,99
13,82
11,88
10,72
6,30
15,54
13,41
7,73
10,76
15,13
12,09
12,61
High School
21,02
25,95
24,33
22,85
27,21
22,46
19,17
17,17
21,90
20,55
21,64
23,51
18,89
22,19
25,12
16,24
26,46
29,04
25,45
36,52
22,55
21,59
24,98
23,32
25,58
50,78
56,56
59,09
57,16
48,12
53,93
50,01
49,89
47,26
53,14
53,87
59,89
52,50
50,59
47,77
59,76
58,02
63,64
54,99
46,72
62,76
58,18
54,43
58,79
54,45
16,91
2,28
4,16
6,58
13,68
11,32
23,03
23,65
17,09
14,71
13,44
6,86
18,03
19,90
9,01
8,24
1,06
1,20
4,85
8,49
4,02
2,62
3,54
2,91
3,09
2,59
2,27
3,47
2,06
2,96
1,53
3,17
4,11
2,85
3,06
2,82
1,98
3,71
6,01
3,46
2,77
1,02
2,97
2,08
2,00
1,45
1,25
3,05
3,46
University
High School
8,95
9,60
10,59
10,96
9,58
9,74
9,30
8,57
9,45
8,24
8,78
8,78
9,25
8,17
14,39
11,01
8,59
12,00
11,55
10,90
8,57
12,03
13,93
12,88
13,42
89
21,13
27,71
26,85
22,57
28,91
23,21
20,50
17,41
19,48
20,92
23,24
22,94
20,35
21,05
21,95
19,57
28,85
17,43
28,46
41,41
25,00
26,85
32,40
23,89
24,48
1999
No
certificate
Middle
School
Elementary
School
Middle
School
Source: INEA calculations using ISTAT figures, Struttura e produzioni delle aziende agricole, various years.
2,91
2,09
2,94
Campania
Puglia
- South & Islands
2,18
2,31
2,34
Lazio
Abruzzo
Molise
2,21
2,31
3,13
4,27
3,89
Umbria
Marche
- North-West
- North-East
- Centre
1,89
1,02
2,96
2,15
2,11
0,98
1,44
3,18
3,83
University
Piemonte
Valle d'Aosta
Lombardy
Trentino-Alto Adige
Veneto
Friuli-Venezia Giulia
Liguria
Emilia-Romagna
Tuscany
Region
1998
Year
Tab. 3 - Educational level of farmers (continued)
Ripartizione breakdown
percentuale dei
agricoli
il livello di istruzione
Percentage
of conduttori
farmers by
level secondo
of education
51,74
54,95
55,95
55,44
45,62
53,52
50,83
49,15
51,18
55,01
52,84
55,79
54,86
48,39
51,21
58,11
57,47
69,35
54,44
45,60
58,59
54,57
49,76
56,64
54,79
Elementary
School
15,09
5,13
4,34
7,57
13,84
10,57
17,83
21,70
15,78
12,98
12,08
9,67
13,57
18,68
6,45
7,85
2,32
0,19
2,58
0,01
5,85
5,11
2,66
3,54
3,85
No
certificate
90
96
3,77
2,35
0,20
3,17
-0,85
0,40
3,05
-0,52
0,10
7,65
9,91
2,35
1,42
2,98
Umbria
Marche
Lazio
Abruzzo
Molise
Campania
Puglia
Basilicata
Calabria
Sicily
Sardinia
Italy
- North-West
- North-East
1,28
3,16
9,07
2,15
1,34
2,66
-0,52
-0,94
8,19
-0,23
2,47
2,81
0,00
2,89
2,20
0,51
2,88
1,49
0,81
2,19
1,62
1,29
1,89
1,43
5,15
1992
1,46
2,94
7,83
2,03
1,31
2,34
-1,65
-0,68
7,46
-0,38
3,33
1,58
0,88
2,95
2,12
1,19
2,62
1,55
0,84
1,83
1,24
1,46
1,92
1,30
4,21
1993
1,49
3,30
7,86
2,12
1,17
2,44
-1,12
0,88
8,07
-0,32
3,58
2,07
0,00
3,38
1,98
0,99
2,69
1,10
0,35
2,21
1,56
1,42
3,92
1,14
3,88
1994
Source: INEA calculations using ISTAT figures, Annuario statistico italiano, various Year.
Source: INEA calculations using ISTAT figures, Annuario statistico italiano, various years.
1,34
3,50
3,40
1,68
0,63
2,24
1,96
Veneto
Friuli-Venezia Giulia
Liguria
Emilia-Romagna
Tuscany
- Centre
- South & Islands
1,27
1,89
1,61
5,91
1991
Piemonte
Valle d'Aosta
Lombardy
Trentino-Alto Adige
Region
1,44
3,39
7,99
2,10
1,14
2,36
0,58
1,09
7,85
0,27
3,05
1,58
0,00
2,36
1,96
1,28
2,22
1,30
1,05
2,39
1,25
1,19
3,92
1,09
4,16
1995
Year
Tab.44- -Breakdown
Composizione
degli occupati
in agricoltura
Tab.
of workers
in agriculture
Differenza
tra
tasso
di
occupazione
maschile
e tasso
occupazione femminile
Difference between employment rates
for men
anddi women
1,38
3,52
7,36
2,13
1,18
2,33
1,74
1,89
8,57
-0,07
3,14
1,11
0,00
2,01
1,58
1,38
2,35
1,49
1,21
2,01
1,18
0,76
1,96
1,36
4,56
1996
1,49
3,73
8,33
2,18
1,07
2,34
1,17
2,11
8,28
0,27
3,64
0,90
0,94
2,00
1,95
1,32
2,38
1,50
0,87
1,95
1,40
0,89
0,00
1,20
4,77
1997
1,17
3,51
6,50
2,06
1,15
2,21
1,70
2,59
7,46
0,06
4,07
1,58
0,00
2,31
1,41
0,80
2,15
1,49
0,85
2,00
1,32
1,24
1,92
1,14
4,24
1998
1,25
3,49
6,42
2,03
1,07
2,19
0,56
2,45
7,01
0,06
4,60
1,61
0,94
1,91
1,72
1,17
2,28
1,48
0,68
1,78
1,01
1,22
1,92
1,04
4,42
1999
1,31
3,44
6,71
1,98
1,05
1,98
0,79
2,20
6,93
0,46
4,04
1,22
0,58
2,07
1,77
1,02
2,00
0,89
0,97
1,82
1,35
1,10
1,89
1,04
3,87
2000
Variation
-2,22
-1,51
-32,24
-15,64
-25,65
-33,45
-253,42
2.099,78
-9,39
16,88
32,47
-61,66
-168,06
-45,23
-24,76
402,67
-41,36
-47,19
53,04
-18,49
-31,01
-14,01
0,21
-35,49
-34,48
1991/2000
97
1991
20,77
48,72
7,97
50,93
15,87
17,90
14,83
26,00
17,66
40,44
25,51
13,02
42,17
63,25
25,86
59,18
75,49
53,74
45,85
48,65
27,30
26,22
13,64
12,54
56,87
1992
20,85
49,00
7,97
51,06
15,86
17,92
15,03
26,02
17,72
40,43
25,45
13,07
42,11
63,03
25,90
59,29
75,41
53,70
45,88
48,63
27,34
26,29
13,64
12,55
57,00
1993
20,90
49,68
7,97
51,08
15,83
17,89
15,12
26,08
17,78
40,43
25,37
13,24
41,99
62,80
25,88
59,41
75,34
53,64
45,83
48,59
27,38
26,30
13,64
12,61
57,07
1994
20,97
49,98
7,97
51,18
15,81
17,86
15,12
26,13
17,85
40,39
25,33
13,32
41,89
62,45
25,82
59,48
75,19
53,69
45,42
48,51
27,37
26,30
13,63
12,61
57,13
1995
21,03
50,16
8,11
51,30
15,81
17,81
15,17
26,16
17,89
40,25
25,29
13,36
41,79
62,28
25,86
59,52
75,03
53,66
45,34
48,47
27,40
26,50
13,65
12,61
57,17
Year
1996
21,04
50,46
8,11
51,37
15,76
17,80
15,23
26,16
17,89
40,15
25,24
13,39
41,71
62,23
25,85
59,55
74,92
53,57
45,31
48,23
27,38
26,53
13,64
12,62
57,11
1997
21,09
50,65
8,10
51,44
15,74
17,76
15,30
26,16
17,88
40,11
25,18
13,35
41,59
62,09
25,84
59,63
74,40
53,48
45,21
48,21
27,35
26,52
13,65
12,60
57,07
1998
21,09
50,89
8,09
51,46
15,71
17,71
15,37
26,15
17,88
40,11
25,15
13,37
41,52
61,95
25,86
59,69
74,30
53,38
45,18
48,23
27,31
26,54
13,67
12,60
56,99
1999
21,13
51,09
8,10
51,46
15,67
17,64
15,43
26,12
17,86
40,06
25,08
13,34
41,45
61,71
25,88
59,71
74,14
53,23
45,15
48,10
27,26
26,61
13,69
12,58
56,86
2000
21,16
51,21
8,08
51,45
15,64
17,58
15,47
26,07
17,87
40,00
25,02
13,32
41,34
61,51
25,86
59,74
74,02
53,07
45,12
48,06
27,20
26,56
13,70
12,60
56,71
2001
21,71
51,41
8,24
51,85
15,73
17,59
15,44
26,27
18,17
40,70
25,04
13,83
41,84
61,86
25,88
60,27
73,72
53,15
45,45
48,43
27,46
27,85
13,89
12,77
56,71
R of I
1991-2001
0,44
0,54
0,33
0,18
-0,09
-0,17
0,40
0,10
0,28
0,06
-0,19
0,61
-0,08
-0,22
0,01
0,18
-0,24
-0,11
-0,09
-0,05
0,06
0,61
0,19
0,18
-0,03
91
Note:
Nota:
(a)
(a)Rural municipalities are defined as those with population density of <100 inhabitants per sq.km., or a percentage share of agricultural employment in total employment of >12.4 (twice the
E' definito rurale il comune che presenta una densità di popolazione < 100 ab. per kmq o una quota di occupati in agricoltura > 12,4 (2 volte la media comunitaria) alla data del Censimento 1991. Il numero
European Community average) reported in the 1991 census. The number of municipalities thus remains the same over the period under consideration.
Source: INEA calculations using ISTAT figures, Movimento anagrafico dei comuni, various years.
Piemonte
Valle d'Aosta
Lombardy
Trentino-Alto Adige
Veneto
Friuli-Venezia Giulia
Liguria
Emilia-Romagna
Tuscany
Umbria
Marche
Lazio
Abruzzo
Molise
Campania
Puglia
Basilicata
Calabria
Sicily
Sardinia
Italy
- North-West
- North-East
- Centre
- South & Islands
Region
Tab.
- Popolazione
residente
neimunicipalities
comuni rurali
Tab.
5 -5Resident
population
in rural
Percentage share of resident population in rural municipalities(a) in total population
92
98
20,24
18,97
18,02
13,71
12,12
15,27
14,98
10,28
15,14
13,13
17,38
23,02
19,49
21,00
13,72
Piemonte
Valle d'Aosta
Lombardy
Trentino-Alto Adige
Veneto
Friuli-Venezia Giulia
Liguria
Emilia-Romagna
Tuscany
Umbria
Marche
Lazio
Abruzzo
Molise
Campania
Puglia
Basilicata
Calabria
Sicily
Sardinia
Italy
- North-West
- North-East
- Centre
- South & Islands
20,10
19,09
17,88
15,53
12,81
16,53
16,35
8,46
15,55
14,74
18,51
24,95
21,62
21,40
14,21
1996
22,21
11,29
26,60
17,62
22,84
25,20
28,97
21,20
24,63
23,75
21,54
19,79
21,01
16,62
12,97
17,36
14,76
12,34
17,90
14,86
19,32
26,27
21,14
21,35
15,66
1997
23,18
10,56
28,27
17,52
23,15
24,52
29,82
19,82
22,16
24,66
Year
24,39
21,43
22,21
17,72
14,52
16,44
19,56
11,27
18,18
16,77
20,39
27,72
23,10
22,99
16,10
1998
24,50
11,33
29,53
19,66
24,70
25,06
32,46
22,41
22,87
26,77
Source: INEA calculations using ISTAT figures, Annuario statistico italiano, various Year.
Source: INEA calculations using ISTAT figures, Conti economici territoriali, various years.
1995
21,02
8,44
23,88
16,60
20,15
22,66
28,67
19,17
23,65
22,86
Region
28,01
23,49
22,65
21,77
16,52
21,34
25,24
14,42
18,42
18,78
22,98
30,25
25,53
26,00
18,66
1999
27,12
13,17
32,41
21,79
27,03
28,86
32,63
24,78
26,65
30,73
27,05
23,10
25,18
22,19
17,61
17,96
22,90
13,15
18,98
17,20
22,60
29,65
26,61
25,13
17,87
2000
25,69
12,78
32,04
21,34
27,08
31,07
34,25
27,06
24,03
33,68
4,95
3,34
5,73
8,35
6,42
2,74
7,33
4,19
3,83
4,60
4,47
4,31
5,33
3,03
4,51
R of I
1995-2000
3,40
7,16
5,02
4,28
5,05
5,40
3,01
5,91
0,27
6,67
Rapporto tra il valore aggiunto dell'agricoltura, silvicoltura e pesca ai prezzi base e le unità di lavoro in agricoltura (000 di eurolire 1995)
Tab. 6 - Profitability of labour
Tab. 6 -Ratio
Redditiv
ità del
lav oro
between
value
added of agriculture, forestry and fishing, at basic prices, to work units in agriculture ('000 eurolira 1995)
99
1,53
0,28
2,12
1,38
2,43
1,59
4,47
2,34
1,24
1,08
1,23
1,64
1,13
0,81
3,38
1,74
0,51
1,15
1,43
0,47
1,58
1,87
2,16
1,34
1,34
1988
1,60
0,30
2,22
1,18
2,45
1,87
5,29
2,30
1,28
1,17
1,32
1,71
1,32
0,80
3,51
1,60
0,42
1,90
1,45
0,39
1,63
1,98
2,14
1,40
1,39
1989
1,63
0,29
2,32
1,39
2,69
1,88
5,66
2,49
1,30
1,20
1,34
1,61
1,18
0,79
3,36
1,36
0,37
0,99
1,32
0,42
1,58
2,05
2,33
1,39
1,20
1990
1,53
0,31
2,43
1,34
2,54
1,83
5,25
2,11
1,30
1,14
1,35
1,67
1,33
0,81
3,43
2,06
0,60
1,87
1,82
0,54
1,73
2,03
2,10
1,40
1,60
1991
1,61
0,32
2,73
1,55
2,75
2,02
6,28
2,56
1,24
1,15
1,42
1,71
1,33
0,78
3,13
1,91
0,54
1,14
1,72
0,55
1,75
2,25
2,42
1,41
1,45
1992
1,67
0,31
2,79
1,50
2,79
1,89
8,26
2,33
1,23
1,15
1,30
1,75
1,32
0,73
2,98
1,83
0,65
1,92
1,80
0,61
1,78
2,35
2,31
1,39
1,52
1993
1,66
0,37
2,80
1,70
2,79
2,02
8,57
2,34
1,31
1,13
1,39
1,82
1,41
0,69
2,91
2,10
0,73
1,34
1,62
0,67
1,79
2,36
2,36
1,45
1,50
Year
1994
1,73
0,34
2,77
1,44
2,73
1,98
7,86
2,24
1,35
1,14
1,24
1,83
1,35
0,78
3,03
1,87
0,69
1,91
1,53
0,56
1,76
2,37
2,25
1,43
1,47
1995
1,80
0,46
3,09
1,67
3,02
2,03
7,01
2,31
1,30
1,21
1,19
1,74
1,35
0,87
2,92
1,88
0,70
1,42
1,53
0,65
1,79
2,54
2,41
1,39
1,44
1996
1,71
0,43
3,12
1,55
3,05
1,90
7,28
2,08
1,24
1,15
1,10
1,70
1,47
0,85
2,93
1,88
0,61
2,02
1,71
0,69
1,80
2,50
2,29
1,33
1,55
1997
1,69
0,43
3,10
1,62
2,98
1,87
7,06
2,29
1,24
1,29
1,16
1,78
1,43
0,79
3,14
1,75
0,80
1,75
1,63
0,67
1,80
2,49
2,37
1,38
1,50
1998
1,79
0,46
3,16
1,76
3,15
1,96
7,00
2,41
1,26
1,39
1,17
1,88
1,36
0,85
3,24
2,19
0,97
2,24
1,57
0,69
1,92
2,57
2,50
1,44
1,65
1999
1,82
0,55
3,42
1,71
3,33
2,53
10,45
2,89
1,35
1,48
1,39
2,11
1,69
0,96
3,51
2,26
0,90
2,27
2,10
0,86
2,17
2,76
2,81
1,60
1,90
2000
R of I
1988-2000
1,38
5,42
3,74
1,69
2,44
3,62
6,75
1,63
0,65
2,50
0,94
1,94
3,13
1,32
0,30
2,03
4,48
5,33
2,99
4,67
2,49
3,04
2,04
1,40
2,70
93
Source: INEA calculations using ISTAT figures, Annuario statistico italiano, various Year.
Source: INEA calculations using ISTAT figures, Conti economici territoriali, various years; Censimento generale dell'agricoltura, 1993, 2003; Struttura e produzioni delle aziende agricole,
various years.
Valle d'Aosta
Lombardy
Trentino-Alto Adige
Veneto
Friuli-Venezia Giulia
Liguria
Emilia-Romagna
Tuscany
Umbria
Marche
Lazio
Abruzzo
Molise
Campania
Puglia
Basilicata
Calabria
Sicily
Sardinia
Italy
- North-West
- North-East
- Centre
- South & Islands
Piemonte
Region
Tab. 7 - Profitability of land
Ratiotraof
value
added
of agriculture,
at ebasic
to UAA
Rapporto
il valore
aggiunto
dell'agricoltura
ai prezzi base
la SAU prices,
(000 di eurolire
1995) ('000 eurolira 1995)
100
12,86
14,18
14,27
14,91
11,16
7,64
7,86
12,93
8,97
8,60
12,55
14,80
14,43
Tuscany
Umbria
Marche
Lazio
Abruzzo
Molise
Campania
Puglia
Basilicata
Calabria
Sicily
Sardinia
Italy
11,24
14,23
19,74
20,58
14,88
14,62
12,74
9,07
9,39
12,48
9,24
9,27
13,83
15,79
13,14
16,02
12,88
22,90
10,21
18,36
19,14
11,36
28,58
8,95
16,82
1981
10,88
14,91
21,41
22,08
15,40
15,08
12,54
8,05
8,64
12,15
9,04
9,21
13,33
15,54
14,76
17,60
13,61
25,02
12,31
20,38
19,62
15,58
30,28
9,39
18,08
1982
12,35
15,29
20,00
21,53
15,84
15,40
14,77
10,38
7,89
15,58
9,38
9,96
13,21
16,57
14,93
17,99
13,53
24,38
11,52
18,06
18,18
12,61
29,88
9,54
17,35
1983
Source: INEA calculations using ISTAT figures, Conti economici territoriali, various years.
10,63
21,26
Emilia-Romagna
- South & Islands
11,05
Liguria
13,97
19,28
Friuli-Venezia Giulia
- Centre
19,97
Veneto
19,67
12,44
Trentino-Alto Adige
- North-East
29,34
Lombardy
20,64
9,17
Valle d'Aosta
- North-West
16,34
1980
Piemonte
Region
11,60
14,24
20,37
21,93
15,50
14,50
14,33
7,12
9,45
14,98
9,02
11,56
12,44
15,08
14,74
16,49
12,52
24,48
15,94
19,72
18,67
12,92
30,57
8,65
16,61
1984
12,68
14,37
20,34
23,14
16,11
15,83
15,47
10,18
9,58
16,13
9,32
12,52
12,89
15,47
15,21
17,68
11,94
24,05
13,06
20,33
18,63
14,20
33,23
9,03
17,94
1985
Year
12,56
14,94
21,05
22,75
16,29
15,44
14,98
7,81
11,65
16,45
9,80
12,68
12,98
14,96
16,09
18,15
13,45
25,44
11,89
20,06
18,70
15,59
32,21
8,29
18,11
1986
13,14
16,04
22,14
24,16
17,17
15,36
15,03
10,02
11,06
18,32
10,08
11,93
13,86
16,20
17,27
20,09
14,16
27,06
12,91
20,87
19,55
16,11
33,96
9,36
19,30
1987
Tab.
Productivity
oflav
labour
Tab. 88 -- Produttiv
ità del
oro
Rapporto
tra il valore
della produzione
dell'agricoltura,
caccia
e silvicoltura
e lework
unità units
di lavoro
in agricoltura ('000
(000 dieurolira
eurolire 1995)
Ratio
of value
of production
of agriculture,
hunting
and
forestry to
in agriculture
1995)
13,26
16,00
22,70
24,45
17,36
16,31
14,73
7,41
10,90
21,00
10,71
13,14
12,96
16,70
16,93
20,47
13,60
28,04
13,60
21,45
19,81
16,52
35,09
9,19
18,98
1988
13,67
17,55
24,46
26,73
18,43
14,32
15,48
9,72
9,87
19,28
11,51
14,91
14,48
17,82
19,26
23,64
14,70
29,87
15,90
24,11
21,67
17,01
37,39
9,55
21,11
1989
(continua)
(continued)
12,19
17,27
26,49
27,32
18,10
13,98
14,13
6,45
9,25
16,78
10,65
14,14
13,80
16,82
20,08
23,38
14,59
32,75
15,77
25,14
23,24
19,01
38,96
9,65
21,13
1990
101
19,65
18,22
15,18
15,10
11,03
24,93
13,84
9,69
17,64
16,38
19,28
Marche
Lazio
Abruzzo
Molise
Campania
Puglia
Basilicata
Calabria
Sicily
Sardinia
Italy
14,45
18,88
28,34
30,14
20,17
18,24
16,51
7,06
12,92
23,13
10,69
15,30
15,77
18,70
21,03
24,89
16,17
35,61
18,30
27,14
24,09
21,71
44,17
10,13
1992
22,01
15,68
19,51
29,55
32,16
21,43
20,68
17,57
10,21
14,24
24,63
11,18
14,50
15,77
19,38
21,25
26,71
16,74
35,84
22,59
28,59
26,17
22,67
45,15
10,15
1993
24,15
16,15
20,63
30,95
33,26
22,29
21,75
17,27
8,68
15,56
28,66
11,08
14,50
16,44
20,50
22,86
27,43
17,78
37,01
23,73
30,56
27,07
26,10
46,42
11,53
1994
25,04
18,90
31,26
30,70
38,93
26,17
20,38
19,75
13,73
23,02
20,32
16,78
24,68
25,62
28,45
32,51
35,86
32,63
31,17
33,79
32,30
31,98
23,71
42,81
16,35
1995
35,87
Source: INEA calculations using ISTAT figures, Annuario statistico italiano, various Year.
Source: INEA calculations using ISTAT figures, Conti economici territoriali, various years.
15,25
23,69
Umbria
- South & Islands
15,01
Tuscany
17,86
30,40
Emilia-Romagna
- Centre
14,25
Liguria
24,84
24,28
Friuli-Venezia Giulia
- North-East
21,85
Veneto
26,54
18,60
Trentino-Alto Adige
- North-West
9,22
38,93
Lombardy
1991
19,95
Valle d'Aosta
Piemonte
Region
Year
19,62
32,15
33,38
40,59
27,60
21,54
20,35
12,55
24,72
21,58
17,80
27,07
25,87
28,33
33,33
36,71
34,90
34,33
35,96
34,99
35,23
24,06
44,39
18,94
1996
37,27
20,83
32,24
33,27
42,03
28,41
21,39
22,08
15,92
23,35
22,50
17,74
28,12
29,17
29,06
35,46
38,37
32,20
33,50
36,05
35,38
35,48
24,43
46,66
18,03
1997
37,88
21,43
34,18
35,83
44,16
29,80
25,22
22,52
14,83
28,08
21,55
19,12
29,76
30,38
31,34
39,00
40,00
32,79
36,56
39,10
36,70
37,85
26,76
48,20
19,41
1998
40,49
23,92
37,65
38,63
47,40
32,61
27,68
22,22
18,13
34,16
26,12
21,52
34,92
30,73
33,57
42,33
44,50
37,87
39,35
38,00
40,97
40,37
29,42
52,27
22,29
1999
43,85
23,49
36,88
40,49
46,54
32,58
26,53
23,09
17,11
32,60
23,10
23,04
35,92
34,35
33,33
43,10
48,83
34,27
42,37
40,26
44,77
41,19
29,30
51,20
20,86
2000
42,45
Tab. 8 - Productivity of labour (continued)
Rapporto
tra il valore
della produzione
dell'agricoltura,
cacciaand
e silvicoltura
unità units
di lavoro
agricoltura ('000
(000 dieurolira
eurolire 1995)
Ratio
of value
of production
of agriculture,
hunting
forestry etolework
in in
agriculture
1995)
22,69
34,16
41,59
47,57
32,15
27,11
22,02
17,59
30,63
21,45
22,50
38,17
31,94
29,71
43,00
45,58
31,99
42,83
37,11
44,67
43,20
30,64
52,96
21,60
2001
43,60
3,51
4,15
3,46
3,87
3,71
2,79
2,59
3,30
5,74
2,33
4,90
7,59
4,90
3,18
5,14
5,45
4,23
3,23
5,66
3,89
3,57
4,18
2,72
3,97
R of I
1980-2001
4,56
102
2,11
1,90
2,18
2,73
1,97
1,22
4,23
1,86
0,82
1,81
1,82
0,78
2,51
Tuscany
Umbria
Marche
Lazio
Abruzzo
Molise
Campania
Puglia
Basilicata
Calabria
Sicily
Sardinia
Italy
1,77
2,22
3,92
3,82
2,58
0,77
1,84
1,57
0,72
1,90
4,56
1,47
1,93
2,61
2,24
1,97
1,96
4,19
6,77
3,19
4,65
2,04
4,76
0,60
2,92
1990
Year
2,55
2,41
4,35
4,38
3,19
1,36
2,72
2,99
1,28
2,89
4,65
1,60
2,41
3,10
2,30
2,19
2,00
4,56
12,55
3,90
5,14
2,39
5,51
0,89
3,03
2000
1,96
0,29
0,63
1,27
1,27
2,98
2,14
2,68
2,35
2,36
0,50
1,43
1,07
0,66
0,28
0,75
-0,28
0,50
4,94
1,37
0,68
0,91
1,44
1,80
0,43
R of I
1982-2000
Source: INEA calculations using ISTAT figures, Conti economici territoriali, various years.
1,76
4,15
Emilia-Romagna
- South & Islands
5,02
Liguria
2,28
3,01
Friuli-Venezia Giulia
- Centre
4,52
Veneto
3,85
2,01
Trentino-Alto Adige
3,44
4,20
Lombardy
- North-East
0,64
Valle d'Aosta
- North-West
2,80
1982
Piemonte
Region
Rapporto tra il valore della produzione dell'agricoltura e la SAU (000 di eurol
Tab. 9 - Productivity of land
Ratio of value of agricultural production to UAA ('000 eurolira 1995)
Tab. 9 - Produttiv ità della terra
19 5)
103
1995
55,70
64,66
57,09
49,50
66,38
68,50
50,44
44,04
60,52
70,37
59,12
77,39
65,32
68,69
69,45
65,47
61,86
79,44
65,71
60,68
64,59
55,74
57,67
68,86
67,53
1997
48,47
72,45
51,26
39,18
61,12
64,88
45,17
37,33
53,74
63,95
53,35
74,70
70,23
65,59
66,39
68,86
60,98
68,79
66,09
50,64
61,49
49,75
51,78
64,51
66,11
Year
1998
55,81
75,55
58,65
40,69
71,13
71,30
42,13
41,33
55,84
70,49
59,23
77,74
74,28
67,50
75,20
75,01
60,13
76,51
71,48
50,45
66,96
55,61
58,31
68,33
71,63
1999
42,98
71,26
51,58
29,91
58,53
61,48
37,03
33,54
45,87
67,29
51,50
73,34
65,59
59,30
68,86
66,64
58,80
68,30
64,66
47,07
59,20
46,07
47,62
62,06
64,66
Variation
1995/2000
-22,84
10,22
-9,65
-39,57
-11,83
-10,24
-26,58
-23,85
-24,21
-4,37
-12,89
-5,23
0,42
-13,66
-0,85
1,78
-4,96
-14,02
-1,60
-22,42
-8,34
-17,34
-17,42
-9,87
-4,26
Source: INEA calculations using ISTAT figures, Struttura e produzioni delle aziende agricole, various years.
Piemonte
Valle d'Aosta
Lombardy
Trentino-Alto Adige
Veneto
Friuli-Venezia Giulia
Liguria
Emilia-Romagna
Tuscany
Umbria
Marche
Lazio
Abruzzo
Molise
Campania
Puglia
Basilicata
Calabria
Sicily
Sardinia
Italy
- North-West
- North-East
- Centre
- South & Islands
Region
Rapporto percentuale tra le aziende agricole con SAU<5ha e UDE<4 e il totale delle
Tab. 10 - Marginalisation
share of farms with <5ha UAA and <4 ESU in total farms
Tab. 10 Percentage
- Marginalizzazione
104
82,28
76,76
79,81
62,95
72,78
82,66
86,30
77,09
71,04
73,37
75,04
69,53
72,60
85,05
65,67
65,03
71,48
67,67
82,76
77,33
73,56
81,81
74,19
71,34
72,21
Exclusively
on the farm
1,26
3,77
2,65
6,34
1,59
0,48
1,07
2,89
1,21
1,50
2,37
1,18
3,75
2,91
16,76
2,87
0,93
3,86
2,06
1,09
3,59
1,77
2,40
1,43
5,04
1993
Mainly on
the farm
16,45
19,47
17,54
30,71
25,63
16,87
12,63
20,02
27,75
25,13
22,59
29,29
23,66
12,04
17,57
32,10
27,59
28,47
15,18
21,58
22,84
16,42
23,41
27,23
22,75
Mainly off
the farm
84,97
83,95
82,74
61,03
72,95
80,36
92,65
83,19
72,21
79,65
74,85
68,63
73,72
82,34
83,06
68,03
77,55
68,53
72,39
71,90
74,97
85,14
75,69
71,98
73,38
Exclusively
on the farm
0,88
0,35
1,50
7,34
1,68
0,51
0,66
2,39
2,20
0,60
1,66
1,36
1,70
0,39
1,37
1,09
0,74
2,72
1,39
1,46
1,58
1,05
2,39
1,55
1,45
1995
Mainly on
the farm
95
Fonte: ISTAT, Struttura e produzioni delle aziende agricole, Year vari
Source: ISTAT, Struttura e produzioni delle aziende agricole, various years.
Piemonte
Valle d'Aosta
Lombardy
Trentino-Alto Adige
Veneto
Friuli-Venezia Giulia
Liguria
Emilia-Romagna
Tuscany
Umbria
Marche
Lazio
Abruzzo
Molise
Campania
Puglia
Basilicata
Calabria
Sicily
Sardinia
Italy
- North-West
- North-East
- Centre
- South & Islands
Region
14,14
15,70
15,76
31,63
25,38
19,13
6,68
14,41
25,59
19,75
23,49
30,01
24,57
17,27
15,58
30,88
21,71
28,74
26,22
26,64
23,45
13,81
21,92
26,47
25,17
Mainly off
the farm
80,90
95,30
82,43
71,65
77,70
85,64
92,59
81,00
84,69
82,05
75,08
75,50
80,28
81,83
85,91
67,03
71,04
65,21
70,20
80,08
76,40
83,23
78,90
78,70
73,38
Exclusively
on the farm
2,19
2,17
3,06
5,00
1,22
0,75
2,14
2,07
1,53
3,01
3,46
1,70
0,20
0,87
0,89
1,89
2,26
4,45
2,06
1,73
2,02
2,48
1,87
2,11
1,94
1996
Mainly on
the farm
Year
Tab. 11 - Diversification in farm holders' activities
Percentage
breakdown
farms,
by dedicato
amount
of time alfarm
works on farm
Ripartizione
percentuale
delle aziende of
secondo
il tempo
dal conduttore
lavoroholder
presso l'azienda
16,91
2,54
14,51
23,35
21,08
13,61
5,27
16,93
13,77
14,94
21,46
22,79
19,52
17,30
13,20
31,09
26,70
30,34
27,74
18,19
21,58
14,29
19,23
19,19
24,68
Mainly off
the farm
84,44
82,14
84,92
68,22
76,77
83,46
90,08
82,37
76,90
77,03
74,14
75,48
75,24
81,18
78,17
70,30
78,38
67,54
75,23
76,43
76,32
85,31
78,27
75,75
74,02
Exclusively
on the farm
2,54
2,35
2,66
7,00
1,91
1,76
1,75
2,21
3,90
0,62
2,36
1,31
3,25
1,34
1,95
2,08
1,96
2,62
1,77
1,87
2,21
2,48
2,57
2,04
2,09
1997
Mainly on
the farm
13,02
15,51
12,42
24,78
21,32
14,77
8,17
15,42
19,19
22,35
23,50
23,21
21,50
17,49
19,89
27,62
19,66
29,83
23,00
21,70
21,47
12,22
19,15
22,21
23,89
Mainly off
the farm
80,82
80,82
42,44
68,63
73,70
78,93
75,94
79,97
78,16
65,33
75,48
73,32
72,32
74,89
72,31
66,98
70,14
67,82
70,67
75,63
71,34
69,99
75,64
73,93
70,29
Exclusively
on the farm
6,36
4,30
44,45
7,26
2,48
1,62
8,82
3,47
3,36
2,82
3,34
1,68
2,77
4,50
2,89
4,36
2,86
2,73
2,64
2,60
5,01
15,75
3,26
2,52
3,16
1999
Mainly on
the farm
12,83
14,88
13,11
24,11
23,82
19,45
15,23
16,56
18,48
31,85
21,18
25,00
24,91
20,61
24,81
28,66
27,00
29,45
26,69
21,77
23,65
14,26
21,10
23,56
26,56
Mainly off
the farm
95
105
2,37
4,01
3,89
1,75
4,36
5,16
3,64
7,36
6,49
6,85
5,45
4,61
3,24
Tuscany
Umbria
Marche
Lazio
Abruzzo
Molise
Campania
Puglia
Basilicata
Calabria
Sicily
Sardinia
Italy
5,26
2,25
3,64
2,06
3,22
4,92
5,27
5,81
6,56
7,59
3,52
5,80
4,38
1,63
3,52
4,38
2,28
3,84
2,52
3,10
3,47
4,10
1,79
1,47
2,55
1996
5,22
2,17
3,37
2,03
3,12
5,04
5,58
6,86
5,57
6,97
3,29
5,42
4,56
1,63
3,59
3,62
2,15
3,44
2,35
2,84
3,32
3,84
1,80
1,36
2,47
1997
5,04
2,10
3,30
1,90
3,01
4,98
5,13
5,63
6,90
6,68
3,54
4,69
4,66
1,59
3,38
3,40
2,14
3,48
2,37
2,72
3,23
3,46
1,66
1,33
2,33
Year
1998
Source: INEA calculations using ISTAT figures, Conti economici territoriali, various years.
5,33
3,83
Emilia-Romagna
- South & Islands
2,80
Liguria
2,36
3,07
Friuli-Venezia Giulia
3,52
3,31
Veneto
- Centre
3,69
Trentino-Alto Adige
- North-East
1,75
Lombardy
2,08
1,33
- North-West
2,63
Valle D'Aosta
1995
Piemonte
Region
5,01
2,05
3,27
1,83
2,96
4,60
4,78
6,44
7,29
6,88
3,45
4,75
4,34
1,59
3,14
3,41
2,04
3,46
2,25
2,67
3,15
3,62
1,59
1,32
2,28
1999
4,57
1,91
3,13
1,75
2,76
4,20
4,72
5,66
5,93
5,83
3,27
4,24
4,03
1,58
2,73
3,22
1,80
3,54
2,13
2,51
2,89
3,11
1,59
1,40
2,03
2000
4,41
1,82
3,11
1,76
2,71
4,41
4,49
5,52
5,81
5,35
3,32
4,22
3,80
1,52
2,57
3,01
1,75
3,49
2,04
2,54
2,85
3,29
1,61
1,36
2,02
2001
-2,66
-3,62
-1,75
-2,35
-2,50
-0,64
-2,72
-3,04
-1,55
-4,46
-1,32
-2,83
-1,94
-2,00
-5,78
-3,98
-4,26
-1,29
-4,46
-2,69
-2,09
-1,64
-1,15
0,29
-3,70
R of I
1995-2001
Rapporto percentuale tra il v alore aggiunto dell'agricoltura, silv icoltura e pesca e il v alore aggiunto totale (ai prezzi di base)
Tab. 12 - Share of agricultural value added in total value added
Tab. 12 - Incidenza del valore aggiunto dell'agricoltura sul valore aggiunto totale
Percentage share of value added of agriculture, forestry and fishing in total value added (at basic prices)
95
106
1995
945,12
23,81
941,81
251,41
744,27
158,66
79,59
843,89
328,11
172,86
253,27
357,39
193,77
77,26
459,03
597,49
187,94
164,80
655,18
331,36
7.767,00
1.990,32
1.998,22
1.111,62
2.666,83
1996
883,81
19,73
1.002,65
265,67
854,22
171,67
84,29
877,51
357,23
190,52
274,08
381,66
232,56
78,50
512,48
639,68
230,18
238,19
518,42
501,38
8.314,44
1.990,48
2.169,07
1.203,50
2.951,40
Source: ISTAT, Conti economici territoriali, various years.
Piem onte
Valle d'Aosta
Lombardy
Trentino-Alto Adige
Veneto
Friuli-Venezia Giulia
Liguria
Emilia-Romagna
Tuscany
Umbria
Marche
Lazio
Abruzzo
Molise
Campania
Puglia
Basilicata
Calabria
Sicily
Sardinia
Italy
- North-West
- North-East
- Centre
- South & Islands
Region
1997
893,63
24,53
930,29
263,55
944,13
173,63
80,05
916,71
338,74
168,47
293,50
348,71
234,99
71,68
413,37
608,13
209,89
211,59
512,79
530,19
8.168,59
1.928,50
2.298,03
1.149,43
2.792,64
Year
1998
802,99
20,76
944,75
327,85
842,60
172,14
70,34
1.173,70
425,35
133,81
342,57
321,24
186,03
74,27
529,32
732,54
198,68
193,21
574,20
415,28
8.481,62
1.838,84
2.516,28
1.222,97
2.903,52
1999
926,68
24,33
1.102,43
358,11
887,07
196,82
80,41
1.375,12
417,50
137,84
433,36
292,26
192,69
65,69
507,11
772,52
210,97
214,23
414,30
350,00
8.959,44
2.133,84
2.817,12
1.280,97
2.727,51
Tab.13a
13a- -Fixed
Inv estimenti
fissiin
inagriculture
agricoltura
Tab.
investments
Spesa per investimenti
fissi lordi
in agricoltura
(milioni di eurolire
Expenditures
for gross fixed
investments
in agriculture
(million1995)
eurolira 1995)
2000
931,07
17,82
1.428,42
362,24
1.006,42
212,78
85,06
1.037,98
383,57
132,63
402,06
403,97
222,54
79,95
493,22
957,15
261,74
211,70
537,32
334,97
9.502,60
2.462,36
2.619,42
1.322,23
3.098,59
2001
915,11
14,41
1.430,59
322,63
857,37
209,32
67,35
1.092,82
370,45
136,86
348,92
350,05
161,24
83,15
508,45
1.086,68
262,46
179,00
549,56
248,78
9.195,21
2.427,45
2.482,14
1.206,29
3.079,32
R of I
1995-2001
- 0,46
-6,92
6,15
3,63
2,04
4,04
-2,36
3,76
1,75
-3,28
4,68
-0,30
-2,59
1,05
1,47
8,92
4,89
1,19
-2,48
-4,01
2,44
2,88
3,15
1,17
2,08
95
107
0,24
- South & Islands
0,27
0,29
0,30
0,32
0,29
0,53
0,19
0,25
0,53
0,22
0,26
0,36
0,32
0,26
0,34
0,36
0,27
0,29
0,12
0,26
0,30
0,34
0,29
0,47
1996
0,43
0,24
0,28
0,33
0,30
0,28
0,55
0,18
0,16
0,57
0,21
0,21
0,32
0,30
0,23
0,35
0,33
0,28
0,34
0,12
0,27
0,33
0,36
0,26
0,64
1997
0,43
0,25
0,29
0,34
0,29
0,29
0,41
0,21
0,17
0,39
0,26
0,25
0,35
0,23
0,21
0,40
0,26
0,34
0,39
0,10
0,26
0,29
0,42
0,26
0,53
1998
0,40
Year
Source: INEA calculations using ISTAT figures, Conti economici territoriali, various years.
0,26
0,28
Italy
- Centre
0,39
Sardinia
0,29
0,24
Sicily
0,34
0,13
Calabria
- North-East
0,46
Basilicata
- North-West
0,20
0,30
Marche
Puglia
0,35
Umbria
0,23
0,24
Tuscany
0,40
0,29
Emilia-Romagna
Campania
0,11
Liguria
Molise
0,25
Friuli-Venezia Giulia
0,27
0,28
Veneto
Abruzzo
0,37
Trentino-Alto Adige
0,23
0,30
Lazio
0,74
Lombardy
1995
0,47
Valle d'Aosta
Piemonte
Regioni
0,22
0,29
0,36
0,33
0,29
0,35
0,16
0,15
0,34
0,23
0,23
0,28
0,25
0,18
0,50
0,25
0,32
0,43
0,11
0,28
0,29
0,43
0,30
0,61
1999
0,44
0,27
0,31
0,33
0,39
0,32
0,36
0,19
0,16
0,54
0,32
0,23
0,36
0,30
0,25
0,50
0,23
0,31
0,31
0,12
0,31
0,34
0,46
0,39
0,44
2000
0,47
0,27
0,30
0,31
0,38
0,31
0,25
0,21
0,13
0,60
0,40
0,23
0,37
0,22
0,23
0,44
0,26
0,30
0,32
0,10
0,29
0,28
0,39
0,39
0,36
2001
0,45
1,78
1,86
0,75
1,62
1,54
-6,20
-1,93
-0,33
3,80
10,04
0,37
-0,87
-3,06
0,04
5,59
-4,41
3,49
1,30
-1,38
1,94
-0,19
0,57
3,69
-9,59
-0,55
R of I
1995-2001
Tab. 13b - Share of gross fixed investments in agricultural value added
of gross
fixedinv
investments
in agriculture
frominagriculture,
forestry and fishing (figures at 1995
Tab. 13b -Ratio
Incidenza
degli
estimenti fissi
lordi sultovvalue
alore added
aggiunto
agricoltura
Rapporto tra gli investimenti fissi lordi in agricoltura e il valore aggiunto dell'agricoltura, silvicoltura e pesca (valori a prezzi 19 5)
prices)
108
1970
0,73
0,20
1,31
0,20
1,03
0,50
0,13
0,92
0,29
0,49
0,68
0,36
0,34
0,28
0,45
0,15
0,21
0,22
0,22
0,28
0,49
0,88
0,74
0,42
0,28
1982
0,78
0,20
1,86
0,21
1,42
0,55
0,11
1,04
0,23
0,43
0,43
0,40
0,33
0,33
0,44
0,15
0,21
0,20
0,28
0,31
0,56
1,13
0,90
0,35
0,29
Year
1990
1,17
0,43
2,69
0,56
1,95
1,01
0,35
1,33
0,39
0,70
0,52
0,64
0,46
0,52
0,65
0,16
0,27
0,38
0,42
0,54
0,84
1,81
1,38
0,54
0,40
2000
1,14
0,56
2,87
0,53
1,75
0,93
0,37
1,18
0,29
0,59
0,39
0,56
0,41
0,53
0,76
0,17
0,28
0,33
0,33
0,61
0,82
1,90
1,24
0,43
0,40
R of I
1970-2000
1,45
3,44
2,55
3,16
1,72
2,05
3,28
0,78
0,00
0,59
-1,78
1,41
0,64
2,07
1,69
0,42
1,01
1,33
1,33
2,55
1,67
2,50
1,66
0,09
1,18
Source: INEA calculations using ISTAT figures, Censimento generale dell'agricoltura, various years.
Piemonte
Valle D'Aosta
Lombardy
Trentino-Alto Adige
Veneto
Friuli-Venezia Giulia
Liguria
Emilia-Romagna
Tuscany
Umbria
Marche
Lazio
Abruzzo
Molise
Campania
Puglia
Basilicata
Calabria
Sicily
Sardinia
Italy
- North-West
- North-East
- Centre
- South & Islands
Region
Tab.14
14- -Herd
Carico
di bestiame
Tab.
density
Rapporto
tra le Unità
Bovina
Adulta e la SAU
Ratio
of Livestock
Units
to UAA
95
109
Cattle and
buffalo
85,47
94,68
76,68
83,69
79,38
81,04
74,70
65,23
55,59
56,91
72,38
67,75
64,32
54,76
69,38
62,92
42,80
60,37
66,75
44,94
70,73
80,00
73,13
63,71
54,81
0,73
1,49
1,00
1,96
0,88
2,14
4,36
0,42
1,56
1,23
0,41
6,17
5,21
13,63
7,51
9,73
11,28
8,12
13,58
3,22
2,73
0,95
0,83
2,34
7,53
Horses
7,79
1,10
15,14
8,17
7,36
8,87
5,00
25,65
27,21
33,12
18,74
9,96
11,70
13,75
12,06
3,95
16,04
15,41
4,79
10,21
14,38
12,04
16,03
21,45
9,54
Pigs
Source: ISTAT, Censimento generale dell'agricoltura, various years.
Piemonte
Valle D'Aosta
Lombardy
Trentino-Alto Adige
Veneto
Friuli-Venezia Giulia
Liguria
Emilia-Romagna
Tuscany
Umbria
Marche
Lazio
Abruzzo
Molise
Campania
Puglia
Basilicata
Calabria
Sicily
Sardinia
Italy
- North-West
- North-East
- Centre
- South & Islands
Region
1970
0,81
1,65
0,32
1,92
0,20
0,29
5,26
0,66
8,65
4,17
2,75
10,75
13,31
13,16
5,97
19,33
27,46
12,38
11,52
39,56
5,61
0,79
0,60
6,71
24,66
Sheep-goats
5,21
1,08
6,87
4,26
12,19
7,66
10,68
8,04
6,99
4,57
5,73
5,36
5,46
4,71
5,07
4,06
2,42
3,73
3,36
2,07
6,55
6,23
9,42
5,79
3,46
Poultry
Tab.15
15- -Livestock
Patrimonio zootecnico
Tab.
Ripartizionebreakdown
percentualeofdel
patrimonio
secondo le razze allevate
Percentage
livestock
by zootecnico
type of breed
Year
Cattle and
buffalo
78,53
95,66
65,92
86,95
74,20
67,65
68,86
56,96
46,54
42,65
52,84
64,48
55,30
51,78
68,72
68,60
54,31
60,45
75,54
45,25
65,17
70,25
66,93
53,04
57,03
0,33
0,51
0,28
0,90
0,33
1,33
3,69
0,33
2,61
1,66
0,98
4,39
3,59
5,36
2,17
2,65
3,74
4,22
3,25
2,21
1,19
0,33
0,43
2,67
2,82
Horses
13,74
1,11
26,12
6,23
10,27
16,43
5,99
36,44
29,34
42,37
27,45
12,13
15,33
15,66
13,60
5,64
15,34
16,33
6,14
10,23
20,15
21,83
21,93
25,74
10,47
Pigs
1982
1,24
1,97
0,39
2,19
0,24
0,44
8,82
0,68
14,14
6,35
5,58
14,17
19,06
12,65
6,87
18,76
24,37
12,57
11,15
40,90
5,82
0,66
0,52
10,85
24,96
Sheep-goats
(continued)
6,18
0,75
7,29
3,74
14,96
14,15
12,64
5,57
7,37
6,98
13,15
4,83
6,72
14,54
8,64
4,36
2,24
6,43
3,92
1,41
7,68
6,93
10,19
7,71
4,72
Poultry
95
110
Cattle and
buffalo
74,60
97,02
64,69
87,39
68,54
57,61
68,47
53,03
41,36
34,92
41,41
63,89
48,53
51,41
73,97
70,49
51,66
56,08
69,88
39,60
61,69
67,99
62,32
48,40
57,89
0,48
0,34
0,45
1,24
0,55
0,55
4,91
0,61
3,81
2,39
1,30
3,42
2,66
1,64
0,95
2,86
2,62
1,25
1,17
1,46
1,06
0,49
0,61
2,91
1,59
Horses
16,79
0,37
28,17
4,06
10,28
23,78
3,12
34,60
24,06
38,05
26,17
10,10
16,75
13,44
11,43
4,55
13,34
16,74
4,05
10,70
19,88
24,31
21,21
22,02
10,08
Pigs
Source: ISTAT, Censimento generale dell'agricoltura, various years.
Piemonte
Valle D'Aosta
Lombardy
Trentino-Alto Adige
Veneto
Friuli-Venezia Giulia
Liguria
Emilia-Romagna
Tuscany
Umbria
Marche
Lazio
Abruzzo
Molise
Campania
Puglia
Basilicata
Calabria
Sicily
Sardinia
Italy
- North-West
- North-East
- Centre
- South & Islands
Region
1990
1,05
1,76
0,42
2,61
0,25
0,47
11,85
0,64
20,65
7,81
8,25
17,47
20,14
11,72
7,15
18,18
29,63
21,85
22,32
46,44
7,91
0,71
0,57
14,62
25,56
Sheep-goats
7,08
0,50
6,27
4,71
20,39
17,59
11,65
11,12
10,12
16,84
22,87
5,11
11,92
21,78
6,50
3,92
2,76
4,06
2,58
1,79
9,47
6,50
15,28
12,05
4,88
Poultry
Tab. 15 - Livestock (continued)
Ripartizionebreakdown
percentualeofdel
patrimonio
secondo le razze allevate
Percentage
livestock
by zootecnico
type of breed
Year
Cattle and
buffalo
67,44
97,15
54,19
86,97
62,54
45,66
71,80
47,53
41,79
29,22
40,01
67,53
46,73
50,34
75,13
74,72
51,15
56,08
73,30
39,85
57,16
58,48
56,96
48,68
58,91
0,58
0,39
0,41
1,86
0,53
0,62
6,75
0,72
4,50
2,29
1,54
3,38
2,85
1,31
0,65
2,14
2,00
1,20
1,21
1,57
1,02
0,49
0,70
3,08
1,46
Horses
22,83
0,80
38,49
3,05
14,11
25,91
1,93
35,56
20,78
34,79
22,50
6,62
19,46
12,55
9,32
3,84
16,26
16,65
2,97
9,26
23,72
33,45
22,84
18,57
9,62
Pigs
2000
1,11
1,40
0,48
3,75
0,29
0,56
11,06
0,68
23,08
7,23
8,61
16,71
16,74
10,89
6,06
12,75
28,32
20,66
19,73
48,04
7,10
0,72
0,70
14,77
24,01
Sheep-goats
8,05
0,25
6,43
4,38
22,52
27,25
8,45
15,52
9,84
26,48
27,34
5,75
14,21
24,91
8,84
6,55
2,27
5,42
2,79
1,27
11,01
6,85
18,80
14,90
6,01
Poultry
95
111
26,00
29,00
31,00
25,00
25,00
17,00
35,00
43,00
23,00
42,00
34,00
11,00
33,61
Tuscany
Umbria
Marche
Lazio
Abruzzo
Molise
Campania
Puglia
Basilicata
Calabria
Sicily
Sardinia
Italy
13,60
16,60
44,18
58,81
27,10
17,00
12,00
11,00
11,00
8,00
23,00
16,00
16,50
20,00
15,00
17,00
14,00
40,50
31,00
63,00
22,00
92,00
25,00
15,00
33,00
Organic
fertilisers
1994
33,49
31,38
51,00
40,49
37,50
14,00
38,00
45,00
28,00
47,00
40,00
21,00
27,50
29,00
35,00
34,00
30,00
51,50
47,00
65,00
21,00
45,00
45,00
3,00
39,00
Uptakes
9,78
12,44
39,83
54,92
23,11
14,00
8,00
8,00
6,00
4,00
19,00
12,00
12,00
16,00
11,00
12,00
10,00
36,00
26,00
58,00
20,00
88,00
22,00
13,00
29,00
Surplus
23,09
40,16
45,75
31,09
31,54
12,20
23,90
19,40
19,10
27,10
37,60
28,30
30,80
30,70
49,90
50,30
38,30
42,70
47,70
66,50
7,10
40,00
13,90
0,20
26,20
Mineral
fertilisers
Year
26,74
18,05
50,17
39,09
33,73
19,60
32,20
28,00
35,50
22,90
37,20
19,80
23,90
27,00
40,90
39,40
24,00
37,90
66,00
77,00
16,00
47,20
18,80
3,70
35,60
Uptakes
30,71
1998
15,22
33,26
54,63
26,26
25,60
18,10
19,20
16,60
6,70
26,60
17,60
15,60
23,20
9,10
17,10
11,20
30,10
19,00
48,80
18,60
74,90
13,00
13,60
41,20
Organic
fertilisers
Source: ELBA model (Environmental Liveliness and Blent Agriculture), University of Bologna.
29,72
48,00
Emilia-Romagna
- South & Islands
42,00
Friuli-Venezia Giulia
27,22
60,00
Veneto
47,07
19,00
Trentino-Alto Adige
- Centre
41,00
Lombardy
- North-East
42,00
Liguria
36,61
1,00
- North-West
35,00
Valle d'Aosta
Mineral
fertilisers
Piemonte
Region
14,40
24,66
28,84
46,62
24,07
18,20
9,80
10,60
0,20
10,90
27,00
26,10
22,50
26,90
18,10
28,00
25,50
34,90
0,70
38,30
9,70
67,70
8,10
10,10
31,80
Surplus
Tab.
16- Bilancio
- Phosphorus
balance
Tab. 16
del fosforo
Ratio tra
oflathe
difference
uptakes
phosphorus
to UAA (kg/ha of UAA)
Rapporto
differenza
tra la gli between
apporti e gli inputs
asporti diand
fosforo
e la SAU of
(kg/ha
di SAU)
19,78
31,52
39,68
25,13
26,50
10,64
24,10
12,78
17,24
21,80
30,81
18,91
26,74
20,04
47,01
42,39
27,89
35,39
47,02
58,86
6,01
34,69
8,20
0,19
19,33
Mineral
fertilisers
12,67
15,38
38,96
54,74
25,06
15,78
12,11
11,53
12,61
6,46
19,77
12,46
15,51
20,14
11,19
16,44
12,67
40,11
20,33
51,51
22,50
81,06
14,22
16,83
36,04
Organic
fertilisers
2000
13,59
21,52
39,09
35,46
23,40
5,88
11,38
16,03
13,62
16,98
21,42
17,48
17,06
21,03
25,15
25,15
17,75
39,34
44,96
48,58
13,43
47,18
9,70
6,74
28,53
Uptakes
18,78
27,48
39,55
44,41
28,49
20,55
24,83
8,28
16,23
11,27
29,17
13,89
24,19
27,14
30,19
33,67
22,99
36,16
22,39
61,79
15,08
68,58
12,73
10,29
26,85
Surplus
Variation
92,05
120,83
-0,69
-19,14
23,29
46,78
210,41
3,48
170,47
181,68
53,51
15,76
101,58
69,63
174,44
180,62
129,89
0,44
-13,89
6,53
-24,59
-22,07
-42,15
-20,87
-7,42
Surplus
1994/2000
95
112
Highly toxic or
toxic
0,41
0,00
0,34
3,85
1,33
0,51
2,95
2,34
0,25
0,28
0,42
1,37
0,92
0,89
4,89
2,74
1,26
1,02
4,44
0,31
1,73
0,44
1,85
0,61
2,56
3,21
0,00
2,68
14,39
3,72
1,86
9,91
3,25
0,65
0,69
0,92
2,13
1,66
0,76
3,71
1,75
0,67
0,94
1,57
0,51
2,10
3,11
3,60
1,14
1,55
Noxious
21,65
0,00
11,95
77,63
22,07
16,38
26,10
17,64
12,33
9,52
7,98
9,32
9,06
2,94
12,90
11,73
6,45
6,62
7,26
4,15
12,39
16,84
20,84
10,01
8,42
Not classifiable
25,27
0,00
14,97
95,88
27,12
18,74
38,96
23,23
13,23
10,49
9,31
12,82
11,64
4,60
21,50
16,22
8,38
8,57
13,26
4,96
16,22
20,39
26,29
11,76
12,53
Total
Highly toxic or
toxic
0,32
0,09
0,29
3,05
0,93
0,46
3,07
2,24
0,20
0,20
0,32
1,13
0,95
0,84
4,07
2,50
1,02
0,82
3,44
0,29
1,47
0,37
1,63
0,49
2,19
Year
2,38
0,64
2,32
12,47
3,54
1,35
9,25
2,76
0,57
0,46
0,71
2,46
1,55
0,51
3,73
1,56
0,61
0,78
2,16
0,50
1,96
2,50
3,20
1,12
1,62
Noxious
21,05
10,31
11,21
71,09
21,72
15,49
26,30
18,38
10,75
9,49
7,81
9,06
10,03
2,73
13,00
11,64
5,74
6,00
6,21
4,50
12,15
16,09
20,94
9,40
8,24
Not classifiable
1998
23,75
11,05
13,81
86,61
26,19
17,29
38,61
23,39
11,51
10,15
8,83
12,66
12,53
4,09
20,81
15,70
7,37
7,60
11,82
5,29
15,58
18,97
25,76
11,00
12,05
Total
Source: INEA calculations using ISTAT figures, Statistiche dell'Agricoltura, Statistiche ambientali, Dati congiunturali sui mezzi di produzione (data on-line).
Piemonte
Valle d'Aosta
Lombardy
Trentino-Alto Adige
Veneto
Friuli-Venezia Giulia
Liguria
Emilia-Romagna
Tuscany
Umbria
Marche
Lazio
Abruzzo
Molise
Campania
Puglia
Basilicata
Calabria
SiciIia
Sardinia
Italy
- North-West
- North-East
- Centre
- South & Islands
Region
1997
Tab.17a
17a
- Prodotti
fitosanitari
distribuiti
per uso
peruse,
classe
di tossicità
Tab.
- Plant
protection
products
distributed
for agricolo,
agricultural
classified
by toxicity
Rapporto
tra la quantità
prodotti fitosanitari
distribuiti per
agricolo e use
la superficie
trattabile
di of
superficie
trattab
Ratio
of quantity
of plant di
protection
products distributed
foruso
agricultural
to “treatable”
area(kg/ha
(kg/ha
treatable
area) )
(continued)
95
113
Highly toxic
or toxic
0,27
0,07
0,29
2,73
0,88
0,42
2,64
2,08
0,15
0,18
0,25
1,13
0,90
0,61
3,72
2,58
0,98
0,72
2,70
0,23
1,34
0,34
1,51
0,45
1,98
2,26
0,59
1,75
11,42
3,15
1,31
4,00
2,28
0,41
0,30
0,45
2,28
1,21
0,63
3,54
1,45
0,72
0,77
2,19
0,58
1,76
2,05
2,77
0,93
1,58
Noxious
Not
classifiable
19,09
10,76
10,23
72,33
21,09
15,00
19,86
17,81
10,60
9,96
7,06
8,48
10,48
2,60
12,31
12,33
6,29
6,67
5,43
4,37
11,73
14,71
20,34
9,05
8,26
1999
21,62
11,41
12,27
86,48
25,13
16,72
26,51
22,18
11,17
10,44
7,76
11,88
12,59
3,84
19,57
16,36
7,99
8,16
10,32
5,19
14,83
17,11
24,62
10,43
11,82
Total
Highly toxic
or toxic
0,30
0,08
0,32
3,23
0,95
0,41
3,28
2,07
0,20
0,18
0,32
1,09
0,96
0,65
3,23
2,60
0,75
0,79
3,11
0,24
1,36
0,37
1,54
0,46
2,02
Year
2,48
1,07
1,68
10,59
2,77
1,25
5,82
2,35
0,39
0,19
0,52
2,28
1,42
0,55
3,80
1,38
0,70
0,83
2,02
1,03
1,76
2,13
2,63
0,88
1,62
Noxious
Not
classifiable
22,29
23,94
11,37
80,56
23,16
18,33
30,05
21,12
11,98
10,65
8,98
10,71
15,79
3,18
13,74
12,76
6,23
7,99
6,93
4,69
13,63
16,83
23,28
10,76
9,45
2000
25,07
25,09
13,37
94,38
26,89
19,98
39,15
25,53
12,57
11,02
9,82
14,08
18,16
4,39
20,77
16,74
7,67
9,62
12,06
5,96
16,75
19,33
27,44
12,10
13,09
Total
Highly toxic
or toxic
-27,45
-5,63
-16,01
-28,66
-20,14
11,33
-11,63
-18,03
-35,74
-23,69
-20,15
4,43
-26,82
-33,93
-5,36
-40,47
-22,37
-29,91
-22,14
-21,34
-15,56
-16,78
-25,26
-21,41
-22,52
-37,53
-26,44
-25,39
-33,00
-41,29
-27,72
-40,37
-72,21
-43,50
7,10
-14,58
-27,55
2,61
-20,86
3,76
-10,99
28,95
101,96
-16,34
-31,29
-27,11
-22,82
4,54
Not
classifiable
2,94
-4,83
3,76
4,96
11,91
15,11
19,70
-2,82
11,94
12,55
14,90
74,18
8,08
6,46
8,78
-3,48
20,85
-4,60
13,14
10,04
-0,08
11,69
7,52
12,27
Variation
1997/2000
Noxious
Source: INEA calculations using ISTAT figures, Statistiche dell'Agricoltura, Statistiche ambientali, Dati congiunturali sui mezzi di produzione (data on-line).
Piemonte
Valle d'Aosta
Lombardy
Trentino-Alto Adige
Veneto
Friuli-Venezia Giulia
Liguria
Emilia-Romagna
Tuscany
Umbria
Marche
Lazio
Abruzzo
Molise
Campania
Puglia
Basilicata
Calabria
SiciIia
Sardinia
Italy
- North-West
- North-East
- Centre
- South & Islands
Region
Tab. 17a - Plant protection products distributed for agricultural use, classified by toxicity (continued)
Ratiotraofla quantity
of plant
protection
products
distributed
for agricultural
to “treatable”
Rapporto
quantità di prodotti
fitosanitari
distribuiti
per uso agricolo
e la superficie
trattabile (kg/hause
di superficie
trattabile) area (kg/ha of treatable area)
-0,78
-10,71
-1,56
-0,85
6,59
0,47
9,91
-4,95
5,12
5,39
9,86
56,02
-4,60
-3,39
3,20
-8,44
12,23
-9,10
20,04
3,27
-5,17
4,37
2,87
4,43
Total
114
1997
15,12
6,56
57,21
13,01
8,57
21,85
10,39
7,39
5,21
4,14
6,38
5,82
1,39
11,25
6,81
4,21
4,27
8,93
2,73
8,23
10,95
12,51
6,00
6,50
1998
14,48
6,41
51,06
12,81
8,15
22,73
10,68
6,66
5,34
4,36
6,21
6,08
1,52
10,46
6,80
3,70
4,07
7,37
3,09
7,97
10,50
12,46
5,80
6,14
Year
1999
13,78
5,90
5,89
50,80
12,72
7,92
14,92
10,17
6,40
5,74
3,92
5,97
6,25
1,50
9,76
7,31
4,01
4,56
6,29
3,10
7,70
9,89
12,08
5,58
6,03
2000
15,92
11,26
6,32
54,27
13,64
9,85
21,75
11,76
6,78
5,84
4,73
6,78
9,28
1,79
10,00
7,80
4,10
5,22
7,27
3,75
8,66
11,09
13,46
6,17
6,77
(a)
Figures for 1997 and 1998 regarding Valle d'Aosta are included in Piemonte.
Note:
Source: INEA calculations using ISTAT figures, Statistiche dell'Agricoltura, various years.
Piemonte
Valle d'Aosta(a)
Lombardy
Trentino-Alto Adige
Veneto
Friuli-Venezia Giulia
Liguria
Emilia-Romagna
Tuscany
Umbria
Marche
Lazio
Abruzzo
Molise
Campania
Puglia
Basilicata
Calabria
SiciIia
Sardinia
Italy
- North-West
- North-East
- Centre
- South & Islands
Region
Variation
1997/2000
5,27
-3,61
-5,14
4,81
15,03
-0,48
13,18
-8,29
12,14
14,15
6,21
59,39
28,58
-11,09
14,48
-2,54
22,16
-18,64
37,22
5,23
1,29
7,60
2,80
4,02
Tab. 17b - Active ingredients contained in plant protection products
of the
quantity
of active
contained in plant protection proTab. 17b -Ratio
Principi
attiv
i contenuti
neiingredients
prodotti fitosanitari
ducts
distributed
for
agricultural
use
to
treatable
(kg/hafitosanitari
of treatable
Rapporto tra la quantità di principi attivi contenuti area
nei prodotti
distribu
area)
g
(k /h
)
95
115
1985
14,62
0,48
12,15
11,91
20,33
12,41
20,28
17,63
7,75
5,69
8,71
11,65
8,24
2,89
21,47
11,09
2,45
5,85
8,85
1,80
10,69
13,20
17,20
8,83
8,04
1986
15,28
1,18
12,52
13,78
21,62
13,69
26,25
20,17
7,31
5,72
9,76
13,01
8,24
3,62
22,01
11,68
4,75
5,11
10,62
1,79
11,59
13,98
19,12
9,30
8,76
1987
15,55
0,84
13,35
13,59
23,74
12,45
27,41
20,22
8,62
8,66
10,55
18,89
9,86
3,27
23,64
14,28
4,92
6,19
11,38
1,74
12,79
14,50
19,69
12,14
9,81
1988
14,41
1,35
13,90
15,89
27,40
13,63
30,94
24,94
8,22
8,86
9,96
18,46
10,09
3,69
24,05
12,82
5,01
6,33
11,77
3,24
13,47
14,38
23,40
11,79
9,98
1989
14,45
1,55
12,67
13,89
27,36
14,73
29,57
25,36
7,96
8,58
9,95
16,56
9,36
3,41
22,85
11,04
3,99
5,93
10,37
3,16
12,78
13,75
23,34
11,09
9,00
1990
14,52
0,77
12,59
12,35
25,92
14,17
33,53
25,11
8,18
8,93
10,88
16,98
10,14
3,82
21,79
10,86
3,75
6,80
11,08
3,10
12,79
13,82
22,43
11,55
9,15
1991
12,35
0,67
12,28
11,29
23,35
15,72
33,35
22,72
7,13
7,42
8,85
12,92
7,69
3,11
18,72
11,04
3,73
5,93
10,30
2,39
11,45
12,66
20,55
9,30
8,30
(a)
Figures for 1997 regarding Valle d'Aosta are included in Piemonte.
Note:
Source: INEA calculations using ISTAT figures, Statistiche dell'Agricoltura, various years.
Piemonte
Valle D'Aosta
Lombardy
Trentino-Alto Adige
Veneto
Friuli-Venezia Giulia
Liguria
Emilia-Romagna
Tuscany
Umbria
Marche
Lazio
Abruzzo
Molise
Campania
Puglia
Basilicata
Calabria
Sicily
Sardinia
Italy
- North-West
- North-East
- Centre
- South & Islands
Region
1992
11,74
0,38
10,61
12,61
23,17
14,97
28,40
22,31
8,06
7,70
9,91
10,31
7,79
3,20
17,20
11,95
3,57
5,70
10,22
3,70
11,31
11,40
20,44
9,08
8,55
Year
1993
13,86
0,43
11,70
13,62
22,44
17,57
30,15
22,23
7,86
8,20
10,29
11,08
8,74
3,89
16,83
10,96
4,08
6,50
10,62
3,48
11,65
12,91
20,61
9,35
8,55
1994
14,06
0,88
10,75
13,91
21,18
16,31
24,81
21,47
6,65
7,06
8,16
9,52
8,09
3,50
17,06
10,92
3,55
5,54
8,57
2,29
10,74
12,40
19,79
7,86
7,68
1995
15,34
0,64
11,10
15,05
22,69
17,37
21,46
22,30
7,01
7,27
7,87
10,01
8,22
3,62
16,87
12,54
3,95
5,83
9,25
1,46
11,28
13,04
20,91
8,11
8,07
1996
13,84
0,71
11,26
14,76
21,73
15,03
18,81
21,73
7,38
6,54
7,52
9,89
9,29
2,66
16,47
14,36
4,65
4,77
9,06
1,61
11,17
12,35
20,05
8,02
8,41
Tab.
Use of di
plant
protection
Tab. 17c
17c - -Consumo
prodotti
fitosanitariproducts
Ratiotraoflaquantity
plant
protection
products
distributed
for
agricultural
use to UAA (kg/ha of UAA)
Rapporto
quantità di of
prodotti
fitosanitari
distribuiti
per uso agricolo
e la SAU
(kg/ha
di SAU)
10,31
13,89
22,00
14,44
18,21
20,34
9,59
7,65
7,70
8,85
7,60
3,93
17,17
13,79
5,33
6,17
9,24
2,20
11,26
12,62
19,34
8,67
8,62
1997
15,36
1998
15,27
0,28
10,14
13,67
21,27
13,92
16,80
20,64
8,94
7,67
7,42
9,01
7,92
3,29
16,57
13,77
4,66
5,56
8,51
2,16
11,04
12,43
19,13
8,45
8,31
1999
14,23
0,32
8,54
13,03
20,62
13,19
13,26
19,58
8,55
7,71
6,65
8,49
8,07
3,11
15,59
14,54
4,78
5,96
7,75
2,13
10,54
11,09
18,28
7,99
8,24
2000
15,18
0,55
9,25
12,28
20,98
15,63
17,54
22,11
9,61
7,86
8,19
9,13
10,66
3,49
16,16
14,93
4,88
6,83
8,75
2,70
11,30
12,04
19,60
8,91
9,19
116
1994
70.122
2.074
122.180
16.651
73.280
10.730
2.339
60.439
28.705
11.141
12.436
42.028
18.039
7.492
27.993
27.172
19.700
23.491
51.705
91.865
719.583
196.715
161.101
94.311
267.457
1997
63.222
2.611
125.616
17.792
59.351
7.043
3.084
51.590
23.229
10.103
12.168
43.109
15.048
6.866
25.876
23.483
17.056
24.382
67.856
122.101
721.587
194.533
135.777
88.609
302.668
Year
1998
66.136
2.809
120.764
17.367
63.148
6.745
2.198
53.914
21.936
9.339
9.365
39.779
14.685
7.298
25.180
22.530
17.222
22.679
49.773
115.941
688.807
191.907
141.173
80.419
275.308
Source: ELBA model (Environmental Liveliness and Blent Agriculture), University of Bologna.
Piemonte
Valle d'Aosta
Lombardy
Trentino-Alto Adige
Veneto
Friuli-Venezia Giulia
Liguria
Emilia-Romagna
Tuscany
Umbria
Marche
Lazio
Abruzzo
Molise
Campania
Puglia
Basilicata
Calabria
Sicily
Sardinia
Italy
- North-West
- North-East
- Centre
- South & Islands
Region
Tab.18
18- -Methane
Emissioni
di metano
Tab.
emissions
Quantità
metano emessa
agricolo (tonnellate)
Amount
of di
methane
emitteddal
by settore
the agriculture
sector (tonnes)
2000
68.407
3.160
123.027
19.087
66.661
7.556
2.524
57.004
29.490
12.432
11.684
41.731
19.230
7.713
27.682
28.922
18.393
24.626
46.194
92.289
707.812
197.117
150.308
95.337
265.050
Variation
1994/2000
-2,45
52,40
0,69
14,63
-9,03
-29,58
7,90
-5,68
2,73
11,58
-6,05
-0,71
6,60
2,96
-1,11
6,44
-6,63
4,83
-10,66
0,46
-1,64
0,20
-6,70
1,09
-0,90
117
5.328
5.090
14.912
6.110
2.812
11.412
6.734
5.016
6.614
15.449
19.624
291.203
102.210
80.842
34.379
73.772
Piemonte
Valle d'Aosta
Lombardy
Trentino-Alto Adige
Veneto
Friuli-Venezia Giulia
Liguria
Emilia-Romagna
Tuscany
Umbria
Marche
Lazio
Abruzzo
Molise
Campania
Puglia
Basilicata
Calabria
Sicily
Sardinia
Italy
- North-West
- North-East
- Centre
- South & Islands
5.067
5.184
16.127
5.549
2.472
11.053
6.883
4.764
7.179
21.307
25.031
293.346
102.950
72.007
34.152
84.237
1997
31.188
985
69.814
5.268
28.581
5.127
964
33.032
7.774
Year
4.598
3.868
14.277
5.573
2.750
10.406
6.764
4.890
6.691
14.549
22.733
272.318
97.853
70.146
29.963
74.356
1998
31.489
1.080
64.615
5.165
30.437
4.277
669
30.266
7.220
Source: ELBA model (Environmental Liveliness and Blent Agriculture), University of Bologna.
1994
33.746
762
66.988
4.932
34.774
6.077
715
35.058
9.049
Region
Tab.19
19- -Ammonia
Emissioni
di ammoniaca
Tab.
emissions
Quantità
di
ammoniaca
emessa
agricolo
(tonnellate)
Amount of ammonia emitted
bydal
thesettore
agriculture
sector
(tonnes)
3.681
3.861
10.278
4.684
1.989
7.873
5.489
3.507
5.012
11.252
19.847
224.098
79.779
60.081
24.585
59.653
2000
26.175
804
52.240
4.268
25.021
2.730
560
28.062
6.764
-30,90
-24,14
-31,08
-23,34
-29,28
-31,01
-18,50
-30,08
-24,22
-27,17
1,14
-23,04
-21,95
-25,68
-28,49
-19,14
1994/2000
-22,43
5,55
-22,02
-13,46
-28,05
-55,08
-21,67
-19,96
-25,25
Variation
118
1994
752,14
4,00
1.346,07
118,12
939,75
179,94
109,52
1.037,05
473,15
252,27
302,89
442,81
170,13
99,21
637,17
849,68
221,70
193,80
496,99
280,98
8.907,39
2.211,74
2.274,86
1.471,12
2.949,68
Year
1998
771,93
4,11
1.381,48
121,23
964,47
184,68
112,40
1.064,33
485,60
258,90
310,86
454,46
174,61
101,82
653,94
872,04
227,53
198,90
510,07
288,38
9.141,73
2.269,92
2.334,71
1.509,82
3.027,28
Source: ELBA model (Environmental Liveliness and Blent
Agriculture), University of Bologna.
Piemonte
Valle d'Aosta
Lombardy
Trentino-Alto Adige
Veneto
Friuli-Venezia Giulia
Liguria
Emilia-Romagna
Tuscany
Umbria
Marche
Lazio
Abruzzo
Molise
Campania
Puglia
Basilicata
Calabria
Sicily
Sardinia
Italy
- North-West
- North-East
- Centre
- South & Islands
Region
Tab. 20 - Carbon dioxide emissions
Tab. 20 -Amount
Emissioni
di anidride
of carbon
dioxidecarbonica
emitted by the
Quantità di
anidride
carbonica
agriculture
sector
('000
tonnes)emessa dal set
g
(0
)
Tab.
use of di
energy
Tab.2121- Direct
- Uso diretto
energia
Ratio
of
the
amount
of energy consumed in agriculture to UAA (Giga Joules/ha of UAA)
Rapporto tra la quantità di energia consumata in agricoltura e la SAU (Giga Joule/ha d
Year
Italy
Number of farms
Average UAA
Quintals per farm
Quintals per ha
Quintals total
Expenditure per farm (euro)
Expenditure per ha (euro)
GJ per farm
GJ per ha
GJ total
North-West
Number of farms
Average UAA
Quintals per farm
Quintals per ha
Quintals total
Expenditure per farm (euro)
Expenditure per ha (euro)
GJ per farm
GJ per ha
GJ total
Centre
Number of farms
Average UAA
Quintals per farm
Quintals per ha
Quintals total
Expenditure per farm (euro)
Expenditure per ha (euro)
GJ per farm
GJ per ha
GJ total
South & Islands
Number of farms
Average UAA
Quintals per farm
Quintals per ha
Quintals total
Expenditure per farm (euro)
Expenditure per ha (euro)
GJ per farm
GJ per ha
GJ total
1999
2000
2.984
22,93
23,43
1,02
69.902
998
44
121,73
5,31
363.237
3.268
24,37
24,78
1,02
80.982
1.135
47
128,86
5,29
421.111
2.935
24,84
23,85
0,96
70.008
1.304
53
123,92
4,99
363.713
-1,64
8,32
1,82
-5,99
0,15
30,68
20,65
1,80
-6,01
0,13
222
12,78
17,17
240
18,87
16,31
181
22,36
28,96
-18,47
74,91
68,61
1,34
3.813
793
62
89,39
6,99
19.845
0,86
3.915
766
41
85,37
4,52
20.489
1,30
5.241
1.527
68
151,11
6,76
27.350
-3,60
37,47
92,57
10,10
69,04
-3,36
37,82
533
23,62
28,05
1,19
14.950
1.094
46
145,59
6,16
77.601
504
24,76
31,44
1,27
15.844
1.379
56
163,30
6,60
82.304
483
24,18
32,20
1,33
15.552
1.764
73
167,29
6,92
80.803
-9,38
2,36
14,80
12,15
4,03
61,17
57,45
14,91
12,25
4,13
2.229
23,77
22,94
0,97
51.139
995
42
119,24
5,02
265.790
2.524
24,81
24,26
0,98
61.223
1.121
45
126,12
5,08
318.318
2.271
25,17
21,67
0,86
49.214
1.188
47
112,53
4,47
255.560
1,88
5,88
-5,54
-10,79
-3,76
19,42
12,79
-5,63
-10,87
-3,85
Source: INEA calculations using FADN figures, various years.
95
Variation
1998
119
1998/2000
)
120
21,41
17,03
30,98
18,08
3,62
5,82
18,31
12,61
22,70
35,21
76,93
54,47
32,78
14,40
Piemonte
Valle d'Aosta
Lombardy
Trentino-Alto Adige
Veneto
Friuli-Venezia Giulia
Liguria
Emilia-Romagna
Tuscany
Umbria
Marche
Lazio
Abruzzo
Molise
Campania
Puglia
Basilicata
Calabria
Sicily
Sardinia
Italy
- North-West
- North-East
- Centre
- South & Islands
30,42
18,25
25,44
33,31
6,47
20,78
15,23
15,77
27,92
35,73
75,63
38,89
41,03
19,01
1997
45,33
23,44
112,07
13,18
41,50
38,45
66,45
45,56
47,88
68,68
27,32
Year
25,92
19,14
31,60
33,78
-3,40
10,12
8,83
1,88
27,85
28,99
67,03
28,33
38,08
13,05
1998
35,97
23,88
104,51
9,82
40,92
14,44
38,15
28,48
46,71
68,74
22,18
30,54
26,59
7,48
46,35
12,29
14,00
17,31
28,24
20,25
40,06
85,19
58,46
27,14
22,04
2000
53,76
16,47
130,62
0,48
103,49
49,36
5,66
47,98
17,03
45,86
23,54
Source: ELBA model (Environmental Liveliness and Blent Agriculture), University of Bologna.
1994
54,60
17,46
107,70
9,51
43,58
65,47
45,59
75,66
45,64
46,95
20,39
Region
42,65
56,13
-75,85
156,41
239,61
140,77
-5,43
124,03
-10,83
13,77
10,74
7,31
-17,22
53,08
Variation
1994/2000
-1,54
-5,67
21,28
-94,91
137,49
-24,60
-87,60
-36,58
-62,68
-2,33
15,50
Tab.22
22- -Nitrogen
Bilanciobalance
di azoto
Tab.
Rapporto
la differenza
tra gli inputs
apporti and
e gliuptakes
asporti diofazoto
e la SAU
(kg/ha
di SA
)
Ratio of thetra
difference
between
nitrogen
to UAA
(kg/ha
of UAA)
121
media
11,09
15,38
15,31
18,85
13,53
10,73
13,03
11,34
11,29
4,75
16,50
12,10
12,71
15,30
7,58
10,15
4,76
11,37
13,14
14,85
11,38
9,66
Potential leaching(a)
max
15,76
23,79
25,81
19,41
22,72
16,30
13,34
14,42
15,49
8,14
18,92
15,47
17,41
18,26
14,99
23,39
7,54
25,81
19,60
23,41
15,19
15,60
min
0,15
1,26
1,04
1,29
7,34
4,66
11,81
9,48
6,85
3,63
9,19
6,87
6,39
12,03
2,50
1,01
1,70
0,15
0,68
4,30
7,47
4,18
(a)
For Valle d'Aosta, Liguria and Trentino Alto Adige, figures are missing
because information about land use was not available.
Note:
Source: ELBA model (Environmental Liveliness and Blent Agriculture),
University of Bologna.
Piemonte
Valle d'Aosta
Liguria
Lombardy
Trentino-Alto Adige
Veneto
Friuli-Venezia Giulia
Emilia-Romagna
Tuscany
Umbria
Marche
Lazio
Abruzzo
Molise
Campania
Puglia
Basilicata
Calabria
Sicily
Sardinia
Italy
- North-West
- North-East
- Centre
- South & Islands
Region
Tab. 23 - Potential leaching of nitrates
ofiazione
amount potenziale
of leached nitrogen
to UAA (kg/ha
Tab. 23 -Ratio
Lisciv
dei nitrati
ofRapporto
UAA, 2000)
tra la quantità di azoto lisciviato e la SAU (kg/h
,
20
)
95
122
253
524
321
205
277
279
88
209
137
159
156
159
189
90
135
103
60
76
104
89
166
285
239
151
104
1990
277
126
359
334
340
340
467
240
203
400
176
157
171
114
157
142
83
111
146
114
210
324
287
211
135
1993
235
34
301
164
269
302
330
225
149
146
133
120
121
71
131
117
72
110
93
53
164
272
246
136
101
1995
206
10
300
200
277
218
478
195
140
161
147
134
137
86
146
114
73
109
71
53
157
261
226
143
97
1996
Year
209
79
330
222
325
300
352
212
153
185
149
134
127
79
169
131
93
109
105
40
171
273
261
151
110
1997
186
32
286
199
281
238
131
156
137
183
141
129
138
97
161
100
66
81
89
77
150
236
209
142
99
1998
187
24
289
174
310
296
138
161
124
172
142
123
119
72
149
93
57
78
84
116
150
236
227
135
96
1999
202
43
293
238
320
327
175
175
131
183
170
163
164
68
175
100
61
79
121
89
167
248
244
156
109
2000
-2,03
-20,32
-0,81
1,36
1,33
1,45
6,44
-1,58
-0,43
1,29
0,80
0,21
-1,28
-2,54
2,39
-0,30
0,15
0,43
1,39
0,01
0,03
-1,24
0,18
0,29
0,45
R of I
1990-2000
Source: INEA calculations using ISTAT figures, Statistiche dell'Agricoltura, various years; Statistiche ambientali, various years; Dati congiunturali sui mezzi di produzione (data on-line).
Piemonte
Valle d'Aosta
Lombardy
Trentino-Alto Adige
Veneto
Friuli-Venezia Giulia
Liguria
Emilia-Romagna
Tuscany
Umbria
Marche
Lazio
Abruzzo
Molise
Campania
Puglia
Basilicata
Calabria
Sicily
Sardinia
Italy
- North-West
- North-East
- Centre
- South & Islands
Region
Tab.
- Fertiliser
use
Tab.24a
24a
- Consumo
di fertilizzanti
Ratio
of amount
fertilisers
distributed
for agriculture
to fertilisable
areaconcimabile
(kg/ha of fertilisable
area) concimabile)
Rapporto
tra laof
quantità
di fertilizzanti
distribuiti
per uso use
agricolo
e la superficie
(Kg/ha di superficie
95
123
151
9
227
27
224
218
36
184
99
113
131
107
111
70
105
90
37
51
75
35
114
176
176
110
70
1990
153
4
232
34
249
252
32
184
100
109
136
106
137
65
105
101
46
59
65
29
118
178
188
110
72
1991
147
2
239
52
248
258
63
201
104
115
127
110
131
78
113
113
39
75
86
42
125
180
199
112
83
1992
165
2
257
46
268
260
170
209
128
269
148
110
98
91
123
116
43
75
93
40
138
201
209
148
85
1993
156
1
215
32
228
211
138
205
114
113
126
98
87
74
119
115
35
80
81
25
120
176
188
112
77
1994
144
0
220
23
221
229
141
200
102
98
112
84
70
54
103
98
38
74
62
20
110
173
183
98
64
Year
1995
131
0
218
31
230
168
231
174
106
112
127
93
83
68
118
99
45
77
50
20
110
169
170
107
66
1996
127
1
227
32
263
231
165
186
111
135
123
92
83
67
135
111
59
78
73
18
119
169
192
111
76
1997
119
1
210
31
229
192
57
138
106
138
119
92
87
78
128
87
41
59
64
32
106
155
155
109
68
1998
123
1
201
26
254
234
69
142
95
127
122
88
76
58
118
83
34
57
63
48
107
153
169
103
67
1999
122
1
203
31
250
256
79
152
100
131
142
105
96
54
136
89
39
56
88
40
116
155
174
115
77
2000
R of I
1990-2000
-2,10
-20,26
-1,10
1,31
1,09
1,59
8,06
-1,90
0,11
1,50
0,84
-0,11
-1,40
-2,66
2,65
-0,12
0,45
0,92
1,57
1,42
0,19
-1,29
-0,12
0,45
0,89
Source: INEA calculations using ISTAT figures, Statistiche dell'Agricoltura, various years; Statistiche ambientali, various years; Dati congiunturali sui mezzi di produzione (data on-line).
Piemonte
Valle d'Aosta
Lombardy
Trentino-Alto Adige
Veneto
Friuli-Venezia Giulia
Liguria
Emilia-Romagna
Tuscany
Umbria
Marche
Lazio
Abruzzo
Molise
Campania
Puglia
Basilicata
Calabria
Sicily
Sardinia
Italy
- North-West
- North-East
- Centre
- South & Islands
Region
Tab.
Tab.24b
24b -- Fertiliser
Consumouse
di fertilizzanti
Rapporto
quantità diof
fertilizzanti
distribuiti
per uso agricolo
e la SAU (kg/ha
Ratiotra
oflaamount
fertilisers
distributed
for agriculture
use di
toSAU)
UAA (kg/ha of UAA)
124
1998
24,99
23,89
24,44
15,71
29,98
56,14
40,89
25,07
42,48
15,71
18,66
13,00
14,39
17,34
17,29
21,62
16,26
7,67
19,85
25,12
21,61
26,86
29,84
21,33
18,02
Year
2000
27,63
14,97
33,57
19,03
36,51
53,91
25,57
37,81
23,22
33,00
29,10
18,33
49,61
30,04
35,80
35,22
28,59
32,70
28,55
14,66
30,64
28,73
35,69
23,01
32,08
1998/2000
10,59
-37,35
37,37
21,16
21,76
-3,96
-37,46
50,80
-45,33
110,09
55,90
40,93
244,63
73,19
107,10
62,88
75,85
326,02
43,81
-41,64
41,80
6,96
19,61
7,85
77,99
Variation
Source: INEA calculations using ISTAT figures, Struttura e produzioni delle
aziende agricole, 1998; Censimento generale dell'agricoltura, 2003.
Piemonte
Valle d'Aosta
Lombardy
Trentino-Alto Adige
Veneto
Friuli-Venezia Giulia
Liguria
Emilia-Romagna
Tuscany
Umbria
Marche
Lazio
Abruzzo
Molise
Campania
Puglia
Basilicata
Calabria
Sicily
Sardinia
Italy
- North-West
- North-East
- Centre
- South & Islands
Region
Rapporto percentuale tra il numero di aziende agricole h
Tab. 25 - Application of an annual fertilising plan
Percentage share of number of farms that adopt an
fertilisingdi
plan
total di
number
of farms annu
Tab. 25 annual
- Applicazione
un in
piano
concimazione
95
125
11,25
31,31
34,42
81,12
48,43
40,10
14,44
65,02
48,96
48,31
47,21
50,54
42,46
14,85
14,28
33,28
21,25
6,95
10,73
26,57
28,93
20,91
58,37
49,35
17,67
Sprinkling
10,73
0,20
5,94
0,57
1,13
0,90
4,90
1,71
0,82
1,20
0,60
1,03
0,58
0,58
1,19
2,18
4,01
5,18
46,05
2,29
8,81
6,95
1,19
0,92
13,92
Flooding
1982
Furrowing and
lateral seepage
87,03
86,70
72,24
28,29
56,39
68,55
56,31
37,85
58,27
61,70
63,43
51,41
63,76
85,87
86,18
57,05
75,84
88,02
39,15
76,66
63,93
73,18
47,04
56,25
67,57
1,19
0,13
0,75
1,19
0,92
0,60
2,92
7,35
2,16
1,00
0,85
2,50
0,95
0,37
1,15
12,09
1,86
0,81
8,34
2,35
3,38
1,49
2,95
1,98
4,61
Drip
0,53
0,08
0,29
0,27
0,27
17,42
32,48
1,04
1,22
0,34
1,22
1,52
0,43
1,77
1,91
1,56
3,03
0,80
0,52
0,21
3,12
9,63
2,36
1,27
1,15
Other
18,32
42,02
42,10
87,41
79,15
68,34
16,35
84,85
62,94
69,39
68,57
54,62
56,80
37,62
21,98
42,63
33,62
13,40
16,36
48,77
40,40
25,83
81,22
59,89
27,64
Sprinkling
8,13
0,41
7,30
0,40
1,21
0,88
0,75
1,48
1,01
0,90
0,68
0,70
1,15
1,42
1,99
1,64
1,31
1,55
25,55
1,95
5,15
5,35
1,12
0,80
7,41
Flooding
1990
Furrowing and
lateral seepage
92,46
79,98
71,15
14,03
49,39
61,69
51,91
33,05
55,77
54,48
51,40
54,61
65,12
72,63
87,93
38,94
78,28
93,12
47,53
75,00
62,40
73,65
39,70
54,50
67,69
Source: INEA calculations using ISTAT figures, Struttura e produzioni delle aziende agricole, 1998; Censimento generale dell'agricoltura, 2003.
Piemonte
Valle d'Aosta
Lombardy
Trentino-Alto Adige
Veneto
Friuli-Venezia Giulia
Liguria
Emilia-Romagna
Tuscany
Umbria
Marche
Lazio
Abruzzo
Molise
Campania
Puglia
Basilicata
Calabria
Sicily
Sardinia
Italy
- North-West
- North-East
- Centre
- South & Islands
Region
Tab.
26- Sistemi
- Irrigation
systems
Tab. 26
di irrigazione
Percentuale
delle aziende
che adottano
i diversi
di irrigazione
Percentage
share irrigue
of irrigated
farms
thatsistemi
adopt
various irrigation systems
4,06
1,13
1,83
6,09
2,49
2,62
10,31
16,45
7,61
1,80
4,92
10,02
4,71
3,04
2,86
48,22
7,67
2,79
24,87
13,94
12,15
5,12
7,25
7,98
17,18
Drip
(Continued)
0,57
0,34
0,45
0,24
0,55
20,54
35,40
1,92
1,65
0,20
0,30
1,71
1,00
0,42
1,13
2,63
0,47
0,90
1,36
0,68
3,30
10,81
2,79
1,37
1,32
Other
126
19,61
60,63
40,67
84,33
63,39
65,89
29,29
65,07
55,30
53,46
61,06
53,87
54,01
62,21
27,68
37,60
53,75
25,89
52,85
42,53
45,65
31,38
68,27
55,04
40,09
Sprinkling
6,79
0,35
6,18
0,16
1,30
0,06
0,09
1,32
0,17
0,00
0,08
0,34
0,01
0,05
0,04
0,03
0,06
0,38
0,61
0,59
1,02
4,71
0,97
0,22
0,27
Flooding
2000
Furrowing and
lateral seepage
79,82
68,98
64,28
8,42
41,04
48,82
51,18
23,76
38,34
45,35
43,20
41,27
44,81
31,05
73,68
13,20
41,96
72,19
33,77
39,90
44,09
67,29
30,53
41,21
43,11
5,70
0,96
2,34
25,52
3,36
2,16
10,40
19,57
13,54
5,36
5,97
12,35
7,34
13,85
4,25
48,46
10,82
4,71
16,68
28,68
15,64
5,34
12,03
11,06
20,39
Drip
2,55
2,78
1,73
1,18
1,94
15,79
23,19
8,05
5,93
3,24
3,04
3,85
1,85
3,22
3,42
7,22
4,17
2,30
3,06
1,79
4,50
6,96
4,57
4,24
3,92
Other
Source: INEA calculations using ISTAT figures, Struttura e produzioni delle aziende agricole, 1998; Censimento generale
dell'agricoltura, 2003.
Piemonte
Valle d'Aosta
Lombardy
Trentino-Alto Adige
Veneto
Friuli-Venezia Giulia
Liguria
Emilia-Romagna
Tuscany
Umbria
Marche
Lazio
Abruzzo
Molise
Campania
Puglia
Basilicata
Calabria
Sicily
Sardinia
Italy
- North-West
- North-East
- Centre
- South & Islands
Region
Tab. 26 - Irrigation systems (continued)
Percentage share of irrigated farms that adopt various irrigation systems
127
1982
16,72
21,59
53,80
12,39
24,26
17,28
9,66
18,52
7,00
7,80
6,59
11,52
6,75
2,59
16,38
10,17
5,06
10,30
10,06
4,01
10,26
23,39
11,73
5,15
6,47
Year
1990
33,27
25,16
56,20
13,52
30,74
24,40
11,18
22,31
6,26
9,63
5,74
12,96
6,48
3,88
18,09
15,60
6,79
13,16
11,57
5,66
18,02
42,18
23,89
8,69
11,00
2000
32,02
42,65
54,53
13,78
29,74
22,50
10,96
21,05
6,30
10,86
5,41
13,22
6,28
4,00
16,99
13,96
6,87
12,16
13,99
5,34
17,86
41,92
22,86
8,87
10,91
R of I
1982-2000
3,48
3,65
0,07
0,56
1,08
1,40
0,67
0,68
-0,56
1,75
-1,03
0,73
-0,38
2,32
0,19
1,68
1,62
0,88
1,75
1,52
2,96
3,12
3,57
2,90
2,79
Source: INEA calculations using ISTAT figures, Censimento generale dell'agricoltura, various years.
Piemonte
Valle d'Aosta
Lombardy
Trentino-Alto Adige
Veneto
Friuli-Venezia Giulia
Liguria
Emilia-Romagna
Tuscany
Umbria
Marche
Lazio
Abruzzo
Molise
Campania
Puglia
Basilicata
Calabria
Sicily
Sardinia
Italy
- North-West
- North-East
- Centre
- South & Islands
Region
Tab.27a
27a- -Irrigated
Superficie
Tab.
landirrigata
Rapporto
tra la superficie
irrigata e la SAU
Percentagepercentuale
share of irrigated
land in UAA
128
1982
321.216
21.589
625.296
50.631
221.726
47.177
11.164
235.922
69.360
32.633
37.489
101.269
37.302
6.629
116.134
155.084
31.682
74.521
170.546
57.342
2.424.712
979.265
555.456
240.751
649.240
Year
1990
372.741
24.307
620.636
57.114
270.892
62.685
10.344
274.953
58.092
38.148
31.547
108.075
33.758
9.734
119.814
226.823
42.398
87.310
184.967
76.844
2.711.182
1.028.028
665.644
235.862
781.648
2000
355.800
23.623
554.382
57.768
265.253
63.202
7.191
252.377
47.286
32.117
25.070
74.052
29.995
11.812
86.415
248.837
42.325
66.922
161.044
62.315
2.467.787
940.997
638.600
178.526
709.664
Source: INEA calculations using ISTAT figures, Censimento generale dell'agricoltura, various years.
Piemonte
Valle d'Aosta
Lombardy
Trentino-Alto Adige
Veneto
Friuli-Venezia Giulia
Liguria
Emilia-Romagna
Tuscany
Umbria
Marche
Lazio
Abruzzo
Molise
Campania
Puglia
Basilicata
Calabria
Sicily
Sardinia
Italy
- North-West
- North-East
- Centre
- South & Islands
Region
Tab.27b
27b- -Irrigated
Superficie
irrigata
Tab.
land
Superficie
Irrigated
landirrigata
(ha) (ha)
R of I
1982-2000
0,54
0,47
-0,63
0,70
0,95
1,55
-2,29
0,36
-2,00
-0,08
-2,10
-1,63
-1,14
3,09
-1,54
2,52
1,54
-0,56
-0,30
0,44
0,09
-0,21
0,74
-1,56
0,47
95
129
1
2
C
0
S
0
E
2
C
S
13
3
0
1
3
3
E
1
133
C
1
206
16
S
5
5
E
1
C
Legend:
E = emergency
C = continuing
S = seasonal
Source: INEA, POM risorse idriche 1994-1999, 1999.
30
Total
4
3
Other
Lifting from residual water gathering basins
1
6
River intakes using fixed weirs
River intakes using weirs with adjustable sluices
2
Natural lake intakes
Artificial lake intakes (hillside ponds)
Artificial lake intakes (reservoir)
Shallow groundwater table catchment, drainage trenches and wells
Shallow groundwater table catchment with wells
1
3
1
2
76
2
16
3
1
14
1
1
1
48
2
20
3
134
237
6
1
7
8
4
3
80
5
26
11
2
2
2
6
6
10
S
10
0
E
30
2
5
4
1
7
2
3
6
C
23
8
4
S
Sicily
1
1
E
9
C
1
3
S
Sardinia
0
E
8
392
61
30
Total for all
Region
38
2
1
3
1
14
2
2
11
3
3
1
1
741
19
2
45
74
4
9
58
1
35
3
2
11
11
S
Calabria
0
6
1
4
C
Puglia
Shallow groundwater table catchment with drainage trenches
27
E
Basilicata
Deep groundwater table catchment, wells and drainage tunnels
Deep groundwater table catchment using drainage tunnels
4
10
E
Campania
Deep groundwater table catchment using wells
S
6
Molise
10
1
C
Abruzzo
Spring catchment
Canal catchment
Types of supply sources
Tab.
28- -Fonti
Type
of catchment
Tab. 28
di approvvigionamento
Number
wateridrico
catchments
Numero
di fontiof
di registered
approvvigionamento
censite
95
130
9
1
3
55
14
3
6
20
60
1
4
32
24
6
10
21
10
20
3
16
318,0
19
92
97
110
Number
67.474
25.865
59.937
75.534
34.592
399
3.895
24.777
73.330
18.183
63.016
50.667
239.250
6.403
187.735
126.707
90.324
189.364
87.430
1.424.882
157.171
135.302
205.196
927.213
Area (ha)
State areas
4,74
1,82
4,21
5,30
2,43
0,03
0,27
1,74
5,15
1,28
4,42
3,56
16,79
0,45
13,18
8,89
6,34
13,29
0,00
6,14
100,00
11,03
9,50
14,40
65,07
Area (%)
51
10
75
24
11
12
10
25
40
6
4
40
15
0
11
1
7
2
17
1
362
146,00
72,00
90,00
54,00
Number
105.620
4.033
72.065
207.897
58.785
53.091
17.803
58.382
80.588
40.875
21.538
156.740
64.451
147.100
125
34.852
750
198.173
5.200
1.328.068
199.521
378.155
299.741
450.651
Area (ha)
Regional areas
7,95
0,30
5,43
15,65
4,43
4,00
1,34
4,40
6,07
3,08
1,62
11,80
4,85
0,00
11,08
0,01
2,62
0,06
14,92
0,39
100,00
15,02
28,47
22,57
33,93
Area (%)
Source: Environment Ministry, Nature Conservation Report (3rd updating of the official list of Protected Natural Areas), 2000.
Piemonte
Valle d'Aosta
Lombardy
Trentino-Alto Adige
Veneto
Friuli-Venezia Giulia
Liguria
Emilia-Romagna
Tuscany
Umbria
Marche
Lazio
Abruzzo
Molise
Campania
Puglia
Basilicata
Calabria
Sicily
Sardinia
Italy
- North-West
- North-East
- Centre
- South & Islands
Region
Tab.
29
- Protected
Tab. 29
- Aree
protette areas
Number,
area
and percentage
breakdown
ofaree
protected
areas
by region (2000)
Numero,
superficie
e ripartizione
percentuale tra
le regioni delle
protette (anno
2000)
60
11
78
79
25
15
16
45
100
7
8
72
39
6
21
22
17
22
20
17
680
165
164
187
164
Number
Total
173.094
29.898
132.002
283.431
93.377
53.490
21.698
83.159
153.918
59.058
84.554
207.407
303.701
6.403
334.835
126.832
125.176
190.114
198.173
92.630
2.752.950
356.692
513.457
504.937
1.377.864
Area (ha)
6,29
1,09
4,79
10,30
3,39
1,94
0,79
3,02
5,59
2,15
3,07
7,53
11,03
0,23
12,16
4,61
4,55
6,91
7,20
3,36
100,00
12,96
18,65
18,34
50,05
Area (%)
6,81
9,16
5,53
20,83
5,08
6,81
4,00
3,76
6,70
6,98
8,72
12,05
28,13
1,44
24,63
6,55
12,52
12,61
7,71
3,85
9,14
6,16
8,28
8,65
11,20
Percentage of national
territory (%)
131
4
46
78
43
24
2
5
1
3
29
Umbria
Marche
Lazio
Abruzzo
Molise
Campania
Puglia
Basilicata
Calabria
Sicily
39
4
69
9
14
74
21
41
15
23
41
42
14
14
40
24
5
14
27
32
Severely
threatened
Source: Italian Botanical Society - WWF, “Regional Red List of Plants of Italy”, Camerino, 1997.
5
14
17
Emilia-Romagna
Tuscany
Sardinia
50
-
Friuli-Venezia Giulia
Liguria
1
6
6
2
5
7
6
Extinct
Piemonte
Valle d'Aosta
Lombardy
Trentino-Alto Adige
Veneto
Region
Extinct in the
wild
Tab. 30 - Condizione delle specie v egetali
41
42
1
23
123
37
38
64
93
11
36
15
34
42
3
1
24
16
62
Threatened
119
66
9
86
109
270
299
245
181
177
334
36
162
139
23
160
55
197
168
53
At minor risk
Endangered species
Tab. 30 - Condition of plant species
Numero di specie vegetali estinte ed in pericolo incluse nella "Lista rossa" (anno 1995)
Number of extinct and endangered plant species included in the “Red List” (1995)
69
38
46
35
107
122
161
61
49
43
177
78
123
156
15
88
18
75
61
76
Vulnerable
268
108
166
131
253
589
518
385
309
336
563
192
314
343
120
275
79
310
272
223
Total
95
132
1985
0,34
0,45
0,27
0,04
0,27
0,20
2,34
0,12
0,64
0,74
0,93
2,27
0,73
1,48
4,91
3,63
1,52
2,43
0,87
1,75
1,13
0,70
0,12
1,05
2,23
1986
0,29
0,04
0,32
0,01
0,11
0,31
2,23
0,02
0,13
0,07
0,05
0,24
0,04
0,14
0,55
0,56
0,40
0,86
1,30
0,71
0,40
0,65
0,07
0,14
0,65
1987
0,42
0,06
0,40
0,04
0,08
0,25
0,97
0,08
0,25
0,20
0,31
1,12
0,23
0,91
0,80
1,35
0,46
2,47
3,09
1,63
0,72
0,50
0,09
0,45
1,56
1988
0,34
0,08
0,60
0,08
0,40
0,39
1,82
0,06
0,27
0,20
0,31
0,47
0,34
2,93
1,64
3,20
2,36
2,55
1,59
2,01
0,88
0,69
0,17
0,31
1,99
Year
1989
0,65
0,15
0,89
0,10
0,45
2,15
3,11
0,21
0,64
0,14
0,17
0,39
0,33
0,31
0,55
0,15
0,18
0,62
0,67
1,05
0,66
1,17
0,45
0,46
0,60
1990
4,12
1,32
1,60
0,24
0,67
2,56
4,92
0,21
0,97
0,36
0,05
1,34
0,32
0,37
1,43
1,97
0,39
1,43
1,30
0,91
1,42
3,31
0,60
0,87
1,07
1991
0,17
0,04
0,39
0,02
0,11
0,16
1,56
0,07
0,22
0,16
0,03
0,45
0,12
1,26
1,05
1,08
0,11
0,49
0,57
0,57
0,36
0,50
0,06
0,24
0,58
Source: ISTAT, Forestry statistics, various years; Agricultural and forestry cultivation, various years; Agriculture, forestry and hunting, various years.
Piemonte
Valle d'Aosta
Lombardy
Trentino-Alto Adige
Veneto
Friuli-Venezia Giulia
Liguria
Emilia-Romagna
Tuscany
Umbria
Marche
Lazio
Abruzzo
Molise
Campania
Puglia
Basilicata
Calabria
Sicily
Sardinia
Italy
- North-West
- North-East
- Centre
- South & Islands
Region
Tab.3131- Wooded
- Superficie
percorsa
dal fuoco
Tab.
land forestale
affected by
fire
Rapporto share
percentuale
tra la land
superficie
forestale
dal fuoco
e la superficie forestale totale
Percentage
of wooded
affected
by fire percorsa
in total wooded
land
1992
0,41
0,02
0,66
0,09
0,36
0,41
1,45
0,11
0,18
0,12
0,26
0,82
0,40
0,89
1,59
1,77
0,51
1,51
0,57
0,95
0,60
0,67
0,18
0,32
1,07
(continued)
1993
0,26
0,01
0,94
0,16
0,54
0,75
1,51
0,15
0,29
0,70
1,37
3,05
1,17
1,50
4,51
2,95
1,44
3,49
5,76
3,93
1,54
0,70
0,30
1,07
3,43
95
133
1994
0,12
0,03
0,19
0,03
0,05
0,22
0,46
0,02
0,26
0,19
0,38
0,33
0,50
0,37
0,47
1,65
0,24
1,02
2,69
3,26
0,60
0,20
0,05
0,27
1,55
1995
0,76
0,14
0,37
0,11
0,04
0,33
0,83
0,12
0,06
0,02
0,02
0,26
0,11
0,03
0,23
0,47
0,43
0,24
0,58
0,11
0,27
0,61
0,13
0,10
0,25
1996
0,04
0,01
0,07
0,04
0,05
0,15
0,32
0,02
0,10
0,04
0,03
0,12
0,08
0,15
1,04
1,86
0,57
0,60
0,65
0,07
0,22
0,10
0,05
0,09
0,53
Year
1997
0,55
0,47
1,32
0,06
0,77
1,08
1,61
0,11
0,37
0,06
0,02
1,21
0,34
0,19
1,47
1,30
0,76
1,64
1,93
0,26
0,73
0,99
0,33
0,60
1,02
1998
0,30
0,07
0,70
0,03
0,05
0,30
1,24
0,21
0,27
0,25
0,36
0,50
0,53
0,15
0,60
1,43
0,43
2,40
6,15
2,22
0,86
0,59
0,11
0,35
1,99
1999
0,48
0,00
0,14
0,01
0,13
0,11
1,67
0,03
0,08
0,06
0,13
0,22
0,03
0,03
0,44
0,66
0,08
0,77
2,05
1,15
0,41
0,57
0,05
0,24
0,78
2000
0,35
0,01
0,24
0,01
0,04
0,04
0,82
0,05
0,12
0,12
0,28
1,43
0,81
0,43
2,05
4,44
1,91
3,03
3,61
1,28
0,87
0,39
0,03
0,29
2,17
R of I
1985-2000
0,22
-23,35
-0,69
-7,74
-11,18
-9,38
-6,34
-5,29
-9,79
-10,67
-7,13
-2,84
0,68
-7,39
-5,32
1,27
1,41
1,38
9,34
-1,95
-1,57
-3,67
-8,37
-7,72
-0,16
Source: ISTAT, Forestry statistics, various years; Agricultural and forestry cultivation, various years; Agriculture, forestry and hunting, various years.
Piemonte
Valle d'Aosta
Lombardy
Trentino-Alto Adige
Veneto
Friuli-Venezia Giulia
Liguria
Emilia-Romagna
Tuscany
Umbria
Marche
Lazio
Abruzzo
Molise
Campania
Puglia
Basilicata
Calabria
Sicily
Sardinia
Italy
- North-West
- North-East
- Centre
- South & Islands
Region
Tab. 31 - Wooded land affected by fire (continued)
Percentage share of wooded land affected by fire in total wooded land
95
134
0,57
0,26
0,12
0,54
0,14
0,12
0,11
0,45
1,46
0,38
0,60
Marche
Lazio
Abruzzo
Molise
Campania
Puglia
Basilicata
Calabria
Sicily
Sardinia
Italy
1,28
1,35
0,69
0,45
1,05
1,24
3,88
0,47
0,34
0,20
0,24
0,73
0,19
1,29
0,71
1,44
1,72
0,96
0,22
0,21
0,65
0,22
0,55
0,01
0,41
1994
1,86
1,59
0,83
0,45
1,39
2,78
4,24
0,54
0,49
0,99
0,25
1,06
0,31
1,47
0,81
2,22
1,87
1,22
0,24
0,59
0,60
0,33
0,59
0,34
0,33
1995
3,28
2,07
1,39
0,57
2,27
3,55
7,10
1,18
0,60
3,46
0,55
1,60
0,65
2,02
1,59
3,92
1,59
2,68
0,40
0,27
0,44
0,34
0,77
1,06
0,35
1996
Year
6,74
3,07
2,17
1,22
4,32
14,12
7,81
5,06
0,96
7,35
1,04
1,00
1,24
3,00
1,64
7,12
2,32
4,29
1,61
0,29
0,70
0,35
0,93
0,38
1,53
1997
4,94
2,09
1,54
0,84
3,12
12,42
5,16
2,87
1,08
4,57
0,76
0,94
0,52
2,52
0,50
5,84
1,25
3,28
1,32
0,16
0,28
0,45
0,00
1,25
1998
9,78
4,36
3,29
2,24
6,36
22,88
9,09
11,64
1,53
8,99
2,37
1,86
1,37
3,36
3,62
8,64
3,97
6,73
2,65
0,33
0,76
0,59
1,22
0,17
3,36
1999
12,48
6,07
4,57
2,86
8,09
30,03
12,68
16,63
2,26
10,56
2,48
3,05
1,81
5,02
7,10
5,74
6,50
9,13
2,59
0,51
1,54
0,90
1,70
0,22
4,17
2000
R of I
49,02
24,93
27,41
32,32
38,43
72,72
31,07
56,99
45,32
75,30
43,01
24,24
41,11
44,74
36,96
26,99
15,95
33,11
45,54
-7,35
16,30
31,40
58,97(a)
21,96
38,96
1993-2000
(a)
Rate of increase (R of I) calculated beginning in 1994
Note:
Source: INEA calculations using Biobank figures, various years; ISTAT, Struttura e produzioni delle aziende agricole, various years; Censimento generale dell'agricoltura, 2003.
0,51
0,85
Umbria
- South & Islands
1,99
Tuscany
1,02
0,93
Emilia-Romagna
- Centre
0,13
Liguria
0,66
0,95
Friuli-Venezia Giulia
0,30
0,46
Veneto
- North-East
0,10
- North-West
0,35
Trentino-Alto Adige
-
0,30
1993
Lombardy
Valle d'Aosta
Piemonte
Region
Tab. 32a - Agricoltura biologica
Tab. 32a - Organic farming
Rapporto percentuale tra la SAU ad agricoltura biologica e la SAU totale
Percentage share of UAA used for organic farming in total UAA
95
135
3.360
3.764
404
4.033
2.425
105
11.221
19.039
3.423
3.107
2.084
580
1.293
899
1.680
670
2.878
22.337
5.135
88.437
7.229
18.083
27.653
35.472
1993
4.598
8
5.997
889
5.715
541
178
11.668
16.322
5.820
3.802
10.276
944
1.763
1.553
2.800
2.010
3.030
59.469
16.737
154.120
10.781
18.813
36.220
88.306
1994
3.694
310
6.395
1.307
5.239
1.505
191
14.837
17.710
8.943
4.346
11.686
1.555
2.520
1.564
14.003
2.882
3.455
65.074
37.277
204.494
10.589
22.888
42.686
128.330
1995
(a)
Rate of increase (R of I) calculated beginning in 1994
Note:
Source: Biobank from figures provided by controlling bodies, various years.
Piemonte
Valle d'Aosta
Lombardy
Trentino-Alto Adige
Veneto
Friuli-Venezia Giulia
Liguria
Emilia-Romagna
Tuscany
Umbria
Marche
Lazio
Abruzzo
Molise
Campania
Puglia
Basilicata
Calabria
Sicily
Sardinia
Italy
- North-West
- North-East
- Centre
- South & Islands
Region
Tab.32b
32b- -Organic
Agricoltura
biologica
Tab.
farming
SAU
ad
agricoltura
biologica
UAA used for organic
farming(ha)
(ha)
Year
3.880
950
8.368
1.437
3.829
706
341
32.710
15.065
15.866
8.594
16.044
3.183
3.824
3.512
49.513
3.650
7.627
107.826
47.248
334.173
13.539
38.682
55.569
226.383
1996
1997
17.933
332
10.321
1.416
6.059
765
1.303
51.151
20.961
27.887
9.625
24.664
6.262
2.432
6.569
105.240
5.736
32.887
122.154
187.451
641.148
29.889
59.391
83.137
468.731
2.458
435
1.122
40.223
11.559
21.638
2.973
20.607
2.692
2.304
4.986
66.110
6.696
18.165
80.560
164.872
466.744
20.466
43.116
56.777
346.385
1998
14.288
1
5.055
1999
38.445
144
13.769
2.508
6.732
924
2.235
82.222
36.887
32.423
21.683
27.409
7.182
4.717
15.501
130.002
9.531
73.291
142.966
304.487
953.058
54.593
92.386
118.402
687.677
2000
44.557
157
17.658
3.715
13.092
1.226
1.624
101.777
55.752
21.073
35.805
36.346
7.772
6.563
14.887
132.932
12.174
92.537
162.486
307.206
1.069.339
63.996
119.810
148.976
736.557
R of I
1993-2000
38,14
52,99(a)
21,31
31,96
15,86
-8,17
40,82
31,74
14,37
25,51
35,74
42,95
38,32
22,51
42,03
72,70
43,69
54,31
28,15
66,77
36,56
31,34
26,66
23,43
46,11
95
136
97
137
74
110
119
107
17
170
1.067
106
4.656
591
1.419
876
1.770
Marche
Lazio
Abruzzo
Molise
Campania
Puglia
Basilicata
Calabria
Sicily
Sardinia
Italy
- North-West
- North-East
- Centre
- South & Islands
1994
174
365
93
133
164
189
27
219
3.545
474
8.597
604
1.639
1.507
4.844
374
3
189
190
617
130
41
702
492
476
338
2
245
219
710
131
50
772
536
756
231
454
151
184
186
383
55
284
3.772
1.171
10.630
633
1.832
1.977
6.186
1995
395
2
407
238
549
122
59
1.277
673
920
Year
331
1.031
254
250
346
2.152
113
529
6.142
1.507
17.297
861
2.186
2.955
11.293
1996
1.074
6
601
264
721
139
119
2.264
743
1.297
421
1.952
449
277
535
4.314
194
1.762
8.326
5.386
30.844
1.794
3.388
4.413
21.243
1997
1.793
6
627
288
699
127
136
3.369
788
1.496
523
1.813
497
313
1.227
4.827
265
4.960
9.598
8.287
41.639
2.556
4.483
4.620
29.974
1998
2.307
6
1.037
425
1.016
175
196
3.870
1.223
1.381
1.037
2.063
584
447
1.678
6.887
338
6.329
9.699
8.490
49.188
3.540
5.486
5.704
34.452
1999
2.996
13
1.225
526
1.249
226
277
4.606
1.619
837
1.736
2.320
639
479
1.779
6.758
434
8.384
9.616
8.285
54.004
4.498
6.607
6.512
36.374
2000
(a)
Rate of increase (R of I) calculated beginning in 1994
Note:
43,42
42,43
30,93
20,19
40,23
67,90
49,93
62,79
31,63
72,43
35,85
28,88
21,20
28,50
45,92
28,66
23,30
28,38 (a)
19,80
10,95
5,70
34,41
28,86
22,42
12,73
R of I
1993-2000
Source: INEA calculations using Biobank figures, various years; ISTAT, Struttura e produzioni delle aziende agricole, various years; Censimento generale dell'agricoltura, 2003.
399
166
124
544
145
26
606
321
321
1993
Piemonte
Valle d'Aosta
Lombardy
Trentino-Alto Adige
Veneto
Friuli-Venezia Giulia
Liguria
Emilia-Romagna
Tuscany
Umbria
Region
Tab.32c
32c- -Organic
Agricoltura
biologica
Tab.
farming
Numeroofdi farms
aziende
chepractice
praticano
l'agricoltura
biologica
Number
that
organic
farming
95
137
1994
11,11
14,16
0,61
0,20
0,14
0,39
1,01
0,38
0,78
0,40
0,83
0,28
0,20
0,70
0,44
2,45
0,46
0,19
1995
18,99
17,41
0,76
49,56
2,14
0,44
0,76
2,45
9,12
2,99
1,18
3,37
0,10
0,52
2,11
3,59
1,44
4,81
9,99
9,06
4,90
1,29
1996
21,90
25,69
3,16
48,69
3,35
0,83
1,50
4,01
13,53
4,87
3,04
6,08
0,24
0,89
1,49
4,68
0,63
6,98
5,02
7,00
12,77
10,26
7,91
3,33
1997
25,44
49,32
10,68
50,61
5,97
7,50
2,39
6,11
21,84
7,18
5,10
10,59
0,49
1,30
0,28
4,67
13,00
3,65
10,27
8,55
10,82
18,83
12,88
12,66
6,47
Year
1998
30,60
61,68
14,18
0,48
8,08
5,30
16,20
13,42
29,09
11,66
12,40
16,10
2,40
2,45
1,36
6,06
23,03
9,84
14,05
18,12
15,57
23,65
16,19
19,12
11,13
1999
33,92
60,98
20,25
45,48
7,86
6,63
17,03
18,57
35,46
31,47
15,48
16,12
4,93
2,48
4,17
13,27
22,99
12,28
12,70
21,95
18,84
27,96
18,12
24,71
13,70
2000
29,04
66,20
20,91
51,31
10,72
7,52
22,45
20,07
29,56
28,14
17,54
22,86
5,66
4,14
5,13
17,73
25,14
14,73
17,04
27,54
20,81
26,27
20,82
24,90
17,02
R of I
1994-2000
7,33(a)
29,05
73,77(a)
20,19
50,76
68,26
106,35
75,84
21,66(a)
60,75
72,82
61,93
96,31(a)
39,64
106,71(c)
64,00(b)
62,83
87,54(b)
79,84
102,27
62,35
79,38
35,75
76,84
90,69
Rate of increase (R of I) calculated beginning in 1997
(c)
Rate of increase (R of I) calculated beginning in 1996
Rate of increase (R of I) calculated beginning in 1995
(b)
(a)
Note:
Source: INEA calculations using AGEA figures, various years; ISTAT, Struttura e produzioni delle aziende agricole, various years; Censimento generale dell'agricoltura, 2003.
Piemonte
Valle d'Aosta
Lombardy
Trentino-Alto Adige
Veneto
Friuli-Venezia Giulia
Liguria
Emilia-Romagna
Tuscany
Umbria
Marche
Lazio
Abruzzo
Molise
Campania
Puglia
Basilicata
Calabria
Sicily
Sardinia
Italy
- North-West
- North-East
- Centre
- South & Islands
Region
Tab. 33a
33a- -Agri-environmental
Misure agroambientali
Tab.
measures
Rapporto percentuale
tra la
SAU interessata
da misure agroambientali
SAUUAA
totale
Percentage
share of UAA
affected
by agri-environmental
measureseinlatotal
95
138
2.680
102.942
10.451
67.301
12.384
12.806
Sardinia
Italy
- North-West
- North-East
- Centre
- South & Islands
Rate of increase (R of I) calculated beginning in 1997
(c)
Rate of increase (R of I) calculated beginning in 1996
Rate of increase (R of I) calculated beginning in 1995
(b)
(a)
Note:
Source: INEA calculations using AGEA figures, various years.
10.337
56.800
5.323
503
114
4.675
4.092
2.054
6.238
960
4.870
4.296
1994
Piemonte
Valle d'Aosta
Lombardy
Trentino-Alto Adige
Veneto
Friuli-Venezia Giulia
Liguria
Emilia-Romagna
Tuscany
Umbria
Marche
Lazio
Abruzzo
Molise
Campania
Puglia
Basilicata
Calabria
Sicily
Region
19.321
706.042
237.571
248.558
131.347
88.566
1995
212.600
16.108
8.252
198.999
18.798
1.112
611
29.649
86.188
12.050
6.348
26.761
492
1.246
12.377
55.130
Tab.33b
33b- Agri-environmental
- Misure agroambientali
Tab.
measures
SAUaffected
interessata
da misure agroambientali
(ha) (ha)
UAA
by agri-environmental
measures
66.794
1.032.303
304.178
285.680
212.395
230.050
1996
245.606
22.946
34.352
205.116
29.416
2.160
1.274
48.988
127.848
19.730
16.466
48.351
1.158
2.133
21.388
28.566
4.087
105.924
113.525
1.604.663
461.043
351.677
342.228
449.715
1997
297.517
42.967
118.627
207.439
51.856
19.507
1.932
72.875
197.055
28.137
30.028
87.008
2.472
3.154
1.779
66.800
77.590
23.695
160.700
Year
240.572
2.330.023
577.048
454.351
518.715
779.909
1998
350.845
53.390
159.024
204.164
71.425
14.328
13.789
164.434
270.008
43.184
73.953
131.570
12.446
5.995
8.923
87.717
142.517
62.292
219.447
292.201
2.825.728
681.771
508.507
671.669
963.781
1999
388.266
51.337
227.795
194.028
69.424
18.288
14.373
226.767
329.552
118.073
92.638
131.406
25.798
6.264
27.313
191.807
143.418
77.360
199.620
281.742
2.748.914
587.983
545.628
610.790
1.004.513
2000
310.252
47.128
216.549
212.611
91.448
17.969
14.054
223.600
253.496
103.330
88.407
165.557
24.289
8.908
30.800
223.200
135.191
81.983
218.400
94,45
59,88
77,84
34,85
74,53
86,49
R of I
1994-2000
6,50 (a)
24,20
72,38 (a)
20,75
50,12
66,67
98,93
73,76
19,70 (a)
58,61
71,16
59,74
91,53 (a)
37,47
103,98(c)
59,84(b)
60,77
82,16(b)
75,28
139
1982
47,99
30,65
48,71
30,04
49,68
34,73
21,32
57,59
43,06
49,46
58,71
51,01
51,32
57,76
52,16
78,78
62,70
47,98
65,92
59,42
52,57
44,81
46,30
48,94
61,12
1990
44,10
29,60
46,28
31,04
47,90
32,69
17,06
55,71
40,34
46,85
56,65
48,40
48,42
56,49
48,73
75,10
62,45
43,99
62,19
56,38
49,93
41,65
45,06
46,37
57,98
Year
2000
42,05
21,82
43,41
30,46
46,35
30,39
11,55
50,38
37,30
43,42
51,99
42,02
39,84
48,44
44,15
65,03
53,80
36,90
49,85
42,46
43,85
38,62
42,27
42,02
47,97
R of I
1982-2000
-0,69
-1,77
-0,60
0,07
-0,36
-0,70
-3,18
-0,70
-0,75
-0,68
-0,64
-1,01
-1,32
-0,92
-0,87
-1,00
-0,80
-1,37
-1,46
-1,75
-0,95
-0,78
-0,48
-0,80
-1,27
Source: INEA calculations using ISTAT figures, Censimento generale dell'agricoltura, various years.
Piemonte
Valle d'Aosta
Lombardy
Trentino-Alto Adige
Veneto
Friuli-Venezia Giulia
Liguria
Emilia-Romagna
Tuscany
Umbria
Marche
Lazio
Abruzzo
Molise
Campania
Puglia
Basilicata
Calabria
Sicily
Sardinia
Italy
- North-West
- North-East
- Centre
- South & Islands
Region
Tab.34
34- -Utilised
Superficie
agricolaArea
utilizzata
Tab.
Agricultural
Percentage share of UAA in total territory
140
20,81
20,30
20,31
43,49
13,10
18,86
50,22
16,08
35,80
25,19
14,01
20,74
18,19
14,84
20,36
4,51
16,92
25,67
4,90
13,32
19,40
23,32
21,57
26,20
13,24
1960
23,45
22,09
20,37
43,75
14,12
21,05
51,80
16,15
37,81
29,75
15,18
21,02
18,61
14,76
20,44
4,72
16,99
26,52
7,28
13,59
20,45
24,76
22,23
27,93
13,97
1970
21,09
24,63
22,83
28,25
15,14
23,47
23,15
19,80
44,29
14,26
21,80
52,25
17,11
37,68
30,73
16,04
21,33
19,73
15,64
20,33
4,94
18,36
28,12
8,09
16,32
Year
1980
26,13
23,95
20,70
45,79
14,76
23,29
53,12
18,20
38,72
31,26
16,46
22,16
20,94
15,94
21,27
6,00
19,17
31,80
8,29
19,69
22,43
26,29
23,88
29,05
16,74
1990
22,74
26,41
24,13
29,09
17,31
26,39
23,92
20,68
46,45
14,80
23,73
53,19
18,29
38,78
31,25
16,51
22,19
21,08
16,00
21,28
6,02
19,20
31,86
8,61
22,10
2000
0,77
0,53
0,06
0,21
0,39
0,74
0,19
0,42
0,26
0,70
0,53
0,22
0,48
0,24
0,14
0,93
0,41
0,70
1,83
1,65
0,51
0,40
0,36
0,34
0,87
R of I
1960-2000
Source: INEA calculations using ISTAT figures, Statistiche forestali, various years; Dati sulla superficie e le utilizzazioni forestali
(data on-line); Annuario statistico, 2003.
Piemonte
Valle d'Aosta
Lombardy
Trentino-Alto Adige
Veneto
Friuli-Venezia Giulia
Liguria
Emilia-Romagna
Tuscany
Umbria
Marche
Lazio
Abruzzo
Molise
Campania
Puglia
Basilicata
Calabria
Sicily
Sardinia
Italy
- North-West
- North-East
- Centre
- South & Islands
Region
Tab.35a
35a- Afforestation
- Indice di boscosità
Tab.
index
Rapporto percentuale tra la superficie forestale e la superficie territoriale
Percentage
share of wooded land in total territory
141
1960
528.500
66.241
484.599
591.704
241.075
148.242
272.282
355.647
823.112
212.972
135.815
357.400
195.753
65.854
276.637
87.386
169.126
387.096
126.061
320.779
5.846.281
1.351.622
1.336.668
1.529.299
1.628.692
1970
595.592
72.072
486.079
595.302
259.863
165.453
280.854
357.279
869.454
251.563
147.128
362.248
200.344
65.490
277.792
91.397
169.795
399.955
187.191
327.273
6.162.124
1.434.597
1.377.897
1.630.393
1.719.237
Year
1980
596.239
75.549
472.549
602.712
262.284
171.304
283.251
378.535
866.370
259.858
155.514
367.680
212.323
69.394
276.356
95.542
183.469
424.070
208.109
393.194
6.354.302
1.427.588
1.414.835
1.649.422
1.862.457
1990
663.748
78.152
493.872
623.081
271.646
183.014
288.006
402.618
890.260
264.363
159.542
381.892
225.415
70.757
289.050
116.118
191.602
479.517
213.059
474.382
6.760.094
1.523.778
1.480.359
1.696.057
2.059.900
2000
670.300
78.048
493.523
632.032
272.359
186.457
288.395
404.522
891.601
264.240
160.075
382.492
226.825
71.022
289.154
116.529
191.913
480.511
221.386
532.424
6.853.808
1.530.266
1.495.370
1.698.408
2.129.764
Source: ISTAT, Statistiche forestali, various years; Dati sulla superficie e le utilizzazioni forestali (data on-line).
Piemonte
Valle d'Aosta
Lombardy
Trentino-Alto Adige
Veneto
Friuli-Venezia Giulia
Liguria
Emilia-Romagna
Tuscany
Umbria
Marche
Lazio
Abruzzo
Molise
Campania
Puglia
Basilicata
Calabria
Sicily
Sardinia
Italy
- North-West
- North-East
- Centre
- South & Islands
Region
Tab.35b
35b- -Wooded
Superficie
Tab.
landforestale
Estensione
superficie
Extension
of della
wooded
land forestale
Variation
1960/2000
26,83
17,82
1,84
6,82
12,98
25,78
5,92
13,74
8,32
24,07
17,86
7,02
15,87
7,85
4,52
33,35
13,47
24,13
75,62
65,98
17,23
13,22
11,87
11,06
30,77
95
142
112.492
63.895
135.048
498.351
122.254
43.004
46.266
28.993
82.719
12.765
10.455
18.853
13.240
3.739
15.308
30.532
27.342
100.586
31.517
43.128
1.440.487
357.701
692.602
124.792
265.392
Resinose
Fustaie
Resinose e
Latifoglie
latifoglie
consociate
106.811
12.294
2.398
3.699
62.259
10.559
2.287
44.754
15.565
9.382
35.152
45.250
35.894
5.241
50.772
16.859
112.717
16.432
8.343
4.685
6.075
13.504
73.482
5.634
75.304
15.237
14.474
2.869
79.626
6.240
15.637
5.238
85.103
10.760
169.211
33.238
36.625
72.957
178.301
28.311
1.166.036
363.143
207.362
31.793
103.776
116.245
200.617
40.255
654.281
174.850
Source: ISTAT, Statistiche agricole e forestali, 2002.
Piemonte
Valle d'Aosta
Lombardy
Trentino-Alto Adige
Veneto
Friuli-Venezia Giulia
Liguria
Emilia-Romagna
Tuscany
Umbria
Marche
Lazio
Abruzzo
Molise
Campania
Puglia
Basilicata
Calabria
Sicily
Sardinia
Italy
- North-West
- North-East
- Centre
- South & Islands
Region
231.597
69.992
207.866
545.392
147.201
123.406
87.401
96.624
211.868
25.793
30.034
97.969
103.781
21.082
101.174
51.407
123.205
303.035
141.099
249.740
2.969.666
596.856
912.623
365.664
1.094.523
Totale fustaie
Tab.35c
35c- -Wooded
Superficie
pertimber
tipo di bosco
Tab.
landforestale
by type of
Superficie
forestale
secondo
la tipologia
di 2000
bosco, anno 2000
Wooded land according to type
of timber,
292.365
4.716
178.145
79.649
98.264
36.361
155.770
291.528
397.169
195.073
118.526
238.249
76.195
24.498
173.019
47.621
52.972
134.396
66.655
173.095
2.834.266
630.996
505.802
949.017
748.451
Cedui
semplici
146.338
3.340
107.512
6.979
26.850
26.650
41.285
16.370
183.553
43.374
11.376
27.829
46.446
25.442
8.760
2.389
3.394
31.987
9.297
14.505
783.676
298.475
76.849
266.132
142.220
Cedui
composti
Cedui
438.703
8.056
285.657
86.628
125.114
63.011
197.055
307.898
580.722
238.447
129.902
266.078
122.641
49.940
181.779
50.010
56.366
166.383
75.952
187.600
3.617.942
929.471
582.651
1.215.149
890.671
Totale cedui
44
40
3.939
99.011
139
18.445
403
6.201
15.112
12.342
11.093
4.335
95.084
266.188
3.939
84
117.595
144.570
Macchia
mediterranea
670.300
78.048
493.523
632.032
272.359
186.457
288.395
404.522
891.601
264.240
160.075
382.492
226.825
71.022
289.154
116.529
191.913
480.511
221.386
532.424
6.853.808
1.530.266
1.495.358
1.698.408
2.129.764
Totale
143
1982
11,63
2,22
4,46
11,64
15,58
9,97
20,82
17,40
14,96
7,02
8,94
15,40
11,60
5,89
27,37
20,58
6,84
19,55
24,03
7,66
14,59
8,47
15,30
12,74
17,13
Year
1990
11,02
1,72
4,13
11,19
15,18
8,97
17,34
17,97
12,35
5,91
8,03
14,76
13,04
5,50
26,84
19,78
6,80
18,56
24,71
6,51
14,05
7,74
15,24
11,27
16,77
2000
9,85
1,96
4,04
11,41
14,12
9,30
11,38
17,46
10,82
5,29
6,57
12,06
12,45
4,96
22,77
17,00
6,58
15,58
22,20
5,42
12,47
6,95
14,68
9,48
14,84
R of I
1982-2000
-0,87
-0,67
-0,52
-0,10
-0,52
-0,36
-3,13
0,02
-1,69
-1,48
-1,60
-1,28
0,38
-0,90
-0,97
-1,00
-0,20
-1,19
-0,42
-1,80
-0,82
-1,03
-0,22
-1,54
-0,75
Source: INEA calculations using ISTAT figures, Censimento generale dell'agricoltura, various years.
Piemonte
Valle d'Aosta
Lombardy
Trentino-Alto Adige
Veneto
Friuli-Venezia Giulia
Liguria
Emilia-Romagna
Tuscany
Umbria
Marche
Lazio
Abruzzo
Molise
Campania
Puglia
Basilicata
Calabria
Sicily
Sardinia
Italy
- North-West
- North-East
- Centre
- South & Islands
Region
Tab. 36 - Intensification
Tab. 36 -Percentage
Intensificazione
share of UAA affected by intensive cultivation (potatoes,
Rapporto percentuale tra la SAU investita a colture intensive (patata, ortive,
vegetables,
grapes, citrus, fruit) in total UAA
g m f
)
144
88,20
28,44
32,03
62,14
140,33
124,70
878,99
44,09
41,36
37,14
48,87
121,22
205,10
89,88
407,44
79,03
30,62
134,01
101,35
12,14
70,12
62,84
80,70
61,24
73,07
1982
64,08
26,44
24,37
58,58
126,68
100,45
872,94
33,23
38,19
35,74
43,57
122,60
176,43
68,84
400,80
78,43
29,24
132,20
90,20
12,81
64,06
49,11
67,75
58,61
70,25
Year
1990
26,23
20,27
9,86
54,08
91,01
41,82
474,94
18,36
36,63
38,02
32,31
122,17
123,00
64,61
366,70
102,52
37,76
158,38
104,54
18,81
58,24
22,07
44,73
54,76
85,52
2000
R of I
-6,18
-1,77
-6,01
-0,73
-2,25
-5,59
-3,19
-4,51
-0,64
0,12
-2,15
0,04
-2,66
-1,72
-0,55
1,38
1,11
0,88
0,16
2,33
-0,97
-5,36
-3,06
-0,59
0,83
1982-2000
Source: INEA calculations using ISTAT figures, Censimento generale dell'agricoltura, various years.
Piemonte
Valle d'Aosta
Lombardy
Trentino-Alto Adige
Veneto
Friuli-Venezia Giulia
Liguria
Emilia-Romagna
Tuscany
Umbria
Marche
Lazio
Abruzzo
Molise
Campania
Puglia
Basilicata
Calabria
Sicily
Sardinia
Italy
- North-West
- North-East
- Centre
- South & Islands
Region
Tab. 37 - Concentration
Tab. 37 - Concentrazione
Ratio of number of farms with <5 ha UAA to number of farms with >50
Rapporto tra il numero di aziende con SAU < 5 ha e il numero di aziende c
ha UAA
> 0
5
145
10,58
0,00
21,10
1,45
18,20
17,08
7,00
6,42
11,27
4,78
8,22
7,06
1,81
2,65
5,70
0,64
2,69
10,69
1,56
9,27
8,11
14,91
10,40
8,45
4,20
Filari di alberi, siepi
(m/ha)
2,96
0,00
12,19
1,46
22,53
14,04
0,00
20,04
19,15
15,32
19,71
10,43
1,57
7,16
14,92
0,51
10,49
9,62
1,35
6,43
10,04
6,99
17,42
16,12
5,18
Boschetti, macchie di
campo
(m 2/ha)
40,58
11,12
42,96
6,93
87,71
79,59
0,16
82,99
48,41
14,28
36,01
23,42
8,97
6,99
10,82
0,63
3,39
7,18
1,41
3,10
28,72
39,22
72,56
33,49
3,90
Fossi, capezzagne
(m/ha)
12.126.999
386
23.654.538
621.170
16.079.731
4.619.275
596.090
7.872.079
10.459.318
1.771.315
4.906.351
5.772.660
937.588
646.793
3.728.723
933.715
1.662.844
6.768.900
2.429.392
12.311.988
117.899.855
36.378.013
29.192.255
22.909.644
29.419.943
Filari di alberi, siepi
(m)
Source: INEA calculations using ISTAT figures, Struttura e produzioni delle aziende agricole - 1998.
Piemonte
Valle d'Aosta
Lombardy
Trentino-Alto Adige
Veneto
Friuli-Venezia Giulia
Liguria
Emilia-Romagna
Tuscany
Umbria
Marche
Lazio
Abruzzo
Molise
Campania
Puglia
Basilicata
Calabria
Sicily
Sardinia
Italy
- North-West
- North-East
- Centre
- South & Islands
Region
3.399.088
13.666.296
626.070
19.909.311
3.798.930
24.560.085
17.776.281
5.673.860
11.756.690
8.521.280
813.613
1.750.970
9.764.740
744.500
6.491.880
6.090.850
2.102.900
8.536.500
145.983.844
17.065.384
48.894.396
43.728.111
36.295.953
Boschetti, macchie di
campo
(m 2)
Tab.38
38- -Man-made
Manufatti and
ed elementi
di naturalità
Tab.
natural elements
Rapporto
percentuale
tra
l'estensione
degli elementi
di naturalità
e dei manufatti
e la SAU
Percentage share of the extension
of man-made
and
natural elements
in UAA
46.532.399
962.216
48.167.589
2.965.335
77.500.792
21.529.925
14.000
101.691.545
44.932.565
5.291.145
21.483.330
19.135.226
4.645.894
1.707.582
7.081.560
909.869
2.096.524
4.544.340
2.206.038
4.117.580
417.515.454
95.676.204
203.687.597
90.842.266
27.309.387
Fossi, capezzagne
(m)
APPENDIX 2
METHODOLOGY
SOCIAL DIMENSION
1. Agricultural employment
Description: the indicator is the percentage share of people employed in agriculture to total employed.
Calculation is also made of the average annual rate of variation from 1991 to 2000.
Period: annually from 1991 to 2000.
Source: ISTAT, Forze di lavoro, various years.
2. Ageing index for farmers
Description: the indicator is calculated as the percentage share of the number of farmers over age
65 in total number of farmers.
Calculation is also made of the average annual rate of variation from 1993 to 2000.
Period: 1993, 1995, 1996, 1997, 1998, 1999, 2000.
Source: ISTAT, Struttura e produzioni delle aziende agricole, various years; Censimento generale
dell’agricoltura, 2003.
3. Educational level of farmers
Description: the indicator is calculated as percentage breakdown of farmers by level of education,
indicated by type of study completed: university, high school, middle school, elementary school, no
certificate.
Period: 1990, 1995, 1997, 1998, 1999.
Source: ISTAT, Struttura e produzioni delle aziende agricole, various years.
4. Breakdown of workers in agriculture
Description: the indicator gives the difference between the rate of men employed (ratio between
men employed in agriculture to total workers in agriculture) and the rate of women employed (ratio
between women employed in agriculture to total workers in agriculture).
Calculation is also made of the percentage of variation from 1991 to 2000.
Period: annually from 1991 to 2000.
Source: ISTAT, Annuario statistico italiano, various years.
5. Resident population in rural municipalities
Description: the indicator is calculated as the percentage share of resident population in rural
municipalities in total population.
Rural municipalities are defined as those with population density of less than 100 inhabitants per
sq.km., or a percentage share of agricultural employment higher than 12.5 (twice the European
Community average) as of the 1991 census. The number of municipalities thus remains fixed for
the period under consideration.
Calculation is also made of the average annual rate of variation from 1991 to 2001.
Period: annually from 1991 to 2001.
Source: ISTAT, Movimento anagrafico dei comuni, various years.
148
ECONOMIC DIMENSION
6. Profitability of labour
Description: the indicator, expressed in thousands of 1995 eurolira, is obtained by calculating the
ratio of value added of agriculture, forestry and fishing, at basic prices, to work units in agriculture.
Calculation is also made of the average annual rate of variation from 1995 to 2001.
Period: annually from 1995 to 2001.
Source: ISTAT, Conti economici territoriali, various years.
7. Profitability of land
Description: the indicator, expressed in thousands of 1995 eurolira, is obtained by calculating the
ratio of value added from agriculture, at basic prices, to Utilised Agricultural Area.
Calculation is also made of the average annual rate of variation from 1988 to 2001.
Period: annually from 1988 to 2001.
Source: ISTAT, Conti economici territoriali, various years; Censimento generale dell'agricoltura,
1993, 2003; Struttura e produzioni delle aziende agricole, various years.
8. Productivity of labour
Description: the indicator, expressed in thousands of 1995 eurolira, gives the ratio of production in
agriculture, hunting and forestry to work units in agriculture.
Calculation is also made of the average annual rate of variation from 1980 to 2001.
Period: annually from 1980 to 2001.
Source: ISTAT, Conti economici territoriali, various years.
9. Productivity of land
Description: the indicator, expressed in thousands of 1995 eurolira, gives the ratio of the value of
agricultural production to Utilised Agricultural Area.
Calculation is also made of the average annual rate of variation from 1982 to 2000.
Period: 1982, 1990, 2000.
Source: ISTAT, Conti economici territoriali, various years; Censimento generale dell'agricoltura,
various years.
10. Marginalisation
Description: the indicator is the percentage share of the number of farms with both Utilised Agricultural Area of less than five hectares and fewer than four European Size Units, to total number of farms
European Size Unit is a multiple of the ecu and is used to measure the Standard Gross Margin
attributed to farms. ISTAT uses an average for the years 1993, 1994 and 1995, by which 1 ESU =
1,200 ecu = approximately 1,200 euro.
Calculation is also made of the average annual rate of variation from 1995 to 1999.
Period: 1995, 1997, 1998, 1999.
Source: ISTAT, Struttura e produzioni delle aziende agricole, various years.
11. Diversification in farm holders’ activities
149
Description: the indicator is a percentage breakdown of farms by the amount of time the farm holder works on the farm.
Period: 1993, 1995, 1996, 1997, 1999.
Source: ISTAT, Struttura e produzioni delle aziende agricole, various years.
12. Share of agricultural value added in total value added
Description: the indicator is the percentage share of value added of agriculture, forestry and fishing
in total value added, both expressed at basic prices.
Calculation is also made of the average annual rate of variation from 1995 to 2001.
Period: annually from 1995 to 2001.
Source: ISTAT, Conti economici territoriali, various years.
13. Fixed investments in agriculture
Description: the indicator, expressed in thousands of 1995 eurolira, is the sum of gross fixed
investments in agriculture.
Calculation is also made of the average annual rate of variation from 1995 to 2001.
Period: annually from 1995 to 2001.
Source: ISTAT, Conti economici territoriali, various years.
ENVIRONMENTAL DIMENSION
14. Herd density
Description: the indicator is the ratio of adult Livestock Units (LU) to Utilised Agricultural Area.
The Livestock unit (LU) is a unit used to compare or to aggregate numbers of animals of different
species or categories. By definition, a cow weighting 600 kg and producing 3000 litres of milk per
year = 1 LU. Equivalences based on the food requirements of the animals are defined (horses:
0.6; pigs: 0.3; sheep-goats: 0.1; poultry: 0.7).Calculation is also made of the average annual rate of
variation from 1970 to 2000.
Period: 1970, 1982, 1990, 2000.
Source: ISTAT, Censimento generale dell'agricoltura, various years.
15. Livestock
Description: the indicator shows the percentage breakdown of livestock by type of breed (poultry,
sheep-goats, pigs, horses, cattle).
Period: 1970, 1982, 1990, 2000.
Source: ISTAT, Censimento generale dell'agricoltura, various years.
16. Phosphorus balance
Description: the indicator, expressed in kg of phosphorus/ha/year, is calculated considering applications of mineral and organic fertilisers, minus the amount retained by the plant, as indicated
below:
Phosphorus balance = (P synthetic fertilisers (1) + P livestock effluents (2) + P of seeds (3) – P
150
removed by farming (4) – P removed by grazing (5)) / UAA (6)
Where:
(1) amount of phosphorus in mineral fertilisers distributed;
(2) amount of phosphorus contained in livestock effluents applied to land, calculated by specific
regional productive system (length of production cycle, final animal weight, feeding of animals
etc) and the demographic flux of livestock animals;
(3) amount of phosphorus contained in seeds distributed on land;
(4) amount of phosphorus absorbed by crops (cereal production, industrial crops, oils, protein
crops, fruits and vegetables,…);
(5) amount of phosphorus removed by grazing (meadows, fields and pastures)
(6) Utilised Agricultural Area (arable land, permanent grasslands, pastures, permanent crops)
Geographical level of detail: by square km, regional
Calculation is also made of the percentage of variation from 1994 to 2000.
Period: 1994, 1998, 2000.
Source: ELBA model (Environmental Liveliness and Blent Agriculture), University of Bologna.
17. Use of plant protection products
Description: the indicator, expressed in kg/ha of treatable area, is the ratio of the amount of plant
protection products (or active ingredients contained in plant protection products) distributed for
agricultural use to treatable area.
Figures refer to plant protection products classified by toxicity (highly toxic, toxic, noxious, not classifiable) and their content of active ingredients.
Plant protection products were classified by ISTAT in 1997. Comparisons with previous years are
possible, by referring to the following correspondence table:
1997 Classification
Classification previous to 1997
Insecticides and acaracides
Insecticides + rodenticides
Fungicides
Herbicides
Other
Fungicides
Weedkillers
Fumigant nematocides +
Poisoned baits +
Plant hormones +
Plant nutrition supplements
ISTAT also reclassified levels of toxicity, so without simplifying it is not possible to make comparisons previous to 1997.
Treatable surface is the sum of lands designated as: arable crops (excluding fallow ground); permanent crops (excluding canebrakes); permanent grasslands (excluding pastures); family market
gardens.
Calculation is also made of the percentage variation from 1997 to 2000.
Period: annually from 1997 to 2000.
Source: ISTAT, Statistiche dell'Agricoltura, Statistiche ambientali, Dati congiunturali sui mezzi di
produzione (data on-line).
151
18. Methane emissions (CH4)
Description: the indicator, expressed in tonnes, gives the amount of methane emitted in the agriculture sector.
In calculating methane emissions, consideration was made of: a) amount emitted during rumination of animals in production (by species and feed breakdown); b) amount emitted per ha of rice
paddies (by cultivation technique).
Calculation is also made of the percentage variation from 1994 to 2000.
Period: 1994, 1997, 1998, 2000.
Source: ELBA model (Environmental Liveliness and Blent Agriculture), University of Bologna.
19. Ammonia emissions (NH3)
Description: the indicator, expressed in tonnes, gives the amount of ammonia (as discharge of
nitrogen in the form of ammonia) emitted in the agriculture sector.
Calculations were made using the following scheme:
NH3 emissions = Emissions from stalling-sheltering of livestock (1) + Emissions from livestock
pasturing (2) + Emissions from storage of livestock effluents (3) + Emissions from spreading of
livestock effluents (4) + Emissions from mineral nitrogen fertiliser (5).
(1) Nitrogen discharge during stalling and/or sheltering of livestock (by species and production
system, especially feeding).
(2) Nitrogen discharge from keeping livestock in the open (by species and production system,
especially feeding).
(3) Nitrogen discharge from storing livestock effluents (by system used and time of storage).
(4) Nitrogen discharge from spreading livestock effluents (by system employed).
The indicator does not take into account item (5).
Calculation is also made of the percentage variation from 1994 to 2000.
Period: 1994, 1997, 1998, 2000.
Source: ELBA model (Environmental Liveliness and Blent Agriculture), University of Bologna.
20. Carbon dioxide emissions (CO2)
Description: the indicator, expressed in tonnes, gives the amount of carbon dioxide emitted in the
agriculture sector.
In estimating emissions of CO2 from agricultural diesel fuel combustion, IPCC methodology was
used, as described in the three volumes Revised 1996 IPCC “Guidelines for National Greenhouse
Gas Inventories”.
The amount of diesel fuel used in agriculture is estimated by using figures that show average diesel fuel consumption (litres of diesel fuel/ha) for crop operations and mechanised farm operations.
The calculation uses the following equation:
t CO2 = (((((Litres of diesel fuel per agri-livestock activity/density of diesel fuel)/10^6)* NCV conversion factor (net calorific value)) * factor of carbon emission from diesel fuel) * fraction of oxidised
carbon in diesel fuel)*44/12
Figures on diesel fuel consumption in agriculture are taken from consumption forecast tables in the
Decree of the Ministry for Agricultural and Forestry Policies dated 26 February 2002.
Information on crop cultivation is taken from good farming practice guidelines issued by the Emilia
Romagna region.
Figures for Utilised Agricultural Area and herd numbers come from the ELBA model.
152
Period: 1994, 1998.
Source: ELBA model (Environmental Liveliness and Blent Agriculture), University of Bologna.
21. Direct use of energy
Description: the indicator is the ratio of amount of energy consumed in agriculture (expressed in
Giga Joules) to Utilised Agricultural Area.
To determine the level of direct energy consumption, examination was made of consumption of
fuels and lubricating oils per hectare of Utilised Agricultural Area.
The following processing method was used:
- consideration was made of the quantity and values reported for “lubricants” and “fuels” in the
RL0110YU.DBF accounting archives at CONTINEA for 1998-2000;
- then the ratio was figured between quantity and value reported for each individual piece of equipment to calculate the average purchase price;
- fuel prices were then compared to average prices reported on Internet sites for the period of reference (1998-2000) and with prices directly quoted by regional FADN offices;
- Regional FADN offices checked those fuel prices that were below 500 lira per litre and higher
than 2,400 lira per litre;
- Regional FADN offices checked those lubricating oil prices that were below 2,400 lira per kg and
higher than 50,000 lira per kg (probably special hydraulic oils);
- Once the information about farms surveyed was inserted into the database, the sample of fuels
was divided into “gasoline” and “diesel fuel”, and gasoline amounts were multiplied by 5.53 and
diesel amounts by 5.15. These two figures (expressed in GJ per Q) are taken from the reference
table of input energy units. The fuel sample was divided in the following manner: where the type
of fuel was explicit, the entry was left as is; where the type was not specified, but listed generically as “fuel”, the entry “diesel” was used for fuel priced at less than 1.400 lira per litre, and
“gasoline” was used otherwise;
- Once the farm figures were checked, the sample amounts of lubricating oils were multiplied by
8.37 (transformation coefficient in GJ per Q);
- Figures were stratified by area.
For the period under consideration, figures for regions of the North-East are not available.
In calculating the indicator, the lira was used as a reference currency, since CONTINEA began
gathering economic data in euro beginning with the accounting year 2002, when the euro went
into effect. However, the figures in the summary table are converted into euro.
Calculation is also made of the percentage variation from 1998 to 2000.
Period: 1998, 1999, 2000.
Source: FADN, various years.
22. Nitrogen balance
Description: the indicator, expressed in kg/ha of UAA, is the ratio of the difference between inputs
and uptakes of nitrogen to Utilised Agricultural Area.
The indicator is elaborated using the ELBA model (Environmental Liveliness and Blent Agriculture),
University of Bologna, and calculated using the scheme devised by OECD (Soil Surface Nutrients
Balance).
Nitrogen balance = (amount of nitrogen distributed with mineral fertilisers (1) + nitrogen contained
in livestock effluents (2) + nitrogen from rainfall (3) + biological nitrogen fixation (4) + material from
153
sowing and planting (5) – nitrogen loss from crops (6) – nitrogen loss from fodder crops (7)/Utilised
Agricultural Area (8)
Item (5) of the above scheme is not included in calculations for the indicator.
Calculation is also made of the percentage variation from 1994 to 2000.
Period: 1994, 1997, 1998, 2000.
Source:
(1) Amount of nitrogen distributed, contained in mineral fertilisers: ISTAT.
(2) Amount of nitrogen contained in livestock effluents applied to land, calculated by specific regional production system (length of production cycle, final weight, feed,…) and flux of livestock:
ELBA model.
(3) Amount of nitrogen from rainfall (mg of nitrogen/ mm of rainfall): ITA Consortium, Ministry for
Agricultural and Forestry Policies and ELBA model.
(4) Amount of nitrogen fixation from micro-organisms in relation to type of crop: National Institute
for Plant Nutrition.
(6) Amount of nitrogen taken up by crops (cereals, industrial crops, oil-seed crops, protein crops,
fruits and vegetables,…): ISTAT and ELBA model.
(7) Amount of nitrogen taken up by fodder crops (production from herbage, meadows and pastures): ISTAT and ELBA model.
(8) Utilised Agricultural Area (arable land, permanent grasslands and pastures, permanent crops):
ISTAT and DG REGIO.
23. Potential leaching of nitrates
Description: the indicator, expressed in kg/ha of UAA, is the ratio of amount of leached nitrogen to
UAA.
This indicator, elaborated on a regional basis, was first calculated in 2004; therefore no references
exist for previous years.
The amount of nitrates potentially subject to leaching is estimated by the ELBA model (Environmental Liveliness and Blent Agriculture), University of Bologna, based on a balance of inputs and
requirements in the whole cultivation cycle:
Nitrogen requirements (kg/ha) = N_UPTK(kg/ha) – N_AVA (kg/ha)
Where:
- N_UPTK = nitrogen taken up by planting, calculated based on average production per hectare
and uptake capacity of the crop;
- N_AVA = nitrogen available for crops during their growth cycle, and deriving from different sources of organic and inorganic fertilisers = nitrogen present in the soil at the beginning of the crop
cycle (1) + available nitrogen caused by mineralization of the organic matter present in the soil (2)
+ nitrogen derived from residue of previous plantings(1) (3) + nitrogen derived from residual effects
of organic fertilisation in previous years (4).
Nitrogen contributions are calculated with the exclusion of use in the flower and garden sector;
uptakes do not include losses by volatisation.
The amount of potentially leached nitrogen is calculated based on crop (land cover), winter rainfall,
farming practices and amount of nitrogen immediately available for crops. In winter, the amount
washed out is estimated based on rainfall:
- With rainfall below 150 mm: no loss of available nitrogen;
- With rainfall between 150 and 250 mm: 50% loss of available nitrogen (2);
- With rainfall greater than 250 mm: 100% loss of available nitrogen (2).
154
(1)
Not considered in calculation
Period: 2000.
Source: ELBA model (Environmental Liveliness and Blent Agriculture), University of Bologna; land
use of 1-sq.km. unit for all agricultural land in Italy, climatic data and soil profile figures: ITA Consortium.
24. Fertiliser use
Description: the indicator, expressed in kg/ha of fertilisable land, is the ratio of the amount of fertilising elements (nitrogen, phosphoric anhydride and potassium oxide) distributed for agricultural
use to amount of fertilisable land.
Data for fertilising elements were gathered by ISTAT from producers and importers that distribute
these products to farmers, merchants, farm consortiums, co-operatives and associations. These
data concern sales of fertilisers, and not their effective use.
Fertilisable land is the sum of areas used for: arable crops (excluding fallow land); permanent
crops (excluding canebrakes); permanent grassland (excluding pastures); kitchen gardens.
To make international comparisons, the amount of fertilising elements is also compared to Utilised
Agricultural Area, though in this case use per hectare is underestimated.
Calculation is also made of the average annual rate of variation from 1990 to 2000.
Period: 1990, 1993, 1995, 1996, 1997, 1998, 1999, 2000.
Source: ISTAT, Statistiche dell'Agricoltura, various years; Statistiche ambientali, various years; Dati
congiunturali sui mezzi di produzione (data on-line).
25. Application of a fertilising plan
Description: the indicator is the percentage share of farms that adopt an annual fertilising plan.
Calculation is also made of the percentage variation from 1998 to 2000.
Period: 1998, 2000.
Source: ISTAT, Struttura e produzioni delle aziende agricole, 1998; Censimento generale dell'agricoltura, 2003.
26. Irrigation systems
Description: the indicator is the percentage share of number of farms that adopt various irrigation
systems (sprinkling, flooding, furrowing and lateral seepage, drip, or other) in the total number of
irrigated farms.
Calculation is also made of the average annual rate of variation from 1991 to 2000.
Period: 1982, 1990, 2000.
Source: ISTAT, Censimento generale dell'agricoltura, various years.
27. Irrigated land
Description: the indicator is the percentage share of irrigated land in Utilised Agricultural Area.
Calculation is also made of the average annual rate of variation from 1982 to 2000.
Period: 1982, 1990, 2000.
Source: ISTAT, Censimento generale dell'agricoltura, various years.
155
28. Type of catchment
Description: the indicator gives the number of water catchments used by Reclamation Consortiums registered in the regions of the South and Islands (Abruzzo, Molise, Campania, Basilicata,
Puglia, Calabria, Sicily and Sardinia), by different types (canal catchment, catchment from springs,
catchment from deep groundwater table, catchment from shallow groundwater table, artificial lake
intakes, natural lake intakes, river intakes, abstracting from catch basins, other).
Water catchments are understood as intake constructions on bodies of water, or structures for
abstracting water (for irrigation) from bodies of water. Figures regard water catchments managed
by public authorities; all private water catchment structures are excluded.
Consideration is made of water catchments that are a) continuative; b) seasonal; c) for emergencies.
Period: 1999.
Source: INEA, POM risorse idriche 1994-1999.
29. Protected areas
Description: the indicator gives the number of protected areas (state and regional) registered in
the 3rd updating of the official list of the Ministry for the Environment.
Calculation is also made of area and percentage of national territory occupied by protected areas
Registered in the Ministry for the Environment’s official list are all protected areas that have formal
institutive provisions, public or private, and which possess features of considerable natural and
environmental value protected under specific environmental safeguard measures.
No time series was considered, since periodic updates have resulted in inconsistencies.
Period: 2000.
Source: Ministry for the Environment, Nature Conservation Unit (3rd updating of the official list of
Protected Natural Areas).
30. Condition of plant species
Description: the indicator gives the number of extinct and endangered plant species included in the
“Red List”.
The “Red List” was promoted in 1990 by the Italian Association for the WWF, under the direction of
the Ministry for the Environment, and assembled by the Italian Botanical Society. It lists only vascular plants (tracheophytes: pteridophytes, gymnosperms and angiosperms), which can be assessed
more easily and thus more reliably. The table distinguishes between endangered species (severely
threatened, threatened, at minor risk, vulnerable), extinct species and species extinct in the wild.
According to definitions provided by the IUCN (International Union for Conservation of Nature), a
species is:
- extinct when there is no reasonable doubt that the last individual has died;
- extinct in the wild when exhaustive surveys in known and/or expected habitats, at appropriate
times and throughout its historic range, have failed to record an individual;
- critically endangered when facing an extremely high risk of extinction in the wild in the immediate
future:
- vulnerable when it is not critical or endangered but is facing a very high risk of extinction in the
wild in the medium term future;
- low risk when it is not at risk of extinction in the wild in the near future, but some risk factors are
clearly evident.
Period: 1995.
156
Source: Italian Botanical Society – WWF, “Regional Red List of Plants of Italy”, Camerino.
31. Wooded lands affected by fire
Description: the indicator is the percentage share of wooded land affected by fire in total wooded
land.
Calculation is also made of the average annual rate of variation from 1985 to 2000.
Period: annually from 1985 to 2000.
Source: ISTAT, Statistiche forestali, various years; Coltivazioni agricole e foreste, various years;
Coltivazioni agricole, foreste e caccia, various years.
32. Organic farming
Description: the indicator is the percentage share of Utilised Agricultural Area used for organic farming in total Utilised Agricultural Area.
The number of farms that practise organic farming is also reported.
Calculation is also made of the average annual rate of variation from 1993 to 2000.
Period: annually from 1993 to 2000.
Source: Biobank, from data provided by control bodies, various years; ISTAT, Struttura e produzioni delle aziende agricole, various years; Censimento generale dell'agricoltura, 2003.
33. Agri-environmental measures
Description: the indicator is the percentage share of Utilised Agricultural Area affected by agri-environmental measures (EEC Reg. 2078/92 and measure F, EC Reg. 1257/99) in total Utilised Agricultural Area.
Calculation is also made of the average annual rate of variation from 1994 to 2000.
Period: annually from 1994 to 2000.
Source: AGEA, various years; Struttura e produzioni delle aziende agricole, various years; Censimento generale dell'agricoltura, 2003.
34. Utilised Agricultural Area
Description: the indicator is the percentage share of Utilised Agricultural Area in total national territory.
Calculation is also made of the average annual rate of variation from 1982 to 2000.
Period: 1982, 1990, 2000.
Source: ISTAT, Censimento generale dell'agricoltura, various years.
35. Afforestation index
Description: the indicator is the percentage share of wooded land in total national territory.
For 2000, wooded lands are also divided by type (high forests: coniferous, broadleaved, and mixed
coniferous and broadleaved; coppiced: simple, compound; Mediterranean scrub)
Calculation is also made of the average annual rate of variation from 1960 to 2000.
Period: 1960, 1970, 1982, 1990, 2000.
Source: ISTAT, Statistiche forestali, various years; Dati sulla superficie e le utilizzazioni forestali
(data on-line); Annuario statistico, 2003.
157
36. Intensification
Description: the indicator is the percentage share of Utilised Agricultural Area used for intensive
cultivation (potatoes, vegetables, grapes, citrus, fruits) in total Utilised Agricultural Area.
Calculation is also made of the average annual rate of variation from 1982 to 2000.
Period: 1982, 1990, 2000.
Source: ISTAT, Censimento generale dell’agricoltura, various years.
37. Concentration
Description: the indicator is the ratio of the number of farms with <5 ha of Utilised Agricultural Area
to the number of farms with >50 ha of Utilised Agricultural Area.
Calculation is also made of the average annual rate of variation from 1982 to 2000.
Period: 1982, 1990, 2000.
Source: ISTAT, Censimento generale dell’agricoltura, various years.
38. Man-made and natural elements
Description: the indicator is the percentage share of the extension of natural elements (rows of
trees, hedgerows; groves, thickets) and man-made elements (ditches, turning spaces) in total Utilised Agricultural Area.
Period: 1998.
Source: ISTAT, Struttura e produzioni delle aziende agricole – 1998.
158
APPENDIX 3
EUROPEAN UNION DOCUMENTS
Sustainable agriculture and rural development in European
Sustainable agriculture and rural development in European Union policy
Union policy documents
documents
Riferimenti alle dimensioni ecologica, economica e sociale
dell’agricoltura
e dello economic
sviluppo rurale
References sostenibile
to ecological,
and social
dimensions
of
sustainable
development
and rural
Le finalità della politica agricola comune sono:
development
Trattato di Amsterdam,
Articolo 33 (Trattato di Roma,
la produttività dell’agricoltura, sviluppando il
Art.
39) of Amsterdam Article 33- incrementare
Treaty
The objectives for the common agricultural policy shall be:
progresso tecnico, assicurando lo sviluppo razionale della pro(Treaty of Rome, Art. 39)
duzione agricola come pure un impiego migliore dei fattori di
to increase agricultural productivity by promoting
produzione,
in particolare
technical
progress della
and manodopera,
by ensuring the rational
development of agriculture production and the optimum
- assicurare
così unoftenore
di vitaof
equo
alla popolazione
agriutilisation
the factors
production,
in particular
cola, grazie
labour;in particolare al miglioramento del reddito individuale di coloro che lavorano nell’agricoltura,
thus to ensure a fair standard of living for the
agricultural
community, in particular by increasing the
- stabilizzare
i mercati,
individual earnings of persons engaged in agriculture;
- garantire la sicurezza degli approvvigionamenti,
to stabilise markets;
- assicurare prezzi ragionevoli nelle consegne ai consumatori.
to assure the availability of supplies;
Agenda 2000
COM(97)2000 def.
Agenda 2000
COM(97)2000 final
p. 23 (…)
Parallelamente,
l’UE reach
dovrebbe
sforzarsiatdireasonable
valorizzare
to ensure
that supplies
consumers
il potenziale
economico
e
ambientale
delle
zone
rurali
nonché
prices.
la loro capacità di fornire posti di lavoro durevoli.
p. 28 (…) Almeno altrettanto importanti [rispetto ai prezzi] sono la
sicurezza e la qualità delle derrate. (…) In questo settore assumono crescente importanza le questioni di compatibilità
p. 28 (…)
Food
safety
and food quality
at least
as
ambientale
dei
metodi
di produzione
nonché are
gli aspetti
legati
important [as prices]. (...) Of growing importance in this area
al benessere degli animali. (...)
too are questions of the environmental friendless of
production methods, and animal welfare considerations.
Garantire
(...) un equo livello di vita per la popolazione agricola e
contribuire alla stabilità dei redditi agricoli restano obiettivi fondamentali
della
In questo of
contesto,
le for
questioni
della diffeEnsuring
a PAC.
fair standard
leaving
the agricultural
community
and contributing
to althe
stability
farm
renziazione
e ridistribuzione
degli aiuti
reddito
per gli of
agricoltoremain key
objectives of the
CAP. In this
context
ri e incomes
del mantenimento
dell’agricoltura
sostenibile,
acquistano
the questions
of differentiation,
redistribution
of income
crescente
importanza,
e ciò non solamente
dal punto
di vista
support among farmers and the preservation of sustainable
della coesione sociale.
farming are gaining importance, not at least from the point
of view of social cohesion.
L’integrazione degli obiettivi ambientali nella PAC e il potenziamento
del ruolo of
che
gli agricoltorigoals
possono
e dovrebbero
The integration
environmental
into the
CAP and
svolgere
sul
piano
della
gestione
delle
risorse
naturali
e della
the development of the role farmers can and should play
in
terms of management
natural resources
and
salvaguardia
del paesaggio of
rappresentano
un altro obiettivo
landscape
conservation
another increasingly important
sempre
più determinante
nellaare
PAC.
objective for the CAP.
La creazione di fonti di reddito e occupazione complementacreationper
of gli
complementary
alternative
ri oThe
alternative
agricoltori e leorloro
famiglie,income
sia neland employment opportunities for farmers and their
l’ambito dell’azienda che al di fuori di essa, resta un obiettivo
families, on-farm and off-farm, remains a major aim for the
essenziale
peremployment
il futuro, datopossibilities
il ridursi delle
possibilità diitself
impiego
future, as
in agriculture
fall
160
160
nel settore
agricolo
propriamente
detto. Le zone
sonoshould
pluriaway. Rural
areas
are multi-functional,
andrurali
farmers
be encouraged
to dovrebbero
exploit allessere
opportunities
fora sfrutrural
funzionali
e gli agricoltori
incoraggiati
tare entrepreneurs.
tutte le possibilità imprenditoriali che si offrono loro.
Proposals for Council (EC)
Proposta
perconcerning
un
regulations
the
reform of the del
common
Regolamento
Consiglio
agricultural
policy la riforma
(CE)
concernente
della
politica
COM (1998)agricola
182 final
comune
18 March 1998
COM (1998) 182 def., 18
marzo 1998
Un’ultima
considerazione,
nonrecognising
meno importante:
purofriconoscenLast but
not least, while
the need
rural areas
do lafor
necessità
di agricultural
migliorare la competitiveness
competitività agricola
di tutte le
improving
and enhancing
diversification,
agricultural andeconomica,
rural policies
zoneeconomic
rurali e di promuoverne
la diversificazione
le
have
to
contribute
to
economic
cohesion
within
the
Union.
politiche relative all’agricoltura e alle zone rurali devono contribuire alla coesione economica all’interno dell’Unione.
Explanatory Memorandum, The European Model of
Memorandum
Agriculture:esplicativo, Il modello europeo di agricoltura:
It is worth
listing qui
here
what
the mainessere
lines le
of linee
this princimodel
E’ opportuno
elencare
quali
dovrebbero
should
be:modello:
pali di
questo
a competitive
which gradualmente
can gradually
- un settore
agricolo agriculture
competitivosector
che possa
a
ce
up
to
the
world
market
without
being overf
affrontare il mercato mondiale senza essere sovra-compensato,
subsidised, since this is becoming less and less
in quanto questo sta diventando sempre più inaccettabile a livelacceptable internationally;
lo internazionale;
production methods which are sound and
- metodienvironmentally
di produzione ecocompatibili,
di offrire
profriendly, able capaci
to supply
quality
dotti diproducts
qualità come
of therichiesto
kind the dalla
publicsocietà;
wants;
- forme diverse di agricoltura, ricche in tradizione, che non siano
diverse forms of agriculture, rich in tradition, which are
solo orientate
produzione,but
maseek
mirino
a mantenere
sia il
not just alla
output-oriented
to maintain
the visual
paesaggio
ruraleofsiaour
comunità
rurali attive,
e
amenity
countryside
as wellche
as generano
vibrant and
mantengono
activel’occupazione;
rural communities, generating and
maintaining employment;
Preambolo:
Regolamento (CE) n.
1251/1999
del Consiglio
Council Regulation
(EC) del
n.
(21) Preamble:
considerando che, per poter fruire dei pagamenti per super17
maggio
1999
che
1251/1999 of 17 May 1999
ficie, i coltivatori dovrebbero ritirare dalla produzione una percenistituisce
un regime
di system
establishing
a support
Whereas,
orderseminativi;
to benefit che
fromi terreni
the area
payments,
tuale(21)
prestabilita
deiinpropri
ritirati
dalla
for producers
of certain
producers should set aside a predetermined percentage of
sostegno
a favore
dei arable
produzione dovrebbero ricevere una destinazione tale da
crops
their arable area; whereas the land set aside should be
coltivatori
di taluni seminativi
rispettare
determinati
minimi minimum
di difesa environmental
dell’ambiente;
cared for
so as to criteri
meet certain
(…) standards; (…)
Preambolo:
Regolamento del Consiglio
Preamble:
Council Regulation (EC) No
(CE) n. 1254/1999 relativo
1254/1999 of 17 May 1999 on
considerando che, per potenziare gli incentivi alla produall’organizzazione
comuneof the(14) (14)
the common organisation
Whereas, to strenghten incentives to extensify
zione
estensiva with
al fine
di aumentarne
l’efficacia
rispetto agli
dei
mercati
nel
settore
delle
market in beef and veal
production
a view
to improving
their effectiveness
in
obiettivi
ambientali,
si
dovrebbe
concedere
un
importo
supplecarni bovine
relation to environmental objectives, an additional
mentare
ai produttori
soddisfano
requisiti severi
ed effettivi
amount
should beche
granted
to producers
who comply
with
riguardo
al coefficiente
densità;density requirements;
severe
and genuinedistocking
(…) (…)
(Additional
payments) art.
(pagamenti
supplementari)
art.15,
14,(...)
(...)
3. I requisiti
ai coefficienti
di densità sonoshall
stabiliti:
3. The specifici
specificrelativi
stocking
density requirements
be
- tenendo
conto, in particolare, dell’impatto ambientale del tipo
established:
di produzione considerato, della sensibilità ambientale del terre(…) per l’allevamento del bestiame e delle misure applino -utilizzato
cate allo scopo di stabilizzare o migliorare la situazione ambientaking
account of, in particular, the environmental
tale- di tale
terreno.
i m p a c t of the type of production concerned, the
161
161
environmental sensitivity of the land used for rearing
cattle and the measures which have been implemented
with a view to stabilise or improve the environmental
situation of this land.
Council Regulation (EC) No
1259/1999 of 17 May 1999
establishing common rules for
direct support schemes under
the Common Agricultural Policy
Preamble:
(3) Whereas, with a view to better integrating the
environment into the common market organisations,
Member States should apply appropriate environmental
measures in relation to agricultural land and agricultural
production subject to direct payments; whereas Member
States should decide on the consequences in the case of
environmental requirements not being observed; whereas
Member States should be enabled to reduce or even
cancel benefits accruing from support schemes where
such environmental requirements are not respected;
whereas such measures should be taken by Member States
notwithstanding the possibility of granting aid in return for
optional agrienvironmental commitments;
(4) Whereas, in order t o stabilise the employment
situation in agriculture and to take into account the
overall prosperity of holdings and Community support to
those holdings and thus to contribute to a fair standard of
living for the agricultural community, including all
persons engaged in agriculture, Member States should be
authorised to reduce direct payments to farmers in cases
(…);
(7) Whereas the support schemes under the common
agricultural policy provide for direct income support in
particular with a view to ensuring a fair standard of living
for the agricultural community; whereas this objective is
closely related to the maintenance of rural areas; (…)
Council strategy on the
environmental integration and
sustainable development in the
common agricultural policy
(8) The Council notes the multifunctional role of
agriculture from production of food and renewable raw
materials to the stewardship of rural landscapes and the
protection of the environment. Agriculture’s
contribution to the viability of rural areas is also
indisputable (…).
15 November 1999
(9) Integration of environmental protection a n d
sustainability requirements into sectoral policies is a key
element for successful socio-economic development as
well as for improvement and implementation of
environmental policy. (…)
established by the Agricultural
Council
(11) Sustainable agriculture calls for natural resources to
be managed in a way that ensures benefits are also
available in the future. It takes into account the preservation
of the overall balance and value of the natural capital
stock and the need for agriculture to be competitive.
(13) Complemented by the contribution of agriculture to
the viability of rural areas these objectives [the objectives
162
162
Regolamento (CE)
n. 1259/1999 del Consiglio
del 17 maggio 1999 che
stabilisce norme comuni
relative ai regimi di sostegno
diretto nell’ambito della
politica agricola comune
Strategia per l’integrazione
degli aspetti ambientali e
dello sviluppo sostenibile
nella politica agricola
comune
definita dal Consiglio
“Agricoltura”, 15 novembre
1999
of the CAP included in art. 33 of the Treaty of Amsterdam]
Preambolo:
comprise important economic and social aspects of the
sustainability approach. Agriculture plays an important role
(3) considerando che, a norma dell’articolo 159 del trattato, l’atin contributing to the maintenance of employment in
tuazione
delle politiche
comunitarie
deve
conto production
degli obietrural areas
and in the
whole food
andtener
non-food
tivi chain.
della coesione economica e sociale stabiliti dagli articoli 158
e 160 e concorrere alla loro realizzazione; che le misure destinate allo
rurale
pertanto
tale poli(15)sviluppo
Integration
of dovrebbero
the environment
intocontribuire
the CAP astarts
by
a reference
level
of good
ticarecognising
nelle regionithat
in ritardo
di sviluppo
(obiettivo
n. 1)agricultural
e nelle regiopractices
is dependent
conditions should be
ni con
difficoltàwhich
strutturali
(obiettivoon
n. local
2), (…);
respected in all agricultural areas of the EU. The general
is that(…)
where
provide
the
(6) principle
considerando
che farmers
una politica
delloservices
sviluppotorurale
environment beyond the reference level of good agricultural
dovrebbe
essere finalizzata a ricostituire e a rafforzare la compractices, these should be adequately remunerated. Certain
in tal
modo aorganic
mantepetitività
delle
zone rurali, contribuendo
methods of agricultural
production, for
example
nere
e a creare
posti diproduction
lavoro in queste
zone;
farming,
integrated
and traditional
low output
farming and typical local productions, provide a combination
(18)ofconsiderando
che gli aiuti social
comunitari
agli investimenti
hanno
positive environmental,
and economic
effects.
per oggetto l’ammodernamento delle aziende agricole e il
(36) As elements
ofredditività;
sustainable agriculture ethical
miglioramento
della loro
production methods and animal welfare should be
(22)promoted.
considerando che occorre intensificare le iniziative di forma-
zione e informazione degli agricoltori riguardo ai metodi di pro(46) It is necessary to deepen and develop further the
duzione
agricola
compatibili
l’ambiente;
integrated
rural
policy bycon
taking
into account the social
and economic dimension, encouraging co-operation and
(24)dialogue
considerando
che ilactors
sostegno
alle zone svantaggiate
between
(environmental
authorities,dovrebnonbe governmental
contribuire ad un
uso continuato
delle superfici
agricole,and
alla
organisations,
farmers
organisations
public
the pursuit
of sustainability
andpromoziothrough
cura
delloactors)
spazio in
naturale,
al mantenimento
e alla
measures.
The rural
development
policy – as the
ne national
di sistemi
di produzione
agricola
sostenibili;
second pillar of the CAP – seeks to establish a coherent and
framework
for thedifuture
of rural areas aiming
at
(31)sustainable
considerando
che il regime
aiuti agroambientali
dovrebbe
restoring and enhancing competitiveness and therefore
continuare a incoraggiare gli agricoltori ad operare nell’interesse
contributing to the maintenance of employment.
dell’intera società, introducendo o mantenendo metodi di produzione
compatibili
contolebroaden
crescenti
esigenze
di tutela e
(87) (…)
It is important
the domain
of indicators
miglioramento
dell’ambiente,
delle
risorse
naturali,
del suolo
to include multifunctionality of agriculture and sustainable
e della
diversità genetica, nonché con la necessità di salvadevelopment.
guardare lo spazio naturale e il paesaggio;
(91) The Council agrees that:
(40) (…) considerando che l’elenco di tali misure dovrebbe esseSustainable
agriculture
ensures
that agriculturés
re stabilito
in base all’esperienza
acquisita
e tenendo
conto delnatural base remains productive and agricultural
l’esigenza che lo sviluppo rurale si basi in parte su attività e serproduction can be competitive in the future and that
vizi extra
agricoli, in modo da invertire la tendenza al declino
farming works to promote positive environmental
socioeconomico
e allo spopolamento della campagna; che
impact.
occorrerebbe sostenere misure volte ad eliminare le ineguaglianze(…)
e a promuovere la parità di opportunità fra uomini e
donne;
Agriculture is multifunctional and clearly has effects on
(41) considerando
che i consumatori
in misura
the environment
and the richiedono
rural landscape.
sempreFurthermore
maggiore prodotti
e derrate
it has a agricoli
fundamental
role alimentari
to play in ottethe
nuti con
metodi
biologici;
viability
of rural
areas.che questo fenomeno sta quindi
creando un mercato nuovo per i prodotti agricoli; che l’agricoltuGood agricultural practices should be further
developed and respected in all areas of the EU.
163
163
ra biologica migliora la sostenibilità delle attività agricole e
Agriculture plays an important role in contributing to
contribuisce
pertanto ai fini
del presente
regolamento;
the maintenance
of generali
employment
in rural areas
and in
(…)
the whole food and non-food production chain.
Preambolo:
(…)
(3) considerando che ai fini di una migliore integrazione della
Agriculture should respond to increasing consumer
dimensione
ambientale
comuni
di mercato
concern
about nelle
food organizzazioni
safety as well
as food
and
gli Statienvironment
membri dovrebbero
quality (…).applicare misure ambientali
adeguate per quanto riguarda i terreni e la produzione agriEconomical,
environmental,
social
and cultural
cola oggetto
di pagamenti
diretti; che gli
Stati membri
dovrebservices
provided
by
farmers
must
be
recognised;
bero decidere sulle conseguenze in caso di mancato rispetto for
dei
services
farmers
be adequately
Stati membri
dovrebberequisiti these
in materia
ambientale;
che glishould
remunerated.
particular,
when
farmers provide
ro essere
autorizzati a In
ridurre
o persino
a sopprimere
i beneservices for the benefit of the environment beyond the
fici derivanti
dai
regimi
di
sostegno
se
detti
requisiti
non
reference level of good agricultural practices and
che legislation,
gli Stati membri
tali
sono soddisfatti;
environmental
they dovrebbero
should be adottare
adequately
misure ferma
restando for
la possibilità
concedere
aiuti in cambio
compensated
example di
through
agri-environmental
di impegni
agroambientali
di carattereon
facoltativo;
measures
being implemented
a voluntary basis.
(…)
(4) considerando
che per stabilizzare la situazione dell’occupazione in agricoltura e per tener conto della prosperità gloCommunication from the
bale(Introduction)
delle aziende e del sostegno comunitario a dette aziende
Commission
contribuendo così ad assicurare un tenore di vita equo alla
The beneficial use of land and natural resources for
Directions towards sustainable popolazione agricola, comprendente tutti i lavoratori del settore,
agricultural production has also to be balanced with
agriculture
gli Stati
membrivalues
devonorelating
essere autorizzati
a ridurre i pagamenti
societys
to the protection
of the
diretti
agli
agricoltori
nei
casi
in
cui
(…);
environment and cultural heritage.
COM/99/0022 final
(7) considerando che i regimi di sostegno della politica agricola
(Environmental elements of the CAP reform under Agenda
comune
2000)prevedono un sostegno diretto al reddito, in particolare
al fine di assicurare un equo tenore di vita alla popolazione
agricola;
cheare
tale required
obiettivo ètostrettamente
connesso
al manteniPolicies
develop EU
agriculture
on a
(…)
mento
delle zonepath,
rurali;
sustainable
ensuring
an environmentally sound,
economically viable, and socially acceptable European
(8) Ilmodel
Consiglio
prende atto del ruolo plurifunzionale dell’agriof agriculture.
coltura, che va dalla produzione di cibo e materie prime rinnovabili,
gestionemeasures)
dei paesaggi rurali e alla tutela del(Rural alla
development
l’ambiente. Il contributo dell’agricoltura alla vitalità delle
tourist
potential
based
zoneThe
rurali
è altresì
indiscutibile
(…).on good environmental
conditions of rural areas enables the diversification of
economic activities
to be
considered;lathis
requires
a
(9) L’integrazione
dei requisiti
concernenti
tutela
dell’amsustainable
and
integrated
approach
in
order
to
meet
the
biente e lo sviluppo rurale nelle politiche settoriali è un elequality requirements of tourists, to improve the situations of
mento essenziale per il buon esito dello sviluppo socio-ecolocal businesses and communities and to preserve the
nomico
e per(landscape
attuare e migliorare
la politica ambientale.
(…)
natural
and biodiversity)
and cultural
(architecture, handicrafts, traditions) heritage.
(11) L’agricoltura sostenibile richiede che le risorse naturali
siano
gestite in modo
da consentire
di trarre vantaggio
da que(Compensatory
allowances
in less-favoured
areas)
ste ultime anche in futuro. Essa tiene conto della necessità di
The main
objectives
remainebroadly
namely
to
globale
il valoreunchanged,
del patrimonio
natupreservare
l’equilibrio
assure
continued
farming
in
the
less-favoured
areas,
t
o
rale e dell’esigenza che l’agricoltura sia competitiva.
contribute to the maintenance of a viable rural
community, to preserve the landscape and to promote the
(13) Tali finalità [le finalità della politica agricola comune indicate
continuation of sustainable farming in areas where it is
nell’articolo
33 for
delthe
trattato
di Amsterdam],
completate dal contrinecessary
protection
of the countryside.
buto dell’agricoltura alla vitalità delle zone rurali, includono
164
164
At a first level, “sustainable agriculture” involves managing
natural resources in a way which ensures that they are
available in the future. This narrow definition of
sustainability in many cases reflects the economic selfIndicators for the Integration of
Environmental Concerns into the interest of farmers.
Common Agricultural Policy
A broader understanding of sustainability extends, however,
to a larger set of features linked to land and land use
COM/00/0020 final
such as the protection of landscapes, habitats, and
biodiversity, and to objectives such as the quality of
drinking water and air. In this broader perspective, the use
of land and natural resources for agricultural production
must take account of the protection of the environmental
and cultural heritage.
Comunicazione della
Commissione al Consiglio, al
Finally, sustainability needs also to reflect societ_s concerns
Parlamento europeo, al
as regards the social function of agriculture, the
smaintenance of the viability of rural communities and a
Comitato economico e
balanced pattern of development.
sociale e al Comitato delle
regioni
Sustainable agriculture therefore needs to reflect
Orientamenti per
productive, environmental and social functions.
un’agricoltura sostenibile
Communication from the
Commission
Communication
from the
COM/99/0022
def.
Commission
A Sustainable Europe for a
BetterWorld: A European Union
Strategy for Sustainable
Development
(Commission's proposal to the
Gothenburg European Council)
COM(2001)264 final
Just over one year ago at Lisbon, the European Council set
a new strategic goal for the Union: “to become the most
competitive and dynamic knowledge-based economy in the
world capable of sustainable economic growth with more
and better jobs and greater social cohesion”. The Stockholm
European Council then decided that the EU sustainable
development strategy should complete and build on this
political commitment by including an environmental
dimension. This recognises that in the long term,
economic growth, social cohesion and environmental
protection must go hand in hand.
Sustainable development offers the European Union a
positive long-term vision of a society that is more
prosperous and more just, and which promises a cleaner,
safer, healthier environment (…).
Clear, stable, long-term objectives will shape expectations
and create the conditions in which businesses have the
confidence to invest in innovative solutions, and to create
new, high-quality jobs.
Action must be taken by all and at all levels: many of the
changes needed to secure sustainable development can
only successfully be undertaken at EU level.
Careful assessment of the full effects of a policy proposal
must include estimates of its economic, environmental
and social impacts inside and outside the EU. This should
include, where relevant, the effects on gender equality
and equal opportunities.
165
165
importanti aspetti economici e sociali all’approccio basato
Our continued long-term prosperity depends critically on
sullaadvances
sostenibilità.
L’agricoltura
svolge un’importante
funzione
in knowledge
and technological
progress.
contribuendo a mantenere l’occupazione nelle zone rurali e
in tutto
ciclo di produzione
Theileducation
system alimentare
also has ae non
vitalalimentare.
role to play in
promoting better understanding of the aim of sustainable
degli aspetti
ambientali
nella PACand
inizia
dal rico(15)development,
L’integrazione fostering
a sense
of individual
collective
responsibility,
and di
thereby
encouraging
changes
in
noscimento
che un livello
riferimento,
che dipende
dalle condibehaviour.
zioni locali, delle buone pratiche agricole, deve essere rispettato
in tutte le aree agricole dell’UE. Come principio generale, gli agriThe main challenges to sustainable development identified
coltori che contribuiscono alla tutela dell’ambiente in misura supeabove cut across several policy areas. Accordingly, a
riorecomprehensive,
al livello di riferimento
previsto dalle
buone pratiche
agricole
cross-sectoral
approach
is needed
to
produdevono
essere
adeguatamente
remunerati.
Alcuni
metodi
di
address these challenges.
zione agricola, come ad esempio l’agricoltura biologica, l’agricoltura integrata
la tradizionale
produzione
a bassi consumi
Soil (…)e performs
a number
of key agricola
environmental,
social
Communication from the
and economic
functions
vital
for generano
life.
Commission to the Council, theintermedi,
e le produzioni
tipiche
locali
una combinazione
European Parliament,
Comunicazione
della the
di effetti
sociali ed
economici under
positivi.pressure. For
Soil ambientali,
is a vital resource
increasingly
Economic and del
Social
Committee
Commissione,
15 maggio
sustainable development, it needs to be protected.
and the Committee of the
2001
(36) Occorrerebbe promuovere, in quanto elementi dell’agricolRegions
Therefore, soil protection policies need to have a special
tura sostenibile, i metodi etici di produzione e il benessere
Sviluppo sostenibile in
focus on sustainable use and management of
Towards
a Thematic
degli animali.
Europa
per
un mondoStrategy for
agricultural soils, with a view to safeguarding the fertility
Soil Protection
migliore: strategia dell’Unione
and agronomic value of agricultural land.
(46) E’ necessario approfondire e sviluppare maggiormente la
COM(2002)
179
final
europea
per lo
sviluppo
politica rurale integrata, tenendo conto della dimensione
sostenibile
socio-economica,
incoraggiando
la cooperazione
ed il dialogo
This [to be conform
with the principles
of the 6EAP]
requires,ai
Communication from the
(proposta della Commissione
among
others, that:
Commission to the Council, thefini della
sostenibilità
tra i soggetti interessati (autorità ambientaper
il Consiglio
europeo
dithe
European
Parliament
and
li, organizzazioni
governative,
organizzazioni
degli agricolto[the soil non
strategy]
contributes
to achieving
a deGöteborg)
Economic and Social Committee
ri e enti pubblici)
e
le
misure
nazionali.
La
politica
di
sviluppo and
ruracoupling between environmental pressures
COM(2001)264
def.
secondo
pilastro della PAC - intende definire un
economic
growth;
Towards a thematic strategy onle - in quanto
the sustainable use of pesticides
quadro coerente e sostenibile per il futuro delle zone rurali, pun[the soil strategy] contributes to the development of a
tando a plant
riattivare
e rafforzare
la competitività,
contribuendo
protection
practise
that fits into the
concept ofin
COM(2002) 349 final
tal modosustainable
al mantenimento
dell’occupazione.
agriculture including social and
economic dimensions.
(87) (…) E’ importante ampliare il campo degli indicatori in modo
2. A new political
context
Communication from the
da includere
la plurifunzionalità
dell’agricoltura e lo sviluppo
Commission to the Council and thesostenibile.
(…) the concept of sustainable development (…) need to place the
European Parliament
three dimensions [economic, social and environmental] on an
equal footing.
2003 Environment Policy Review Il Consiglio
conviene che:
However, our long-term economic and social prospects very much
Consolidating the environmental
sostenibile
la base naturale
deldepend on our
ability to garantisce
consider theche
environment
as a key
pillar of sustainable development - L’agricoltura
componentrimanga
of economic
and social
policy.
l’agricoltura
produttiva
e
la
produzione
agricola
possa
COM(2003) 745 final
essere
competitiva
in futuro
e che
le attività
agricolebetween
mirino a
Addressing
in a balanced
manner
potential
trade-offs
economic un
and
environmental
impatto
ambientaleobjectives
positivo. can bring forth
promuovere
“winwin” solutions and enhance sustainable development.
L’agricoltura
- (…)
è plurifunzionale
ha ovviamente effetti
4. A
renewed approach
to environmentaled
policy
sull’ambiente
e
sullo
spazio
naturale.
Inoltre,
essa
ha un
(…) A measure of success of a strategy is how
effectively
it tackles
ruolo
fondamentale
nella
redditività
dellethe
zone
rurali.pillars
the problem
of resolving
trade-offs
between
different
[environmental,
economic
and
social]
of
sustainable
- Ledevelopment.
buone pratiche agricole dovrebbero essere sviluppate ulteTo progress
on theinway
development,
riormente
e rispettate
tuttetowards
le zone sustainable
dell’UE.
potential synergies between environment and the other two
dimensions– economic and social- must be fully exploited.
- L’agricoltura svolge un ruolo importante nel contribuire a man(…), l’occupazione
i n f o r m a t i o n nelle
plays aree
a number
key rolescatena
in thedi
tenere
rurali eof nell’intera
environmental policy process. The first is as a driver for
environmental policy. By monitoring the driving forces, the
pressures and changes in the state of the environment, problems
can be identified
166 as they arise.
166
6. International
dimension
(…) In implementing the strategy [of environmental integration],,
particular attention is attached to two objectives: promoting
synergies between development and environment objectives
(…) A measure of success of a strategy is how effectively it tackles
the problem of resolving trade-offs between the different pillars
[environmental, economic and social] of sustainable
development.
To progress on the way towards sustainable development,
potential synergies between environment and the other two
dimensions– economic and social- must be fully exploited.
(…), i n f o r m a t i o n plays a number of key roles in the
environmental policy process. The first is as a driver for
environmental policy. By monitoring the driving forces, the
pressures and changes in the state of the environment, problems
can be identified as they arise.
6. International dimension
Comunicazione della
Commissione al Consiglio e
al Parlamento Europeo
(…) In implementing the strategy [of environmental integration],,
particular attention is attached to two objectives: promoting
synergies between development and environment objectives
(…).
COM(2002) 179 def.
All necessary steps will be taken to achieve a high level of
economic growth and social cohesion in the Union while
ensuring decoupling from environmental degradation.
Verso una strategia tematica
per la protezione del suolo
7. Conclusions
Source: adapted and broadened from European Commission, (2001), A framework for Indicators for the Economic and
Social Dimensions of Sustainable Agriculture and Rural Development, Brussels.
167
167
produzione alimentare e non alimentare.
- (…)
Comunicazione della
Commissione al Consiglio e
al Parlamento Europeo
Riesame della politica
ambientale – 2003.
Consolidare il pilastro
ambientale dello sviluppo
sostenibile”
COM(2003) 745 def.
- L’agricoltura dovrebbe rispondere alla preoccupazione crescente dei consumatori riguardo alla sicurezza alimentare, nonché
alla qualità dei prodotti alimentari e dell’ambiente (…)
- Occorre riconoscere i servizi economici, ambientali, sociali e
culturali forniti dagli agricoltori, per questi servizi gli agricoltori dovrebbero essere adeguatamente remunerati. In particolare, quando gli agricoltori forniscono servizi che recano vantaggio all’ambiente al di là del livello di riferimento delle buone pratiche agricole e della legislazione in materia di ambiente, ciò
dovrebbe essere adeguatamente compensato, ad esempio
mediante misure agroambientali applicate su base volontaria.
- (…)
La gestione sostenibile della terra e delle risorse naturali ai fini
della produzione agricola deve essere in armonia con i valori che
la società attribuisce alla protezione dell’ambiente e del
patrimonio culturale.
(Aspetti ambientali della riforma della PAC nel quadro
dell’Agenda 2000)
Occorre formulare politiche mirate allo sviluppo sostenibile dell’agricoltura europea, in base ad un modello europeo di agricoltura efficiente, economicamente redditizio e socialmente accettabile.
(Misure per lo sviluppo rurale)
Il potenziale turistico rappresentato da buone condizioni ambientali
delle aree rurali permette la diversificazione delle attività economiche; è necessario a tal fine un approccio integrato e sostenibile
per soddisfare le esigenze qualitative dei turisti, migliorare la situazione delle imprese e delle collettività locali e salvaguardare il
patrimonio naturale (paesaggio e biodiversità) e culturale
(architettura, attività tradizionali e artigianali).
(Indennità compensative nelle zone svantaggiate)
Gli obiettivi di fondo rimangono sostanzialmente invariati, ossia
garantire il proseguimento della coltura sulle superfici agricole
nelle zone svantaggiate e favorire in tal modo il mantenimento
di una comunità rurale vitale, conservare lo spazio naturale
e mantenere e promuovere sistemi di produzione agricola sostenibili nelle zone dove ciò è necessario per la protezione dello spazio naturale.
Nella sua accezione più semplice, “l’agricoltura sostenibile” comporta la gestione delle risorse
naturali in modo da assicurare la loro disponibilità in futuro. In questa definizione ristretta
della sostenibilità si riflette in molti casi il tornaconto economico dei conduttori agricoli.
168
APPENDIX 4
USEFUL WEBSITES
International Institutions and Organisations
European Commission Agriculture
http://europa.eu.int/comm/agriculture/info.htm
European Commission Environment
http://europa.eu.int/comm/dgs/environment/index_it.h
tm
European Commission Eurostat
http://europa.eu.int/comm/eurostat/
European Environment Agency (EEA)
http://www.eea.eu.int/
Institute for Environment and Sustainability (IES)
http://ies.jrc.cec.eu.int/
European Commission Joint Research Centre
Organisation for Economic Co-operation and Development
(OECD)
UN Commission on Sustainable Development (UN CSD)
http://www.oecd.org
http://www.un.org/esa/sustdev/csd.htm
UN Convention on Biological Diversity (UN CBD)
http://www.biodiv.org
UN Convention to Combat Desertification (UN CCD)
http://www.unccd.int
UN Framework Convention on Climate Change (UN FCCC)
http://www.unfccc.de
UN Educational, Scientific and Cultural Organizzation (UN ESCO)
http://www.unesco.org
UN Environment Programme (UN EP)
http://www.unep.org
UN EP World Conservation Monitoring Centre
http://www.unep-wcmc.org
UN Food and Agriculture Organisation (FAO)
http://www.fao.org
UN Food and Agriculture Organisation (FAO)
http://www.fao.org/waicent/faoinfo/sustdev/
Sustainable Development Department
World Bank
http://www.worldbank.org
World Bank - Rural Development and Agriculture
http://wbln0018.worldbank.org/essd/essd.nsf/rural+d
evelopment/portal
World Bank - Environment
http://www.worldbank.org/environment/
World Bank - Land Quality Indicators
http://www-esd.worldbank.org/lqi/
National Agencies and Ministries
Department for Environment Food and Rural Affairs - UK
http://www.defra.gov.uk/
Sustainable Development Commission - UK
http://www.sd-commission.gov.uk/
Natural Resource Conservation Service
(United States Department of Agriculture - USA)
http://www.nrcs.usda.gov/
170
United States Environmental Protection Agency – USA
http://www.epa.gov/
Agriculture and Agri-food Canada
Ministry of Agriculture
http://www.agr.gc.ca/policy/environment/pubs_aei_
e.phtml
Agri-Environmental Indicators Report
Non-Governmental Organisations
IISD/Consultative Group on Sustainable Development Indicators
International Institute for Sustainable Development
http://www.iisd.org/cgsdi/indices.htm
IISD/Consultative Group on Sustainable Development Indicators
The Dashboard of Sustainability
http://www.iisd.org/cgsdi/dashboard.htm
Criterion for aggregating sustainability indicators
European Centre for Nature Conservation (ECNC)
Research centre for investigating issues of scientific and
political relevance, especially key aspects (economic, social
and ecological) that can influence European policy for nature
conservation (cfr. for example the report on agri-environmental
indicators). It also provides support to international
organisations and political initiatives.
World Conservation Union (IUCN)
Worldwide association whose objective is the conservation of
nature and the equitable and environmentally sustainable use
of natural resources.
World Wide Fund for Nature (WWF)
http://www.ecnc.nl/
http://www.iucn.org
http://www.panda.org
Worldwide organisation that works locally to arrest the
degradation of the natural world.
International Society for Ecological Economics (ISEE)
Company dedicated to integration and interdisciplinary dialog
for the development of a sustainable world.
International Soil Reference and Information Centre (ISRIC)
Foundation for documentation, information and research about
soils, to provide a better understanding about soils and to
promote sustainable use of the land.
http://www.ecologicaleconomics.org
http://www.isric.nl
Resources for the Future (RFF)
Social science research institute (focusing on environment, http://www.rff.org
energy and natural resources issues) primarily geared toward
information on policymaking..
Wetlands International
Association dedicated to wetland conservation and sustainable
management.
171
http://www.wetlands.org/
BirdLife International
Global alliance of conservation organisations working together
for the world's birds and people.
Biodiversity Conservation Information System
A consortium of ten international organisations and programs of
IUCN to support members and policymakers for conservation
and sustainable use of natural resources.
World Resource Institute
Non-governmental research and policy organization that
creates solutions to protect the Earth and improve people's
lives.
Worldwatch Institute
Independent research organization that devotes particular
attention to the interactions between people, nature and
economies.
National Councils for Sustainable Development
http://www.birdlife.net/
http://www.biodiversity.org
http://www.wri.org
http://www.worldwatch.org
http://www.ncsdnetwork.org/background.htm
National bodies for citizen participation in sustainable
development.
International Federation of Organic Agriculture Movements (IFOAM)
Organisation for the adoption of agricultural systems based on
the principles of organic farming.
172
http://www.ifoam.org
Finito di stampare nel mese di settembre 2004
dalla Stilgrafica s.r.l. - Roma
Scarica