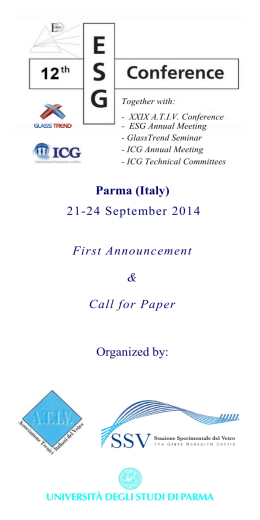
4st International Conference on Computational Heat and Mass Transfer
Proceedings of 4th ICCHMT
May 17–20, 2005, Paris-Cachan, FRANCE
ICCHMT’05 - 224
THE ARTISTIC GLASS OF S. DOMENICO’S BASILICA IN PERUGIA:
MEASUREMENTS AND SIMULATIONS OF THE MICRO – CLIMATE CONDITIONS
Cinzia Buratti*
Department of Industrial Engineering, Perugia University
67, Via G. Duranti, 06125 Perugia, Italy
R. Mariani
Department of Industrial Engineering, Perugia University
*Corresponding author: Fax: +39 (0) 75 5853697 Email: [email protected]
ABSTRACT
INTRODUCTION
The works of art preservation is in Italy an argument
of great interest, because of its wide historical –
artistic heritage. An important role in the preservation
is due to the micro – climate conditions, over all for
those works of art sensitive to the absolute values and
the variations of temperature, solar radiation, relative
humidity. Artistic windows, such as the ones in the S.
Domenico’s Basilica in Perugia (Italy), are sensitive
to these parameters. In the present paper the microclimate conditions in the S. Domenico’s Basilica were
measured, in the period January 2003 – June 2004.
Data were elaborated and compared with the optimal
values of the parameters given by the Italian Standard
UNI 10829 and the Risk Index, defined as the
percentage of time, during a month, in which the
values of each parameter are outside the optimal
values range, was calculated. A simulation of the
thermal conditions of the artistic glass was finally
carried out, employing the Fluent 6.1 software.
The Department of Industrial Engineering of the
University of Perugia is for long time involved in
the study of the preservation conditions of the works
of art [1, 2]. In particular, in 1993, the ventilation
system of the Arrigo Fiammingo artistic window in
the Cathedral of Perugia was designed and built [1]:
the micro – climate conditions were investigated and
the Risk Indexes, such as defined in the Italian
technical Norm UNI 10829 [3], were calculated for
the main parameters [4]; then the thermal expansion
of the glass was evaluated and the aging influence
on the thermal expansion properties was investigated
[5, 6].
In the present paper the S. Domenico’s Basilica glass
is considered. During this period the glass is under a
restoration process. A study, similar to the one of the
Arrigo Fiammingo’s glass, was requested by the
Superintendence of Environmental, Architectural,
Artistic and Historical Works of Art of Umbria, even
if the problem is more complex, due to the glass
dimensions.
In a previous paper [7] the spectral properties of
three restored panels of the glass were measured, in
order to compare the characteristics of the ancient
parts (1400) and of the ones restored in 1800.
A preliminary study of the problem is the aim of the
present paper. It is divided into two parts. In the first
one the thermoigrometrical conditions around the
glass, inside and outside the Basilica, were measured
in the period January 2003 – June 2004; hourly data
were measured and elaborated, in order to
characterize the micro – climate conditions. Data
were compared with the optimal conditions given by
the UNI 10829 [3] and the Risk Index for the glass
NOMENCLATURE
RI = Risk Index (%);
W = solar radiation (W/m2).
Subscripts:
d = daily;
e = external;
h = hourly;
i = internal;
s = surface.
Greek Symbols
Ф = relative humidity (%);
∆T = temperature variation (K, °C);
∆Ф = relative humidity variation (%).
4st International Conference on Computational Heat and Mass Transfer
was evaluated. In the second part a numerical
simulation of the surface temperature distribution
over the glass was carried out, by means of Fluent 6.1
Software, in order to consider the temperature
difference between different points of the glass, the
thermal expansion of the glass and the rupture risk
[5].
THE
ARTISTIC
GLASS
DOMENICO’S BASILICA
OF
S.
23 m
The artistic glass of S. Domenico’s Basilica was built
in 1411; it was realized by Mariotto di Nardo and
Bartolomeo di Pietro, who signed the glass at the
right bottom part [8]. The glass is a “multiple lanced
window” located in the apse chapel, constituted by
many single glasses connected each other by a stone
structure (see figure 1); the glass is about 8 m wide
and 23 m high at the top.
8m
Figure 1
The artistic glass of S. Domenico’s Basilica
The glass represents the glorification of the
Domenican Order: there are at the bottom S.
Domenico and S. Pietro, in the central part some
Saints and Martires and at the top the S. Giacomo’s
life.
From 1411 until today the glass was subjected to
many restoration processes; very important was the
‘800 restoration, when many damaged panels were
substituted. The actual restoration is also very
important: the glass panels were removed from the
apse chapel and were sent to a restoration laboratory.
The glass restoration is now completed; in the
meantime the stone structure was also restored and it
is ready too. In the next months the collocation of the
glass panels in their original position and the design
of an external glass protection will be carried out.
THE MONITORING SYSTEM
A monitoring system was employed to measure the
thermoigrometrical conditions around the artistic
glass and to compare them with the optimal
conditions for its good preservation.
The measured parameters were:
- internal air temperature Ti;
- external air temperature Te;
- internal relative humidity Фi;
- external relative humidity Фe;
- external solar radiation Wi.
The measurement period was January 2003 – June
2004; the mentioned parameters were continuously
recorded and hourly averaged, as indicated by the
Italian Standard UNI 10829 [3], so it was possible to
calculate the parameters variation and their medium,
maximum and minimum values.
The acquisition system was composed by :
- a WMR 918 Cable Free Weather Station by
Oregon Scientific, for internal and external
temperature (precision: ± 0.2°C) and relative
humidity measurements (precision: ± 5%), located
at about 10 m from the bottom of the glass;
- an acquisition system Babuc/M by LSI – Lastem
for the solar global radiation measurements
(precision: ± 5 W/m2), located in correspondence
of the other probes, over a vertical surface parallel
to the external surface of the apse chapel;
- two thermoigrometers by Salmoiraghi, for the
internal temperature (accuracy: ± 0,5˚C) and
relative humidity measurements (accuracy: ± 3%),
located at the top and at the bottom of the glass.
The external temperature probe was screened from
the direct solar radiation; all the probes were located
so that dusts due to the structural restoration could
not cover them.
All recorded data were collected weekly and then
post-processed.
PRESERVATION OPTIMAL CONDITIONS
The works of art preservation is influenced by their
climatic history, because of the thermoigrometric
equilibrium between the work of art and the
environmental conditions in which it was put during
all its life. So it is very difficult to establish optimal
conditions for the preservation; the UNI 10829 gives
the optimal values for many kinds of material and
works of art, defining absolute values for air
temperature and relative humidity and their hourly
and daily variations. Optimal values of other
parameters such as UV radiation and dose of light
are also given, but they are not of interest in the
present work. The UNI 10829 gives the following
4st International Conference on Computational Heat and Mass Transfer
February
Frequency (%)
100
90
80
70
60
50
40
30
20
10
0
Normal
Normaldistribution
distribution
Cumulatedfrequency
frequency
Cumulated
5
6
7
8
9 10 11 12 13 14 15 16 17 18 19 20 21 22 23 24
Ti (°C)
August
100
90
80
70
60
50
40
30
20
10
0
Frequency (%)
The hourly values of the parameters above mentioned
were measured in the period January 2003 – June
2004. Data elaboration was carried out in compliance
with the UNI 10829: temperature and relative
humidity data with the statistical methodology of the
cumulative average were analyzed, considering the
monthly mean values of the parameters at each hour.
So the cumulative frequency and the normal
distribution for the hourly values and the hourly and
daily variations of the following parameters were
determined:
- internal air temperature;
- internal air relative humidity;
they are representative of the environment in which
the glass is put; so a first evaluation of the Risk Index
could be done. As an example, figures 2 and 3 show
the normal distribution and the cumulative curves of
the mentioned parameters in February 2003 and
August 2003, which are the coldest and the hottest
months of the monitoring period; the percentage of
time during which they are into the optimal ranges is
put in evidence and the corresponding Risk Index
could be evaluated.
Results show that in February:
- Ti values are too low with respect to the optimal
range; the internal air temperature is always below
19°C (RI = 100%);
- ∆Tih values are in the optimal range;
- ∆Tid values are higher than 1.5 °C in the 55% of the
time (RI = 55%);
- Фi values are out of the optimal range in the 96% of
the time (RI = 96%);
- ∆Фih values are in the optimal range;
- ∆Фid values are out of the optimal range in the 50 %
of the time (RI = 50%).
In August:
Normal
distribution
Normal distribution
Cumulated
frequency
Cumulated frequency
19
20
21
22
23
24
25
26
27
28
29
30
31
32
Ti (°C)
100
90
Frequency (%)
DATA ELABORATION AND ANALYSIS
- Ti values are too high with respect to the optimal
range; the internal air temperature is always upper
24°C (RI = 100%);
- ∆Tih values are in the optimal range;
- ∆Tid values are higher than 1.5 °C in the 70 % of
the time (RI = 70%);
- Фi values are out of the optimal range in the 33 %
of the time (RI = 33%);
- ∆Фih values are in the optimal range;
- ∆Фid values are always higher than 6% (RI =
100%).
The external air temperature and relative humidity
were important to calculate the equilibrium surface
temperature of the glass and the relative humidity of
the external environment, in order to evaluate the
real Risk Index of the glass.
80
70
60
50
40
30
20
10
0
August
cumulated
August
cumulated
frequency
frequency
February cumulated
February
cumulated
frequency
frequency
0
0,5
1
100
Frequency (%)
values of the optimal parameters for the painted
internal surface of the glass:
- T = 19 – 24 °C;
- ∆Td = 1.5 °C;
- ∆Th = 1.5 °C;
- Ф = 40 – 55%.
No values are given for ∆Фh and ∆Фd, but the glass is
painted in the internal side, so values given for
paintings could be considered:
- ∆Фh = 6%;
- ∆Фd = 6%.
The UNI 10829 defines the Risk Index RI as the
percentage of time, during a month, in which a
parameter is out of the optimal range. It could be
calculated by a statistical elaboration of the data and
employing the frequency cumulative curve of each
parameter.
1,5
2
∆Tih (°C)
2,5
3
90
80
70
60
August cumulated
August cumulated
frequency
frequency
February
February cumulated
cumulated
frequency
frequency
50
40
30
20
10
0
0
0,5
1
1,5
2
2,5
3
3,5
4
4,5
∆Tid (°C)
5
5,5
6
6,5
7
7,5
Figure 2
February and August: statistical elaboration of
internal temperature data
8
February
100
90
80
70
60
50
40
30
20
10
0
Normal distribution
Cumulated frequency
Frequency (%)
0
Frequency (%)
20
30
40
100
90
80
70
60
50
40
30
20
10
0
50
Φi (%)
August
60
70
80
90
100
Normal distribution
Cumulated frequency
0
10
20
30
40
50
Φi (%)
60
70
80
90
January
February
March
April
May
June
July
August
September
October
November
December
January
February
March
April
May
June
100
100
90
80
70
August cumulated
frequency
February cumulated
frequency
60
50
40
30
20
10
0
0
1
2
3
4
5
6
∆Φih (%)
100
7
8
9
10
90
80
2004
Frequency (%)
10
- RI associated to Фi is high (> 85%) in January,
February, March, April and November, while in the
other months it is quite low (< 50%);
- RI associated to ∆Фih is always low;
- RI associated to ∆Фid is maximum in August (RI =
100%); it is quite high in April, June and July (≈
70%) and quite low in the other months (< 55%).
Values relative to the first six months of 2004 are
similar to the ones of 2003, so the obtained values
could be considered reliable also for the other
months.
Table 1
RI values in the period January 2003 – June 2004
2003
Frequency (%)
4st International Conference on Computational Heat and Mass Transfer
70
60
August
cumulated
August
cumulated
frequency
frequency
April cumulated
February
cumulated
frequency
frequency
50
40
30
20
10
6
8
10
12
14
16
18
20
22
∆Tid
18
55
20
62
20
76
81
69
50
56
20
21
14
47
22
65
24
86
Фi
93
96
96
88
42
25
34
33
50
45
96
66
95
100
100
90
42
25
∆Фih
0
0
0
0
0
0
0
0
1
0
0
0
0
0
0
1
1
0
∆Фid
50
50
30
72
50
70
70
100
54
63
40
40
50
55
30
75
50
73
90
80
24
∆Φid (%)
Figure 3
February and August: statistical elaboration of
internal relative humidity data
Data were employed as inputs in the simulation
described below. Table 1 and figure 4 show the Risk
Indexes in the period of measurement January 2003 June 2004 for the internal air temperature and relative
humidity and their hourly and daily variations. The
elaborated parameters were compared with the
preservation optimal conditions; results show that:
- RI associated to Ti is high in all the months, being
the internal temperature too high in the hot months
and too low in the cold ones with respect to the
optimal range; it is relatively low only in September
(RI = 18%);
- RI associated to ∆Tih is always low;
- RI associated to ∆Tid is quite low (< 65%), even if
in the hot months (June, July and August) it
becomes relevant (> 75%);
70
60
50
40
30
20
Ti
∆Tih
∆Tid
Фi
∆Фih
∆Фid
10
0
Ja
Fe nua
br ry
ua
M ry
ar
ch
A
pr
i
M l
a
Ju y
ne
J
S Au uly
ep g
te us
m t
O be
N cto r
ov b
D em er
ec b
em er
Ja be
r
Fe nua
br ry
ua
M ry
ar
ch
A
pr
il
M
a
Ju y
ne
4
RI (%)
2
∆Tih
0
0
0
0
0
1
1
0
0
1
2
0
0
0
0
0
0
0
100
0
0
Ti
100
100
100
100
62
85
66
100
18
70
100
100
100
100
100
100
68
82
Figure 4
RI trend in the period January 2003 – June 2004
TEMPERATURE DISTRIBUTION ON THE
ARTISTIC GLASS: SIMULATION
The thermal strain and stress depend on the surface
temperature distribution over the artistic glass, so a
simulation was carried out employing the Fluent 6.1
software. The micro – climate and sunlight
conditions determine the surface temperature
distribution; some situations in which thermal stress
is more relevant must be chosen, in order to consider
the most critical conditions for the glass. So the
surface temperature distribution was evaluated in
February and August. In February the surface
4st International Conference on Computational Heat and Mass Transfer
temperature distribution was calculated at 2.00 a.m.,
which is the coldest hour of the day. In August the
surface temperature distribution was calculated in the
hottest hour of the day (13.00 p.m.), when the
temperature difference between internal and external
air is highest and the solar radiation is at its peak. It is
the sum of the direct and diffuse components,
calculated from the measured global solar radiation: a
value of 390 W/m2 for total solar radiation was
considered (308 W/m2 direct fraction and 82 W/m2
diffuse fraction). The geometrical model was first
built, composed of a parallelepiped volume (Figure
4), the inner of which represents a part of the
Basilica’s volume; the artistic glass is one of the
boundary surfaces of the considered volume. The
artistic glass was represented as a surface because of
its low thickness with respect to the other dimensions,
so its internal temperature was considered constant
and equivalent to the surface one.
15
14
13
7
8
9
1
2
3
10 11 12
4
5
6
Figure 4
Domain employed in the simulation and zones in which
was divided the artistic glass
Table 2
Averaged absorption coefficient of the artistic glass for
normal incidence and diffuse radiation
Zone
1
2
3
4
5
6
7
8
Normal
incidence
0.314
0.324
0.315
0.314
0.304
0.313
0.324
0.339
Diffuse
radiation
0.261
0.269
0.261
0.260
0.252
0.260
0.269
0.281
Zone
9
10
11
12
13
14
15
Normal
incidence
0.328
0.353
0.349
0.353
0.375
0.379
0.387
Diffuse
radiation
0.272
0.293
0.290
0.294
0.309
0.311
0.315
The dimensions of the domain employed in the
simulation are: depth 20 m, height 23 m and width 8
m. The artistic glass was divided into 15 distinct zones
(Figure 4); for each one the mean absorption coefficient
of the glass was calculated as the mean of the
absorption coefficients of the different colours,
wheighed on the area of each surface (table 2).
The Fluent software is based on finite volumes [9, 10];
two kinds of mesh were employed:
- close mesh, in the 15 zones of the artistic glass;
- wide mesh, in the parallelepiped volume.
The software also requests the following properties of
the materials involved in the model as input data:
density, specific heat, thermal conductivity, viscosity.
The values in Table 3 were considered.
Table 3
Input data in the simulation: material properties
Material
Air
Wall
Glass
ρ (kg/m3)
1.225
1700
2720
cp (j/kgK)
1006
464
838
K (W/mK)
0.0242
0.65
0.14
µ (kg/ms)
1.789e-5
0
0
To simulate the heat transfer between internal and
external air through the artistic glass were activated the
following models of Fluent 6.1 [10, 11, 12]:
- radiative model DO (Discrete Ordinate), suitable
for simulating radiative flows through semi –
transparent means;
- standard k-ε model, for simulating the turbulent air
motion;
- Boussinesque model, for simulating the convective
motion inside the church.
The radiative and convective flows between the glass
surface and the external air were considered; an
external heat transfer (convection and radiation)
coefficient of 23.2 W/m2K was chosen. For the other
surfaces of the domain, adiabatic conditions were
imposed, so that heat transfer is present only through
the artistic glass.
Results of the simulation related to August are
shown in figure 5. The surface temperature of the
artistic glass is quite constant in each one of the 15
zones, except for the zones 13, 14 and 15, where a
maximum value of 308 K was found; they are
characterized by a higher absorption coefficient. In
each zone the temperature decreases near the stone
structure and the difference between the most high
temperature and the most low is 7 K. The simulation
for each hour of February and August mean monthly
day was repeated, in order to calculate the Risk
Index in Table 4. Results show that RI associated to
the surface temperature is very high (RI = 100%)
both for August and February; the RI for ∆Th are
quite low. The UNI 10829 suggests also the
calculation of RI due to the temperature difference
between the glass and the internal air; results show
that it is quite high (≥ 50%). In the months of
February and August, the results confirm a high Risk
4st International Conference on Computational Heat and Mass Transfer
Index for the artistic glass, as calculated through the
experimental data.
308 K
307 K
306 K
305 K
304 K
303 K
302 K
REFERENCES
301 K
Figure 5
Temperature distribution on the artistic glass at the
13.00 p.m. of the August monthly mean day
Table 4
Risk Index evaluation on the artistic glass In
February and August
Parameter
Ts (°C)
∆Tsh (°C)
∆T internal air - glass (°C)
Artistic glass
respectively the coldest and the hottest month of the
monitoring period, with the most critical conditions
for the glass. Results show that the micro – climate
conditions near the artistic glass present high Risk
Indexes; in February and August the artistic glass
surface temperature values are always out of the
optimal range (RI = 100%), so this preliminary
analysis shows that it is necessary to protect the
artistic glass after restoration, in order to decrease its
surface temperature. So it could be possible to
reduce the damaging risk due to the environmental
conditions.
Optimal
values
19 - 24
1.5
1.5
August
100
12.5
62.5
RI %
February
100
5
50
CONCLUSIONS
In the present paper the state of preservation of the
artistic glass in the apse chapel of S. Domenico’s
Basilica in Perugia was analyzed.
The micro – climate conditions were monitored in the
period January 2003– June 2004 and a thermal
analysis of the artistic glass by means of the
thermofluidynamic software Fluent 6.1 was carried
out. The thermoigrometric measured parameters were
compared with the optimal preservation values, in
compliance with the UNI 10829. It suggests the
calculation of the Risk Index associated to the
different measured and simulated parameters, defined
as the percentage of time, during a month, in which
the values of each parameter and its hourly and daily
variations are outside the optimal range. The RI due
to Ti is always high (62 ÷ 100%) both in the cold and
the hot months, while the one due to Фi is high in the
cold and spring months (> 85%). The RI due to the Ti
and Фi hourly variations is always low, while the one
due to the daily variations is high only in the hot
months (> 70%). The Risk Indexes due to the glass
surface temperature for February and August were
calculated by a simulation; they represent
1. C. Buratti, F. Cotana, M. Felli, Sulla ventilazione di
una vetrata artistica nel Duomo di Perugia, 49°
Congresso Nazionale ATI, Perugia, 1994 (in Italian).
2. F. Asdrubali, C. Buratti, 1999, Condizioni ottimali di
conservazione delle opere d’arte: rassegna
bibliografica ed analisi critica, 54° Congresso
Nazionale ATI, L’Aquila, 1999 (in Italian).
3. UNI 10829, Beni di interesse storico artistico.
Condizioni ambientali di conservazione. Misurazione
e analisi, 1999 (in Italian).
4. F. Asdrubali, C. Buratti, F. Cotana, Il sistema di
ventilazione della vetrata di Arrigo Fiammingo nel
Duomo di Perugia: monitoraggio delle condizioni
termoigrometriche, 54° Congresso Nazionale ATI,
L’Aquila, settembre 1999 (in Italian).
5. C. Buratti, Analysis of the thermal stress and strain on
Arrigo Fiammingo’s artistic window in the Cathedral
of Perugia, Journal of Heat Transfer, ASME, Vol. 123,
2001.
6. C. Buratti, Aging influence on the thermal and optical
properties of artistic glasses: experimental data and
comparison, The 6th ASME-JSME Thermal
Engineering Joint Conference, Hawaii, 2003.
7. C. Buratti, F. Asdrubali, R. Mariani, Misura delle
proprietà spettrofotometriche di alcuni pannelli
restaurati della vetrata di S. Domenico a Perugia, 58˚
Congresso Nazionale ATI, S. Martino di Castrozza,
2003 (in Italian).
8. G. Marchini, Le vetrate dell’Umbria, CVMA Italia,
vol. I, Roma, 1973 (in Italian).
9. G. Comini, Fondamenti di termofluidodinamica
computazionale, SG Editoriali, Padova, 2001(in
Italian).
10. Chima, Yokota, Numerical Analysis of Three
Dimensional Viscous Internal Flows, AIAA Journal,
1990.
11. S.V. Patankar, Numerical Heat Transfer and Fluid
Flow, McGrow – Hill Book Company, 1990.
12. C. Wilcox, Turbolence Modeling for CFD, DCW
Industries, 1998.
Scarica